 Wei Zhao1
 Zheng Si
94% of researchers rate our articles as excellent or good
Learn more about the work of our research integrity team to safeguard the quality of each article we publish.
Find out more
ORIGINAL RESEARCH article
Front. Mater., 08 September 2023
Sec. Structural Materials
Volume 10 - 2023 | https://doi.org/10.3389/fmats.2023.1201961
Abstract
The morphology and volume fraction of coarse aggregate particles significantly influence the mechanical characteristics of concrete. This paper presents the development of a numerical model for pebble concrete by combining experiments with the discrete element method. The mesoscopic parameters between mortars and the contact surface between mortars and aggregates in the model were calibrated by comparing simulated stress–strain relationships with experimental data from pebble concrete. Subsequently, the model and mesoscopic parameters were validated by comparing them with experimental results. The obtained mesoscopic parameters were then utilized in the numerical modeling of uniaxial compression for single-shaped coarse aggregate concrete. Results showed that the peak stress of the elliptical aggregate concrete was 2.8 MPa higher than that of the oblate spherical aggregate concrete, leading to more cracks and severe damage in the former. Thus, elliptical aggregates proved more suitable as coarse aggregates for concrete than oblate spherical aggregates. Furthermore, the study investigated the influence of ellipsoidal aggregate volume fraction on concrete strength. The compressive strength reached the highest when the volume fraction of ellipsoidal aggregate was 57%. Therefore, the ideal coarse aggregate volume fraction was determined to be 57%. These results offer valuable insights into designing concrete mix proportions.
Concrete is currently the most widely utilized building material due to its high strength, ample raw material availability, and inexpensive cost (Du et al., 2023). The mechanical properties of concrete structures are of utmost importance for their dependability and service life (Pacheco et al., 2019; Du et al., 2022a). The most common method used to assess the mechanical characteristics of concrete is the uniaxial compression test (Si et al., 2020). However, precisely examining the impact of the complex multiphase and multiscale properties of concrete on its mechanical properties is challenging. In regards to testing, investigating the effect of different components within the concrete specimen on its mechanical characteristics is time consuming, and the results can easily be influenced by external factors (Wei et al., 2020; Wu et al., 2023). Therefore, developing effective methods to accurately describe the genuine meso-structure of concrete and analyze the relationship between its mechanical properties and meso-structure has always been a research priority (Zuo and Liu, 2021; He and Liu, 2023).
At present, many scholars have studied the relationship between the mechanical properties of concrete and the type and particle size of coarse aggregates by using traditional laboratory methods. Zhang et al. (2023) investigated the effect of different types of coarse aggregates on the strength and pore structure of concrete using nuclear magnetic resonance. They found that gravel, as a coarse aggregate, had a greater influence on the mechanical properties of concrete than shale cementite. In another study, Huang et al. (2018) examined three types of coarse aggregates (e.g., natural coarse aggregate, recycled coarse aggregate, and coral coarse aggregate) and their influence on the deformation distribution and fracture propagation of concrete. Their tests showed that concrete with natural and recycled aggregates exhibited higher ductility compared to coral aggregate concrete, whereas the strength of the coral aggregate concrete was observed to be higher. Moreover, the coarse aggregate type significantly affected the distribution of the axial deformation field in concrete. Dolatabad et al. (2020) investigated the influence of three different types of lightweight aggregates on the mechanical properties of concrete. They found that the addition of lightweight aggregate to concrete reduced its mechanical qualities and increased its water absorption rate due to the high water absorption rate of lightweight aggregates. Additionally, Khaleel et al. (2011) discovered that the type and particle size of coarse aggregates had a considerable influence on the mechanical properties of concrete. Crushed limestone, as a coarse aggregate, exhibited better mechanical performance than gravel-made concrete. They also observed that the fluidity of concrete decreased rapidly as the coarse aggregate size increased, while the concrete strength improved with larger coarse aggregate sizes. Overall, multiple studies have demonstrated that the mechanical properties of concrete are influenced not only by the type and particle size of coarse aggregate but also by the morphology and volume fraction of it (Aïssoun et al., 2016; Adhikary et al., 2022).
The rapid growth of computer technology has made numerical simulation a vital tool for researching concrete mesoscale failure. This approach not only replaces the complex operation procedures of traditional macro testing but also reduces test costs and prevents errors caused by human and environmental factors. Currently, two primary methods for mesoscopic simulation of concrete are widely being used: the finite element method and the discrete element method (DEM) (Zhou et al., 2021). Shane et al. (2000) investigated the conductivity of cement mortar by developing a model with a spherical aggregate, a constant width interface transition zone, and a homogeneous matrix paste. The findings demonstrated that the conductivity of cement mortar was related to the volume fraction of sand and the degree of cement hydration. Using the DEM, Remond and Pizette (2014) developed a numerical model of concrete with spherical particles as the coarse aggregate. They found that the Bingham model could approximate the workability of concrete. In another study, Zhang et al. (2021) discovered that the concrete model with a spherical coarse aggregate exhibited superior fluidity compared to the concrete model with an irregular coarse aggregate. This conclusion was drawn after creating concrete, discrete element models of several types of coarse aggregates. Liu and Han (2017) used ANSYS finite element software to investigate the dynamic destructive procedure of two-graded circular aggregate concrete and the effect of aggregate particle size on the dynamic performance of concrete. Furthermore, Wang et al. (2019) explored the influence of the random distribution of aggregate and aggregate shape on the mesoscale failure of concrete under uniaxial tension using ABAQUS finite element software and the multiscale homogenization modeling approach.
Examining the influence of coarse aggregate morphology and volume fraction on the strength and failure mechanism of concrete is critical. However, various uncontrollable factors can affect the results in the traditional laboratory methods, leading to reduced reliability. Meanwhile, analyzing the impact of one factor on concrete performance while keeping other factors constant is challenging. Moreover, using spherical aggregate in the DEM and finite element method to simulate different aggregate morphologies may not accurately represent the actual structure inside the concrete. This paper integrates the CT scanner with the clump technology of the particle flow DEM program PFC3D to address these limitations to develop a discrete element model of the pebble coarse aggregate. This model is consistent with the actual coarse aggregate, enabling a more realistic simulation of the internal structure of concrete. Therefore, this paper aims to investigate the effects of aggregate morphology and volume fraction on the mechanical properties and failure model of concrete during uniaxial compression. The research seeks to provide a solid theoretical foundation for concrete design.
The cement used in this study was ordinary Portland cement of P⋅O42.5. First-grade fly ash from a power plant and a high-efficiency water-reducing agent were employed as supplementary materials. The coarse aggregate comprised two-graded pebbles with generally ellipsoidal and oblate shapes, particle sizes ranging from 5 to 10 mm and 10 to 20 mm, and a density of 2700 kg/m3 (Figure 1). River sand with a fineness modulus of 2.5 was used as the fine aggregate. Concrete specimens were prepared and cured in accordance with relevant standards (Chinese Standard, 2016). Three prismatic pebble concrete specimens, each with the dimensions of 100 × 100 × 400 mm3, were produced (Figure 2). The mixed proportion of the pebble concrete is shown in Table 1.
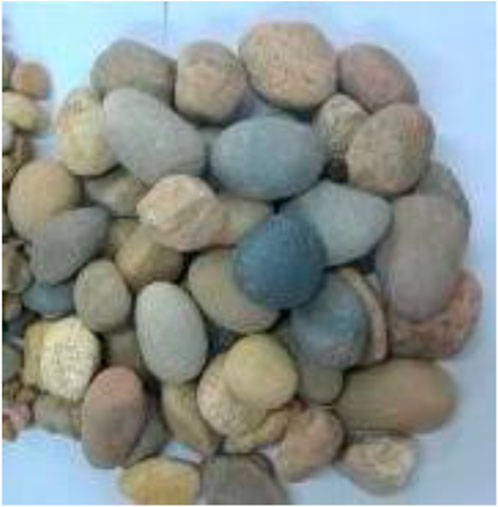
FIGURE 1. Natural pebble coarse aggregate.
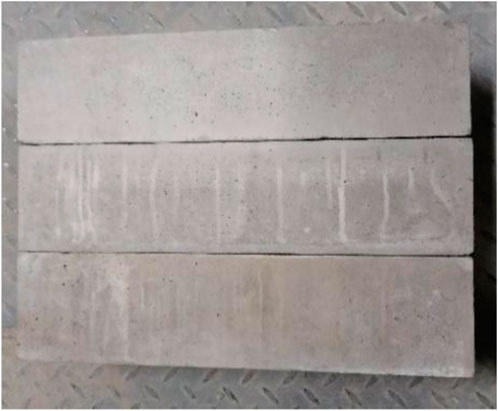
FIGURE 2. Pebble concrete specimen.
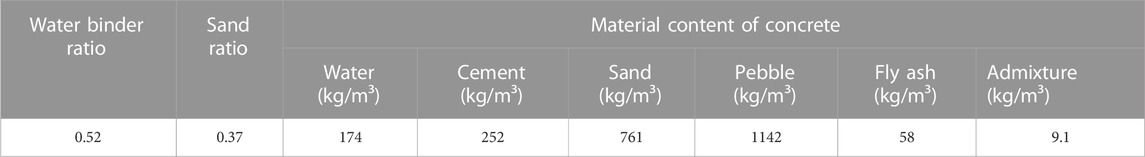
TABLE 1. Pebble concrete mix proportion.
The roundness and sphericity of pebble coarse aggregates were determined by selecting regular pebble coarse aggregate particles. Particle roundness refers to how closely the outer contour of particles resembles a circle, and its calculation is shown in Eq. 1. Particle sphericity refers to how closely the shape of particles resembles that of spheres, and its calculation is shown in Eq. 2. The roundness and sphericity values of the oblate spherical aggregate were 0.801 and 0.729, respectively, while the roundness and sphericity values of the ellipsoidal aggregate were 0.907 and 0.847, respectively.
where
The uniaxial compression was performed after curing the pebble concrete for 28 days in a standard curing box. Strain gauges were affixed to the surface of the pebble concrete during the test to determine the compressive strength, peak strain, and stress–strain curves. The specimen was compressed using a universal testing machine (Figure 3). The test procedures were as follows: a pre-compressive load of 2 kN was initially applied to the pebble concrete. Then, the downward speed of the testing machine was set to 0.5 mm/s. The test was terminated when the strain reached 3 × 10⁻³.
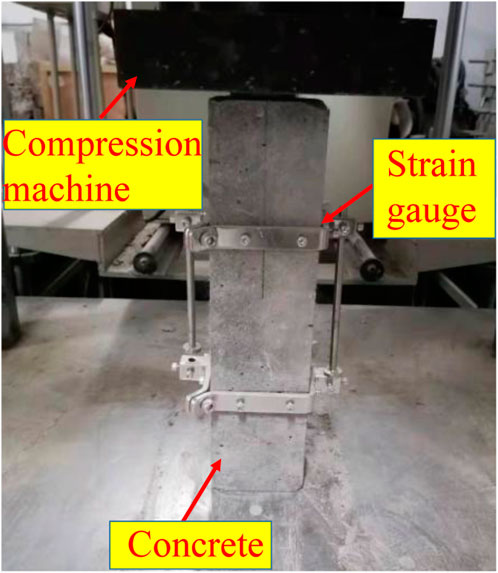
FIGURE 3. Uniaxial compression test of the pebble concrete.
According to relevant standards (Chinese Standard, 2006), the compressive strength of concrete was defined as the mean value of peak stress of three specimens. If the difference between the maximum and minimum values of peak stress and the median value in the three specimens was less than 15% of the median value, the middle value was considered the compressive strength of the concrete. However, the test should be repeated if the difference exceeds 15% of the median value. The peak stress and strain values are shown in Table 2, and the stress–strain curves are shown in Figure 4.
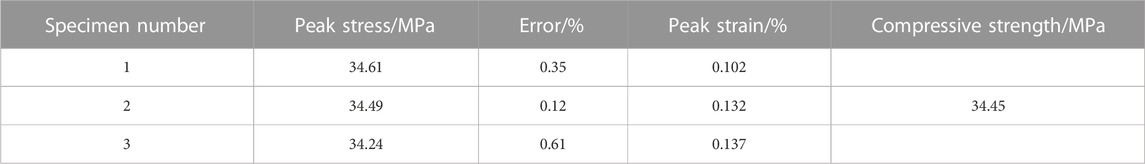
TABLE 2. Mechanical parameters of three specimens.
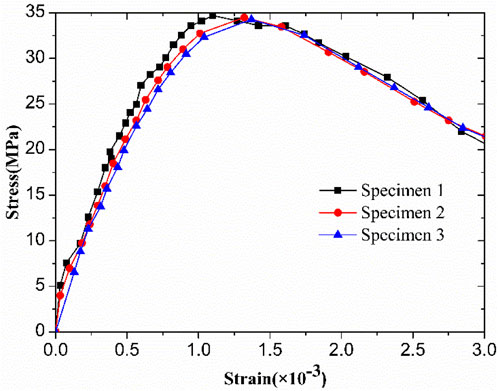
FIGURE 4. Stress–strain curves of the pebble concrete.
The peak stress, peak strain, and stress–strain curves of the three specimens in Table 2 and Figure 4were very similar, and the compressive strength of the pebble concrete was determined to be 34.45 MPa. The stress–strain curve with the slightest discrepancy between the compressive strength of concrete and the peak stress was chosen to select the final stress–strain curve. In this case, the stress–strain curve of specimen 2 was identified as the final stress–strain curve and was used to calibrate the mesoparameters of the pebble concrete numerical model.
The DEM considers a collection of discrete, independently moving particles. It simulates mechanical interactions between these particles by modeling their movement and interactions (Nicot et al., 2017; Jiang et al., 2018; Shen et al., 2019). This approach avoids the macroscopic continuity assumption of classic mechanical models by directly simulating particle interactions. It can represent bodies by combining different pebbles into a “clump” while allowing for particle displacement to simulate large material deformations.
The DEM is implemented using particle flow code (PFC) software (Itasca Consulting Group, 2018), enabling discrete particles’ displacement and rotation. PFC offers three types of constitutive contact models between different particles: linear (linear contact model), linearcbond (linear contact bonding model), and linearpbond (linear parallel bonding model). The linearpbond model is used to simulate the mechanical behavior of the bonding materials. This model comprises two components: a linear component and a parallel bonding component. The linear parallel bond contact model is employed for the concrete contact model (Xie et al., 2020; Du et al., 2022b). The contact force simulated by this model comprises two sections: the force generated when the particles slide and the tensile strength and tensile moment of the cementitious materials. In the DEM model, the material particles are connected by a disk, and contact between particles occurs within a minimal range. The contact characteristic is viscous, allowing particles to “overlap” at the contact site. The degree of overlap is represented by the thickness of the contact disk (Figure 5). The amount of overlap is related to the contact force and determined by the microscopic parameters of the model, exhibiting a specific binding strength. Notably, the amount of “overlap” is minimal compared with the particle size.
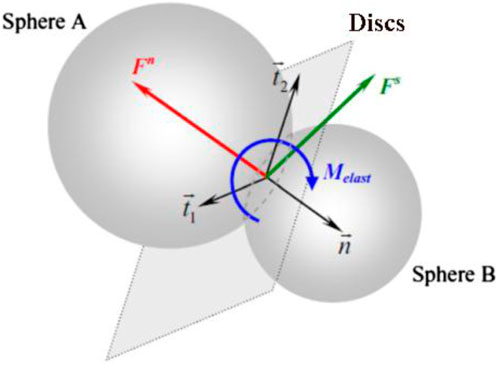
FIGURE 5. Interaction of discrete particles.
In the numerical simulation of PFC3D, the primary particle shape was spherical. However, the clump technology could also be employed in PFC (Xie et al., 2020; Du et al., 2022a). The user could generate the clump templates of various shapes during the simulation procedure using a CT scanner. These clump templates can then be loaded into PFC3D to generate the coarse aggregate particle shape required for the discrete element model. The CT results of the pebble coarse aggregate are shown in Figure 6. Each clump contains multiple pebbles, making it a collection of pebbles. A clump exhibits a complex outline formed by overlapping pebbles and can be utilized to create coarse aggregates of various morphologies. The radius and position of the pebbles play a crucial role in determining the surface of the clump. The internal and contact properties of clumps are essentially the same as those of spherical particles. They can rotate and translate and satisfy the force, displacement, and motion equations (Itasca Consulting Group, 2018). This study used oblate spherical and ellipsoid coarse aggregates in the pebble concrete to simulate the influence of coarse aggregates with different particle morphologies on the uniaxial compressive behavior of the pebble concrete, as shown in Figure 7. The roundness and sphericity values of the oblate spheroid aggregate were 0.801 and 0.729, respectively. The roundness and sphericity values for the ellipsoidal aggregate were 0.907 and 0.847, respectively.
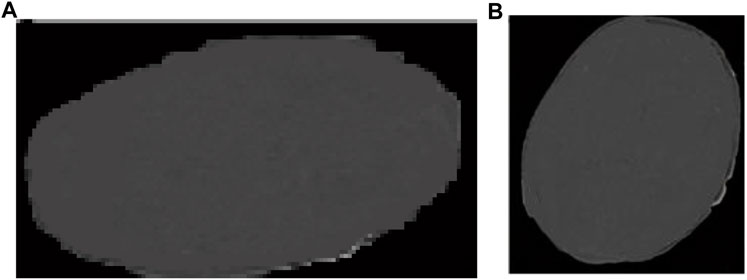
FIGURE 6. CT scanning morphological characteristics of the coarse aggregate (A) Oblate sphere (B) Elliptical.
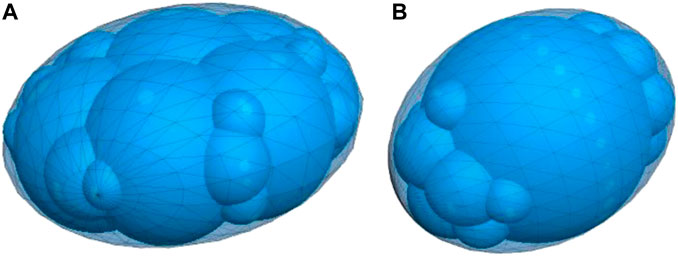
FIGURE 7. Morphological characteristics of the coarse aggregate discrete element model (A) Oblate sphere; (B) Elliptical.
The DEM model of the pebble concrete was developed in several stages. First, the boundary walls were generated based on the actual size of the concrete (100 mm × 100 mm × 400 mm). Then, small spherical grains were stochastically developed within the boundary walls to simulate mortar. Finally, coarse aggregates of various shapes were created to form the pebbled concrete using the clump technology (with a clump radius ranging from 5 mm to 20 mm) (Figure 8). The spherical particles and coarse aggregates were randomly distributed (Tran et al., 2011). The density of mortar was 2450 kg/m3, while the density of pebble aggregates was 2700 kg/m3. The coarse aggregates in the pebble concrete consisted of oblate spherical and ellipsoid aggregates, as shown in Figure 9. The overall dimensions of the model were 100 mm × 100 mm × 400 mm, with the x- and y-axis running horizontally and the z-axis running vertically. For simplicity, the effect of the cement mortar particle size (i.e., spherical particles) on concrete characteristics was omitted (Guo et al., 2013). The radius of the spherical particles in the concrete model was set within the range of 0.5 mm–2.0 mm. Subsequently, using the FISH language, PFC3D was used to simulate the actual mix design of the concrete.
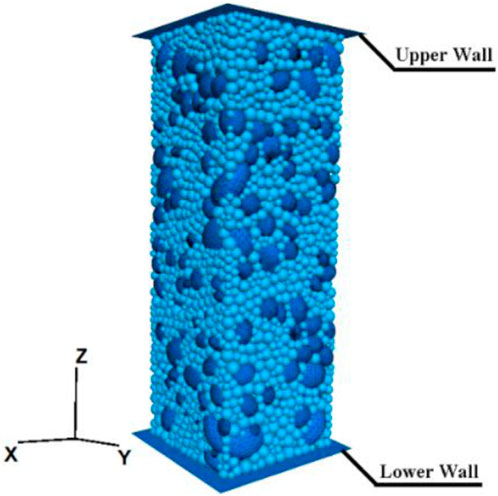
FIGURE 8. Model of the pebble concrete.
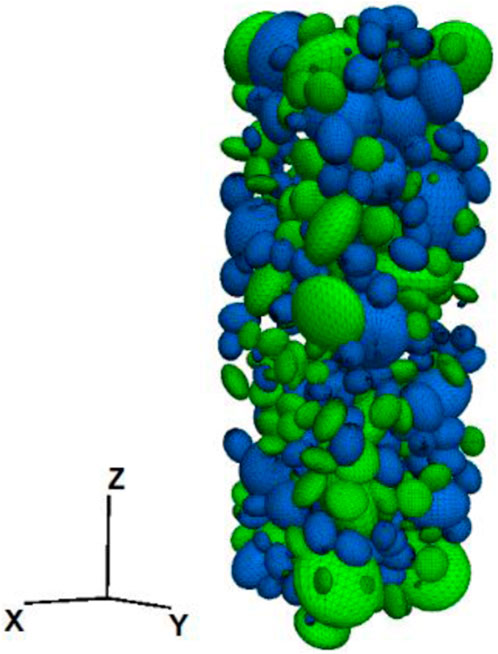
FIGURE 9. Model of the pebble coarse aggregate.
The most crucial aspect of numerical simulation with PFC is obtaining the mesoparameters of the model. By selecting appropriate mesoparameter values, the PFC model can simulate the macro-mechanical properties of the concrete. As these mesoparameters cannot directly be measured in the field or through conventional tests, they must be established through continuous selection and trial calculations to correspond with the macro-physical parameters (Nitka and Tejchman, 2020; Prakash et al., 2020). This paper simulated the uniaxial compressive behavior of the pebble concrete, and the stress–strain curves were compared to experimental data to identify the mesoscopic parameters of the pebble concrete model. The contact mesoparameters to be calibrated include emod, kratio, fric, pb_emod, pb_kratio, pb_radius, pb_nstrength, and pb_sstrength. The specific significance of these mesoparameters can be found in the work of Itasca Consulting Group (2018). Unlike previous numerical simulations of concrete that only examined the contact parameters between the mortar (Kang et al., 2013), this study considered both the mesoscopic parameters between mortars and the mesoscopic parameters corresponding to the contact surface between the mortar and aggregates. To simulate the uniaxial compression of the pebble concrete model, a set of appropriate contact mesoparameters was established (Table 3). The uniaxial compression of the pebble concrete model was simulated by keeping the lower wall stationary and pushing the upper wall downward (Figure 8). The downward speed of the upper wall was set at 0.5 mm/s to simulate the compressive load supplied by the testing machine. The model terminated loading when the strain reached 3 × 10⁻³, and the stress–strain curve of the pebble concrete model was obtained (Figure 10).
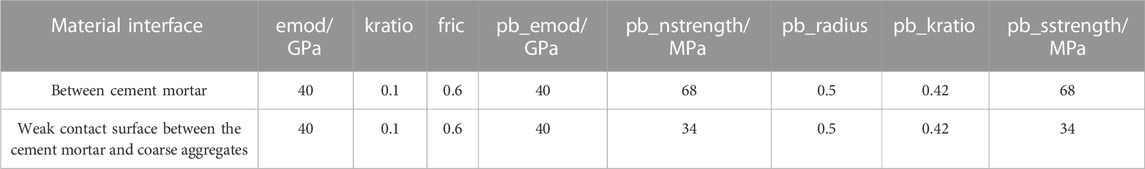
TABLE 3. Mesoparameters of the pebble concrete model.
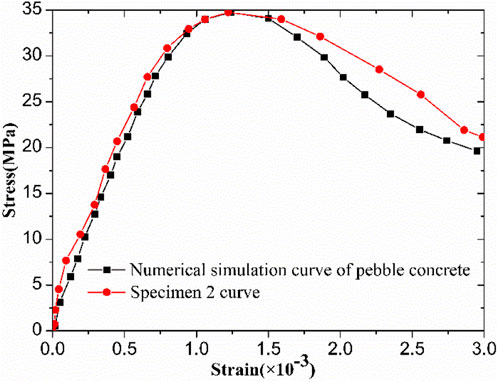
FIGURE 10. Stress–strain curves of test and DEM simulation.
Figure 10 shows that the stress–strain curve obtained from the test and the stress–strain curve acquired from the simulation were in good agreement. The difference in peak stress and peak strain between the two curves was insignificant. However, a significant disparity was observed in the post-peak softening stage of the curve. This difference can be attributed to the fact that the particle shape of the model was singular, and the binding forces between particles were minimal. As the peak stress of the model was reached, some of the critical bonds between particles were broken, resulting in reduced restriction and binding forces among the particles. Consequently, the post-peak descending stage of the DEM model fell faster. Overall, the stress–strain curve of the pebble concrete simulated by PFC3D simulation closely matched the test. This finding indicates that the established model can effectively affect the uniaxial compression failure of the pebble concrete.
The compressive deformation of the specimen can be represented by the axial displacement of the particles in the pebble concrete model. To validate the DEM model and mesoparameters, the axial compression displacement obtained from the test (Figure 11) was compared with the axial displacement generated by the DEM model at a strain rate of 3 × 10⁻³ (Figure 12). The axial compression deformation of the pebble concrete was measured using a vernier caliper. Each specimen was measured three times, and the mean value was taken as the axial displacement of the specimen. The axial compression deformation obtained from testing was 1.104 mm, while the axial displacement of the particles determined by numerical modeling was 1.194 mm. Therefore, the test and numerical simulation axial displacements were very close, with a relative error of 7.5% (Table 4). This result demonstrates that the generated pebble concrete model and the calibrated mesoscopic parameters were satisfactory.
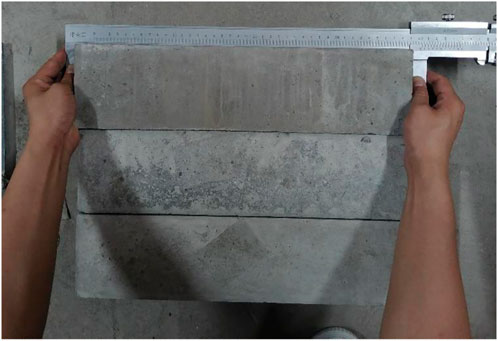
FIGURE 11. Height measurement of the specimen before uniaxial compression.
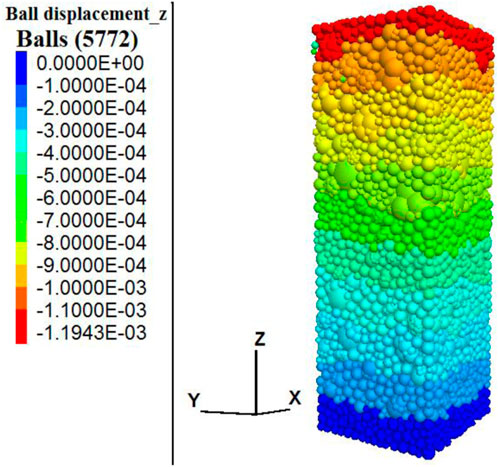
FIGURE 12. Axial particle displacement of the pebble concrete model under uniaxial compression.
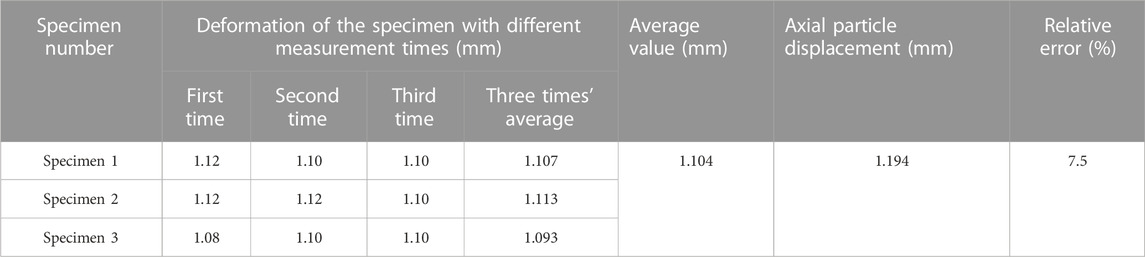
TABLE 4. Compression deformation and axial displacement of particles.
PFC was used to develop a single-shaped coarse aggregate concrete DEM model, as shown in Figures 13A, B. The mesoparameters obtained from the uniaxial compression simulation of the pebble concrete (Table 3) were utilized in the single-shaped coarse aggregate concrete model. The stress–strain curves were obtained by simulating the uniaxial compression of the single-shaped coarse aggregate concrete model, as shown in Figure 14.
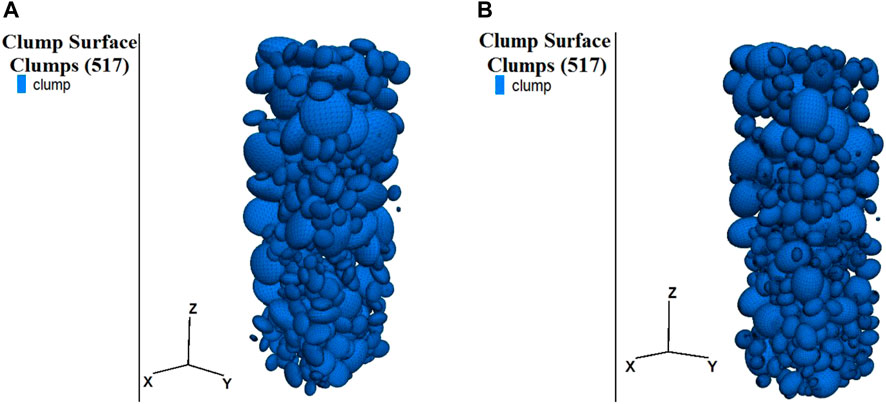
FIGURE 13. Concrete model of the coarse aggregate with different particle morphologies (A) Oblate sphere; (B) Elliptical.
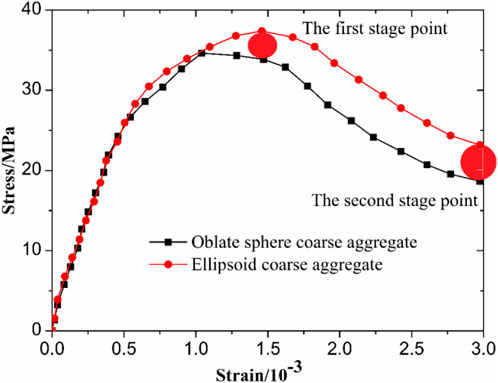
FIGURE 14. Stress–strain curves of coarse aggregate models with different particle morphologies.
Figure 14 reveals that the peak stress of the ellipsoidal aggregate concrete was higher than that of the oblate spherical aggregate concrete, and the post-peak softening effect of the ellipsoidal and oblate spherical aggregate concrete was similar. In particular, the peak stress of the ellipsoidal aggregate concrete was approximately 2.8 MPa higher than that of the oblate spherical aggregate concrete. Therefore, the ellipsoidal aggregate exhibits better compressive strength in the concrete.
The analysis of the simulation results of uniaxial concrete compression with various aggregate morphologies showed that the compression process involves two stage points (Figure 14). The first stage point is the peak stress of the specimen, and the second stage point corresponds to the fracture stress at a strain of 3 × 10⁻³. Concrete retains its bearing capacity before the first stage point and only a few cracks form. As a result, the research on the mesoscale failure characteristics of concrete with different coarse aggregate morphologies is focused on the second stage point.
In the pebble concrete model, the particle-to-particle contact was governed by the linearpbond model. When the linearpbond stress exceeded the bond strength, the linearpbond structure was broken, thereby forming micro-cracks between the particles. Particularly, shear cracks were formed when the tangential bond strength was exceeded, while tensile cracks were generated when the normal bond strength was exceeded (Potyondy and Cundall, 2004). As the binding between particles breaks in this model, the internal stress of the concrete is redistributed, leading to the eventual macro failure of the concrete material through the connection and growth of micro-cracks. This process is represented by the number of fragments in PFC3D. Figures 15, 16 show the micro-cracks and macro failure states at the second stage point for oblate spherical and ellipsoidal coarse aggregate concretes, respectively.
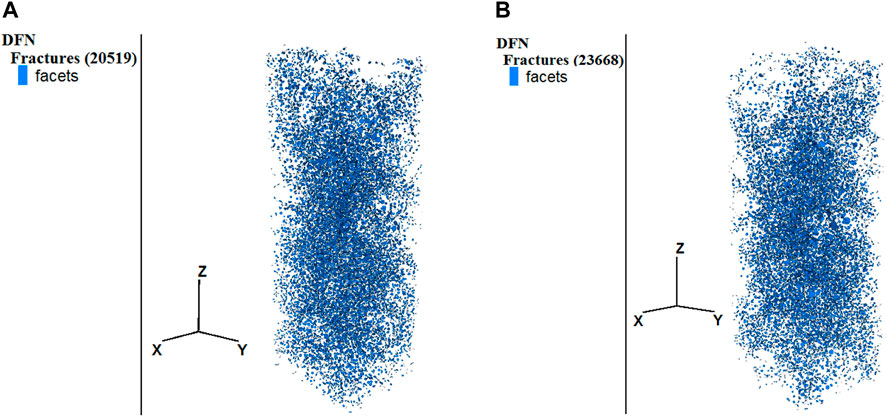
FIGURE 15. Micro-crack distribution of the single-shaped coarse aggregate concrete in the second stage point (A) Oblate sphere (B) Elliptical.
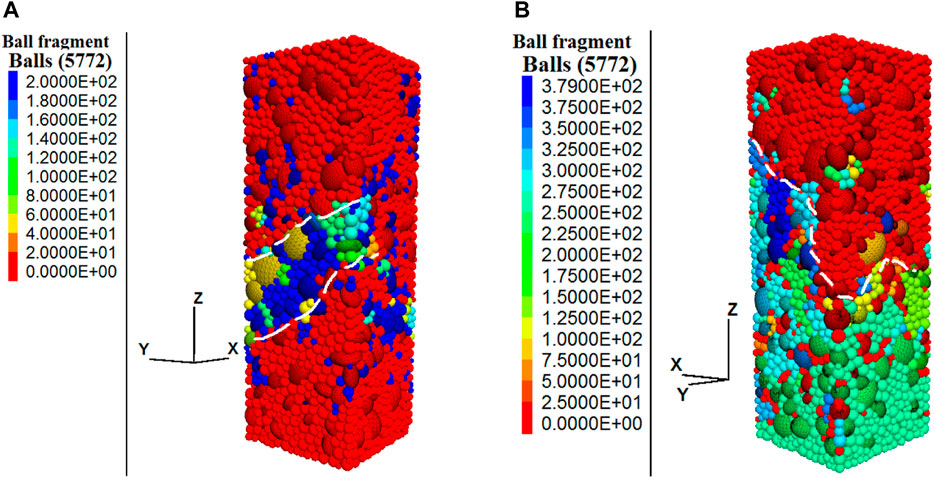
FIGURE 16. Failure states of the single-shaped coarse aggregate concrete at the second stage point (A) Oblate sphere (B) Elliptical.
Figure 15 shows that the oblate spherical aggregate concrete model had 20,519 micro-cracks at the second stage point, while the ellipsoidal aggregate concrete model had 23,668 micro-cracks. Moreover, the oblate spherical aggregate concrete model had 200 fragments, while the ellipsoidal aggregate concrete model had 379 fragments, as shown in Figure 16. The ellipsoidal coarse aggregate concrete exhibited 3,149 more cracks and 179 more fragments than the oblate aggregate concrete. In the pebbled concrete, there could be an inclined main crack at the second stage point, and the intersection angle between the elliptical aggregate concrete crack and the horizontal direction was greater than that between the oblate spherical coarse aggregate concrete crack and the horizontal direction. Therefore, the damage in the ellipsoidal aggregate concrete was more severe regarding the failure state at the second stage point. This difference in injury can be attributed to the larger mortar wrapping area of the ellipsoidal aggregate compared to the oblate aggregate, resulting in the ellipsoidal aggregate concrete having lower rigidity than the oblate aggregate concrete. Consequently, when the concrete strain reached 3 × 10⁻³, the burst-apart phenomenon of the elliptical aggregate concrete became more visible, and more cracks appeared. Based on the findings, ellipsoidal aggregate is more suitable as a coarse aggregate for concrete than oblate aggregate due to its closer alignment with the desired properties for concrete.
Different coarse aggregate volume fractions were considered to investigate the effects of ellipsoid aggregate volume fraction on the mechanical properties of the concrete. Statistics indicate that the volume fraction of aggregate typically ranges from 50% to 70% of the total volume of the concrete (Li, 2012). Thus, the coarse aggregate volume fractions of 50%, 55%, 57%, 60%, 65%, and 70% were simulated under uniaxial compression. The ellipsoid aggregate concrete models with different volume fractions are shown in Figure 17. PFC3D simulations were carried out to simulate the uniaxial compression of the ellipsoid aggregate concrete at various volume fractions, and the corresponding stress–strain curves are shown in Figure 18.
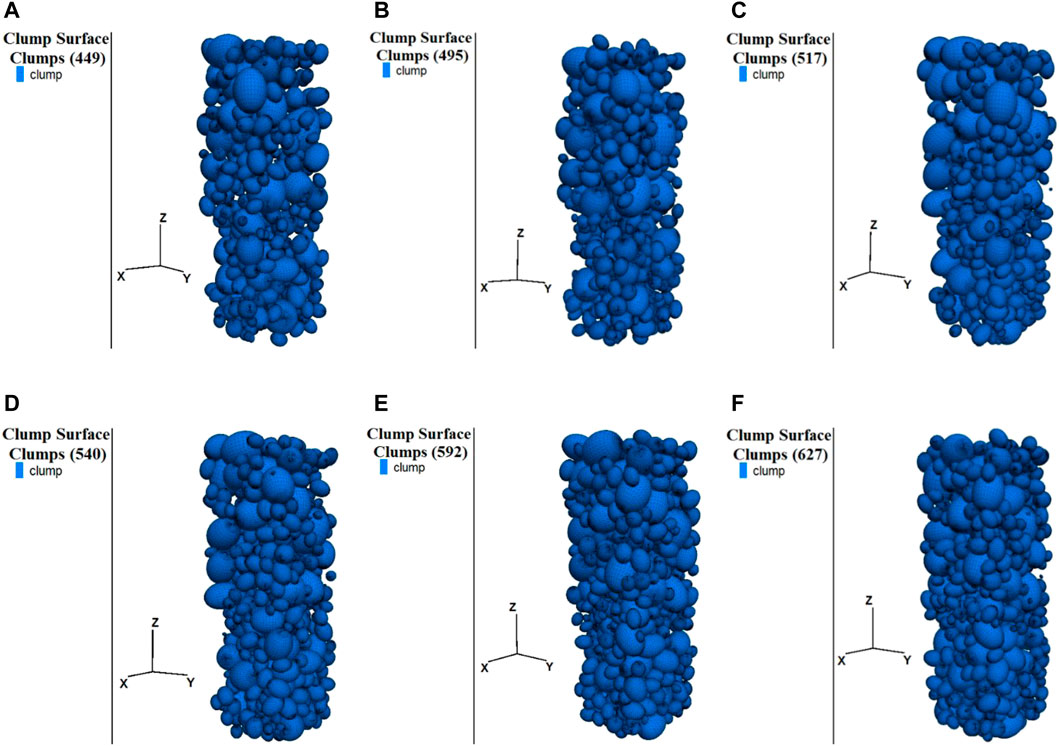
FIGURE 17. Distribution of ellipsoid aggregates at different volume fractions (A) 50% (B) 55% (C) 57% (D) 60% (E) 65% (F) 70%.
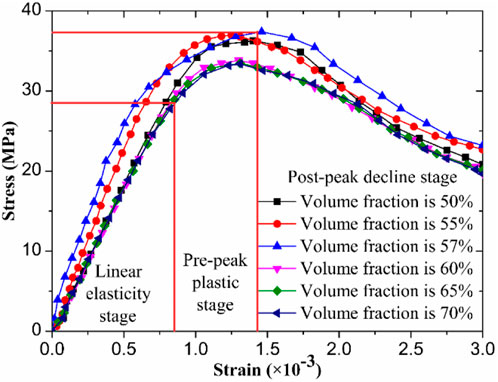
FIGURE 18. Stress–strain curves with different volume fractions of the ellipsoid aggregate.
Figure 18 shows that the stress–strain curves of the ellipsoidal aggregate concrete with different coarse aggregate volume fractions exhibited the same trend during the uniaxial compression process. The concrete with varying aggregate volume fractions exhibited three distinct stages. The first stage was the linear elastic stage. At this stage, the stress–strain curve showed a linear ascending trend, and the concrete stress increased linearly with strain, with deformation being recoverable. The second stage was the pre-peak plastic stage. At this stage, the presence of micro-cracks caused significant stress concentration, influencing the behavior of the specimen. Under constant axial pressure, the growth of micro-cracks continued, causing damage to the weak contact surface of the concrete and stress redistribution in the specimen. Simultaneously, the concrete specimen transitioned from compression deformation to volume expansion. The specimen experienced peak stress, which defined the concrete compressive strength. The third stage was the post-peak decline stage. After reaching the peak stress, the stress gradually decreased as the strain increased, and the concrete specimen began to soften, with cracks developing quickly and propagating to form visible macro-cracks.
Figure 19 shows the peak stress and peak strain of the ellipsoid aggregate at different volume fractions. The peak stress and peak strain of the ellipsoidal aggregate with the volume fractions of 50%, 55%, 60%, 65%, and 70% were significantly lower than the volume fraction of 57%. The decrease in peak stress from 57% to 60% was greater than the increase in peak stress from 50% to 55% and from 55% to 57%. In particular, the peak stress of the concrete with a volume fraction of 57% was 2.9%, 1.1%, 9.5%, 10.5%, and 10.7% greater than that of 50%, 55%, 60%, 65%, and 70%, respectively. Hence, the compressive strength of concrete was the highest, and the mechanical properties were the best when the volume fraction of the ellipsoidal aggregate was 57%. The coarse aggregate is vital in sustaining the concrete skeleton, and increasing the volume fraction can improve its strength. However, if the volume fraction becomes very large, the cement slurry may be insufficient, leading to reduced workability and stability of the concrete (Ninčević et al., 2019).
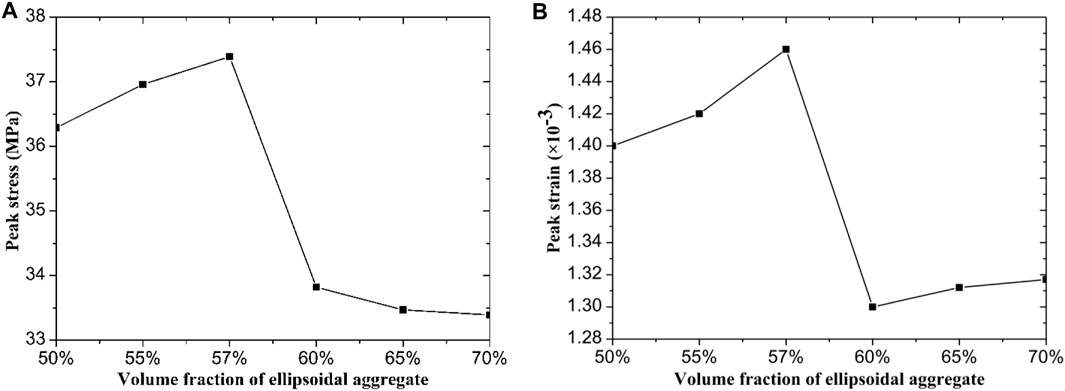
FIGURE 19. Peak stress and peak strain of ellipsoid aggregates (A) Peak stress (B) Peak strain.
The contact force between particles and the number of micro-cracks in the concrete can provide quantitative insights into the failure state of the concrete. The mechanical properties of uniaxial compression with different volume fractions of the ellipsoid aggregate concrete can be examined by analyzing the contact force and crack development in the aggregate particles at the second stage point. These analyses help understand the behavior and performance of concrete under varying conditions of aggregate volume fractions.
The variations of the maximum contact force as opposed to the volume fractions followed a similar trend to the peak stress, as shown in Figure 20. The maximum contact force was the highest when the aggregate volume percent was 57% and the lowest when the volume fraction was 70%. A higher maximum contact force between particles correlated with greater compressive strength of the concrete. Consequently, analyzing the maximum contact force between particles provides valuable insights into the effect of different aggregate volume fractions on the mechanical properties of concrete.
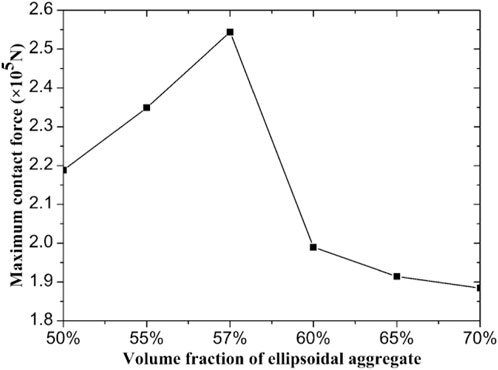
FIGURE 20. Maximum contact force of the ellipsoidal aggregate concrete.
Figure 21 shows that the variation in the number of cracks and peak stress under different volume fractions of the ellipsoidal aggregate essentially followed the same pattern. The number of cracks was the highest when the volume fraction was 57%, and it was the lowest when the volume fraction was 70%. Consequently, the maximum and minimum stress values were attained at the volume fractions of 57% and 70%, respectively. Under the same strain condition, higher concrete strength requires a larger axial pressure to be applied, resulting in the formation of more cracks. Additionally, the number of shear cracks at the same volume fraction was notably greater than the number of tensile cracks. This is attributed to the high shear force between the aggregate particles during the compression of the concrete specimen, leading to an increased number of shear cracks. Therefore, the number of mesocracks in the concrete provides valuable information to study the effect of varying aggregate volume fractions on the mechanical performance of the concrete.
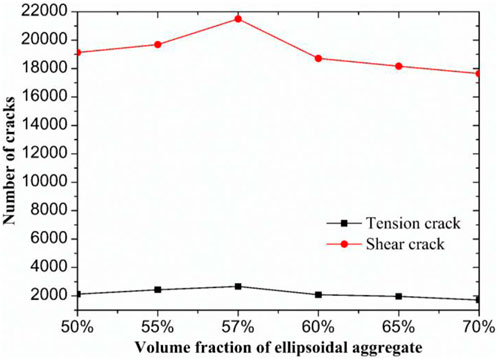
FIGURE 21. Number of cracks under different ellipsoid aggregate volume fractions.
In this paper, the discrete element model of the pebble concrete was developed based on the clump technology of the particle flow DEM, using software PFC3D and CT scan. The mesoscopic parameters between mortars and the contact surface between mortars and aggregate were calibrated by comparing the stress–strain relationship simulated by the model with the experimentally obtained data of the pebble concrete. The key conclusions drawn from this study are as follows:
1) The peak stress of the elliptical aggregate concrete was found to be 2.8 MPa higher than that of the oblate spherical aggregate concrete, and the post-peak decline stage was essentially the same. Moreover, at a specimen strain of 3 × 10⁻³, the elliptical aggregate concrete exhibited 3,149 more cracks and 179 more fragments compared to the oblate spherical aggregate concrete, indicating a higher number of micro-cracks and a more severe failure in the ellipsoid coarse aggregate concrete. Therefore, elliptical aggregates are more suitable as coarse aggregates for concrete than oblate spherical aggregates.
2) When compared to other volume fractions of the ellipsoidal aggregate, the volume fraction of 57% resulted in the highest peak stress and strain in the concrete, as well as the highest contact force and number of cracks. Therefore, it can be concluded that the mechanical properties of concrete were the best when the volume fraction of the ellipsoidal aggregate was 57%.
3) The coarse aggregate plays a significant role in providing support skeleton to concrete, and appropriately increasing the volume fraction of the coarse aggregate can improve concrete strength. However, it is important to avoid an excessively high-volume fraction, as this can lead to insufficient paste, potentially compromising the compressive strength of the concrete. Therefore, the coarse aggregate volume fraction of 57% may be considered the optimal volume fraction for concrete.
4) The discrete element model of the pebble concrete, as established in this paper, has provided a rational prediction for assessing the effect of coarse aggregate morphology. This method enables accurate simulation of the microstructure of concrete and holds significant potential for guiding the prediction of the crack propagation behavior during concrete failure at the mesoscale in future studies.
The raw data supporting the conclusion of this article will be made available by the authors, without undue reservation.
WZ: data curation and writing—original draft preparation. ZS: conceptualization and methodology. XD: visualization and investigation. LH: writing—reviewing and editing. All authors contributed to the article and approved the submitted version.
This study was financially supported by the National Natural Science Foundation of China (grant no. 51879217).
The authors declare that the research was conducted in the absence of any commercial or financial relationships that could be construed as a potential conflict of interest.
All claims expressed in this article are solely those of the authors and do not necessarily represent those of their affiliated organizations, or those of the publisher, the editors, and the reviewers. Any product that may be evaluated in this article, or claim that may be made by its manufacturer, is not guaranteed or endorsed by the publisher.
Adhikary, S., Ashish, D., Sharma, H., Patel, J., Rudzionis, Z., Al-Ajamee, M., et al. (2022). Lightweight self-compacting concrete: A review. Resour. Conserv. Recycl. Adv. 15, 200107. doi:10.1016/j.rcradv.2022.200107
Aïssoun, B., Hwang, S., and Khayat, K. (2016). Influence of aggregate characteristics on workability of superworkable concrete. Mater. Struct. 49 (1), 597–609. doi:10.1617/s11527-015-0522-9
Chinese Standard (2016). Standard for test method of performance on ordinary fresh concrete. GB/T 50080-2016. Beijing, China: Chinese Standard Press.
Chinese Standard (2006). Test specification for hydraulic concrete. SL 352-2006. Beijing, China: Chinese Standard Press.
Dolatabad, Y., Kamgar, R., and Tazangi, M. (2020). Effects of perlite, leca, and scoria as lightweight aggregates on properties of fresh and hard self-compacting concretes. J. Adv. Concr. Technol. 18 (10), 633–647. doi:10.3151/jact.18.633
Du, X., Li, Y., Si, Z., Huang, L., and Chen, X. (2022a). Effects of basalt fiber and polyvinyl alcohol fiber on the properties of recycled aggregate concrete and optimization of fiber contents. Constr. Build. Mater. 340, 127646. doi:10.1016/j.conbuildmat.2022.127646
Du, X., Li, Y., Si, Z., Huang, L., and Wen, L. (2022b). Damage process of roller-compacted concrete based on combined action of freeze–thaw and triaxial compression. J. Mater. Civ. Eng. 34 (9), 04022198. doi:10.1061/(ASCE)MT.1943-5533.0004332
Du, X., Si, Z., Li, Y., Huang, L., Si, Z., and Wen, L. (2023). Dynamic compressive behavior of freeze–thaw damaged roller-compacted concrete and establishment of constitutive model. Constr. Build. Mater. 365, 130095. doi:10.1016/j.conbuildmat.2022.130095
Guo, J., Xu, G., Jing, H., and Kuang, T. (2013). Fast determination of meso-level mechanical parameters of PFC models. Int. J. Min. Sci. Technol. 23, 157–162. doi:10.1016/j.ijmst.2013.03.007
He, C., and Liu, C. (2023). Fractal dimensions of a porous concrete and its effect on the concrete’s strength. Facta Univ. Ser. Mech. Eng. 21 (01), 137–150. doi:10.22190/FUME221215005H
Huang, Y., He, X., Sun, H., Sun, Y., and Wang, Q. (2018). Effects of coral, recycled and natural coarse aggregates on the mechanical properties of concrete. Constr. Build. Mater. 192, 330–347. doi:10.1016/j.conbuildmat.2018.10.111
Itasca Consulting Group (2018). Particle flow code in three dimensions (PFC3D). Minneapolis, Minnesota, United States: Itasca Consulting Group.
Jiang, M., Yang, Z., Barreto, D., and Xie, Y. (2018). The influence of particle-size distribution on critical state behavior of spherical and non-spherical particle assemblies. Granul. Matter 20 (4), 80–15. doi:10.1007/s10035-018-0850-x
Kang, Z., Tang, X., Qin, C., and Zhou, X. (2013). End effect of concrete by meso-scale discrete element modeling. J. Harbin Inst. Technol. 45 (12), 94–98. doi:10.11918/j.issn.0367-6234.2013.12.017
Khaleel, O., Al-Mishhadani, S., and Razak, H. (2011). The effect of coarse aggregate on fresh and hardened properties of self-compacting concrete (SCC). Procedia Eng. 14, 805–813. doi:10.1016/j.proeng.2011.07.102
Li, C. (2012). Effect of coarse aggregate size and gradation on concrete performance. Ready-Mixed Concr. 6, 67–68.
Liu, H., and Han, L. (2017). Numerical simulation of dynamic properties of concrete on the basis of random aggregate model. Chin. J. Appl. Mech. 34 (01), 162–168. doi:10.11776/cjam.34.01.D056
Nicot, F., Xiong, H., Wautier, A., Lerbet, J., and Darve, F. (2017). Force chain collapse as grain column buckling in granular materials. Granul. Matter 19 (2), 18–12. doi:10.1007/s10035-017-0702-0
Ninčević, K., Boumakis, I., Marcon, M., and Wan-Wendner, R. (2019). Aggregate effect on concrete cone capacity. Eng. Struct. 191, 358–369. doi:10.1016/j.engstruct.2019.04.028
Nitka, M., and Tejchman, J. (2020). Meso-mechanical modelling of damage in concrete using discrete element method with porous ITZs of defined width around aggregates. Eng. Fract. Mech. 231, 107029. doi:10.1016/j.engfracmech.2020.107029
Pacheco, J., Brito, J., Chastre, C., and Evangelista, L. (2019). Experimental investigation on the variability of the main mechanical properties of concrete produced with coarse recycled concrete aggregates. Constr. Build. Mater. 201, 110–120. doi:10.1016/j.conbuildmat.2018.12.200
Potyondy, D., and Cundall, P. (2004). A bonded-particle model for rock. Int. J. Rock Mech. Min. Sci. 41, 1329–1364. doi:10.1016/j.ijrmms.2004.09.011
Prakash, P., Pulatsu, B., Lourenco, P., Azenha, M., and Pereira, J. M. (2020). A meso-scale discrete element method framework to simulate thermo-mechanical failure of concrete subjected to elevated temperatures. Eng. Fract. Mech. 239, 107269. doi:10.1016/j.engfracmech.2020.107269
Remond, S., and Pizette, P. (2014). A DEM hard-core soft-shell model for the simulation of concrete flow. Cem. Concr. Res. 58, 169–178. doi:10.1016/j.cemconres.2014.01.022
Shane, J., Mason, T., Jennings, H., Garboczi, E., and Bentz, D. (2000). Effect of the interfacial transition zone on the conductivity of Portland cement mortars. J. Am. Ceram. Soc. 83 (5), 1137–1144. doi:10.1111/j.11512916.2000.tb01344.x
Shen, W., Zhao, T., Dai, F., Jiang, M., and Zhou, G. G. (2019). DEM analyses of rock block shape effect on the response of rockfall impact against a soil buffering layer. Eng. Geol. 249, 60–70. doi:10.1016/j.enggeo.2018.12.011
Si, Z., Du, X., Huang, L., and Li, Y. (2020). Meso-scale failure of freezing–thawing damage of concrete under uniaxial compression. Appl. Sci. 10, 1252. doi:10.3390/app10041252
Tran, V., Donzé, F.-V., and Marin, P. (2011). A discrete element model of concrete under high triaxial loading. Cem. Concr. Compos. 33, 936–948. doi:10.1016/j.cemconcomp.2011.01.003
Wang, J., Xu, B., and Chen, H. (2019). Numerical simulation of the tensile behavior of concrete using multi-scale homogenization approach. Chin. J. Appl. Mech. 36 (03), 538–546+755. doi:10.11776/cjam.36.03.B024
Wei, D., Hurley, R., Poh, L., Dias-da-Costa, D., and Gan, Y. (2020). The role of particle morphology on concrete fracture behaviour: A mesoscale modelling approach. Cem. Concr. Res. 134, 106096. doi:10.1016/j.cemconres.2020.106096
Wu, J., Jia, Z., and Zhou, X. (2023). Discrete element analysis of the effect of aggregate morphology on the flowability of self-compacting concrete. Case Stud. Constr. Mater. 18, e02010. doi:10.1016/j.cscm.2023.e02010
Xie, C., Yuan, L., Zhao, M., and Jia, Y. (2020). Study on failure mechanism of porous concrete based on acoustic emission and discrete element method. Constr. Build. Mater. 235, 117409. doi:10.1016/j.conbuildmat.2019.117409
Zhang, J., Xu, P., and Gao, X. (2021). Multi-scale particles optimization for some rheological properties of eco-SCC: modelling and experimental study. Constr. Build. Mater. 308, 125151. doi:10.1016/j.conbuildmat.2021.125151
Zhang, S., Zheng, S., Wang, E., and Dai, H. (2023). Grey model study on strength and pore structure of self-compacting concrete with different aggregates based on NMR. J. Build. Eng. 64, 105560. doi:10.1016/j.jobe.2022.105560
Zhou, X., Xie, Y., Long, G., Zeng, X., Li, J., Yao, L., et al. (2021). DEM analysis of the effect of interface transition zone on dynamic splitting tensile behavior of high-strength concrete based on multi-phase model. Cem. Concr. Res. 149, 106577. doi:10.1016/j.cemconres.2021.106577
Keywords: concrete, aggregate morphology, volume fraction, stress–strain curve, mesoscale failure
Citation: Zhao W, Si Z, Du X and Huang L (2023) Effects of the particle morphology and volume fraction of coarse aggregate on the mechanical properties of concrete. Front. Mater. 10:1201961. doi: 10.3389/fmats.2023.1201961
Received: 07 April 2023; Accepted: 22 August 2023;
Published: 08 September 2023.
Edited by:
Kejin Wang, Iowa State University, United StatesReviewed by:
Chun-Hui He, Xi’an University of Architecture and Technology, ChinaCopyright © 2023 Zhao, Si, Du and Huang. This is an open-access article distributed under the terms of the Creative Commons Attribution License (CC BY). The use, distribution or reproduction in other forums is permitted, provided the original author(s) and the copyright owner(s) are credited and that the original publication in this journal is cited, in accordance with accepted academic practice. No use, distribution or reproduction is permitted which does not comply with these terms.
*Correspondence: Zheng Si, c2l6aGVuZ0B4YXV0LmVkdS5jbg==
Disclaimer: All claims expressed in this article are solely those of the authors and do not necessarily represent those of their affiliated organizations, or those of the publisher, the editors and the reviewers. Any product that may be evaluated in this article or claim that may be made by its manufacturer is not guaranteed or endorsed by the publisher.
Research integrity at Frontiers
Learn more about the work of our research integrity team to safeguard the quality of each article we publish.