 Arshad Mehmood1*
 Kareem Akhtar1Sahar Noor2
 M. Zeeshan Zahir1
 Barkat Ullah3
 Razaullah Khan4Bashir Salah5
 Syed Sajid Ullah6*
- 1Department of Mechanical Engineering, University of Engineering and Technology, Peshawar, Pakistan
- 2Department of Industrial Engineering, University of Engineering and Technology, Peshawar, Pakistan
- 3Mechanical Engineering Department, COMSATS University, Wah Cantt, Pakistan
- 4Department of Mechanical Engineering, University of Engineering and Applied Sciences, Swat, Pakistan
- 5 Industrial Engineering Department, College of Engineering, King Saud University, Riyadh, Saudi Arabia
- 6Department of Information and Communication Technology, University of Agder (UiA), Grimstad, Norway
The purpose of this study is to examine the impact of various process parameters, such as cold work, aging temperature, and aging time, on the yield strength, ultimate tensile strength (UTS), and elongation of AA6061 tubes. The experimental plan is carried out, and the data is analyzed using Design Expert software. Main effects plots and interaction plots are generated to visually examine the effects of individual factors and the interaction between two factors on the output response variables. ANOVA analysis is conducted to assess the statistical significance of the model and individual model coefficients. The results reveal that all input factors had a significant impact on yield, whereas cold work and temperature and their interaction are significant for UTS. However, the model is not significant for elongation. The most notable finding is that the aging temperature’s effect is significant than the other two factors. These study findings can inform future experiments or process optimization efforts by considering the combined impact of these factors and their interactions. The study also found that the optimal temperature range is between 155°C to 170°C, along with a recommended cold work percentage of 10% or more and preferred time of above 10 h up to overage time. The model achieved an overall accuracy rate of over 90%, indicating its ability to predict the response variable with a high degree of precision.
1 Introduction
Cold working is a process that involves deforming a material at a room temperature. This process results in increased strength, hardness, and resistance to wear and fatigue, but it may also decrease the material’s ductility and toughness. To quantify the degree of cold working, the reduction in cross-sectional area expressed as a percentage is used. In contrast, age hardening utilizes a series of heat treatments to encourage the precipitation of small particles in the material’s microstructure, which hinder dislocation motion, making plastic deformation more difficult. Age hardening enhances the material’s strength and hardness while preserving its ductility and toughness. The effects of cold working and age hardening on mechanical properties are complex and dependent on various factors, including the material type, degree of cold working, temperature range and time of age hardening, and cooling rate after the heat treatment. Both cold working and age hardening can increase yield strength, tensile strength, and hardness, but this comes at the cost of reduced ductility and toughness. The extent of improvement is contingent on specific treatment conditions. Finding the optimal cold working and age hardening conditions for a material depends on the application’s specific requirements and desired balance between strength, hardness, ductility, and toughness. Achieving a careful balance of these properties is critical to ensure that the material can withstand the anticipated loading and environmental conditions without premature failure.
Design methods can greatly aid the engineering design process in developing new products or improving existing ones. Various techniques exist in materials processing to design and optimize processing parameters, including the Taguchi Method (Palani and Murugan, 2008; Tzeng et al., 2009), Response Surface Methodology (RSM) (Choudhury and El-Baradie, 1997; Noordin et al., 2004), Materials Informatics (Risanti et al., 2009; Reilly et al., 2013) and Design of Experiments (DOE) (Montgomery, 1997). The Taguchi method is a statistical approach to design a robust product or process that is insensitive to variation in the input factors, while achieving desired output specifications. This method is widely used in industries such as manufacturing, engineering, and design to improve product quality and reduce costs. Its benefits include improved product reliability, reduced development time, and reduced costs associated with product failures and warranty claims (Yang and Tarng, 1998; Venugopal et al., 2012). Response Surface Methodology (RSM) is a statistical technique used to model and analyze the relationship between a response variable and multiple input variables in order to optimize the response. The method involves building mathematical models of the response surface and then using optimization techniques to identify the optimal input settings that maximize or minimize the response (Choudhury and El-Baradie, 1997). Materials informatics involves using data-driven approaches, such as machine learning algorithms, to predict the properties of materials based on their composition, structure, and processing history. This can be used to design new materials or optimize the processing of existing materials (Tamura et al., 2020). Process modeling involves creating a mathematical model of the processing equipment and conditions, which can be used to optimize the processing parameters to achieve desired outcomes. It can be used to optimize the processing of materials and to predict the behavior of materials under different processing conditions (Risanti et al., 2009; Reilly et al., 2013). Design of Experiments (DOE) is a statistical approach used to systematically vary the processing parameters of a material and measure the resulting properties. It is a powerful method for determining the optimal combination of input factors that can produce the desired output response. By varying the processing parameters and measuring the resulting properties, the optimal combination of parameters can be identified to achieve the desired outcome (Kadaganchi et al., 2015). The same method is presented herein to vary the input parameters of the aluminium alloy 6061. In this study, the effect of cold work, along with aging temperature and time has been taken into consideration to be investigated in knowing the mechanical properties of AA6061 such as maximum yield strength, maximum UTS and minimum required elongation.
Researchers have utilized various design techniques to investigate and improve the mechanical properties of different materials. Tzeng et al. (Tzeng et al., 2009) found that the depth of cut has the largest effect on the overall surface roughness. On the contrary, changes in cutting speed have the largest impact on the highest peak-to-valley height and the roundness of the machined surface. Based on the ANOVA results, they found that the depth of cut is the most significant controlled factor for achieving the desired surface finish and roundness in turning operations. Noordin et al. (2004) studied the performance of a tool made of multilayer tungsten carbide when turning AISI 1045 steel using RSM. The input variables considered in the analysis include cutting speed, feed rate, and the side cutting edge angle (SCEA) of the cutting edge. The response variable of interest was the tangential force and surface roughness. They observed that changes in the feed rate will have the greatest impact on these performance indicators. They found that in the case of surface roughness, both the side cutting edge angle and the interaction of feed and SCEA are significant factors that contribute to the performance indicator. In contrast, for tangential force, it appears that the SCEA, the interaction of feed and SCEA, and the cutting speed are all factors that contribute to the performance indicator.
Kadaganchi et al. (2015) introduced a mathematical model to forecast the yield strength, tensile strength, and ductility of friction stir welds of AA 2014-T6. They focused on the most significant process parameters, including spindle speed, welding speed, tilt angle, and tool pin profile, in the context of friction stir welding of aluminium alloys. They observed that the use of a hexagonal tool pin profile in the fabrication of welds resulted in the highest tensile strength and elongation, indicating that this tool profile produces the strongest and most ductile welds. On the other hand, the welds made with a conical tool pin profile have the lowest tensile strength and elongation, suggesting that this tool profile results in weaker and less ductile welds. Bui et al. (2011) performed experiments to investigate how reducing the cross-sectional area of variable thickness of aluminium tubes affects their microstructure and mechanical properties. Two distinct position-controlled mandrel techniques were employed to draw the tubes, and their mechanical properties were assessed in relation to the cross-sectional reduction. The experiments involved cold drawing tubes with different outer diameters and cross-sectional reductions ranging from 11% to 41%. To determine the mechanical properties at specific locations, specimens were extracted from the tubes parallel to their axes, and tensile tests were performed on them. They have observed, an increase in cross-sectional reduction resulted in higher microhardness, yield strength, and ultimate tensile strength of the deformed samples. However, this was accompanied by a decrease in corresponding elongation. Additionally, the anisotropy in microstructure and mechanical properties became more significant with increasing cross-sectional reduction. It was found that the mechanical properties of the drawn tubes varied depending on the mandrel shapes used and the initial tube outer diameter.
Mirzakhani and Mansourinejad (Mirzakhani and Mansourinejad, 2011) investigated the tensile properties of AA6061 alloy under varying conditions of precipitation hardening and cold working. They found that increasing the aging time and temperature resulted in higher tensile strength, but a lower elongation. Additionally, an increase in reduction in area led to decreased ductility and increased tensile strength for two distinct sample types: those that underwent a single aging process at 180°C for 4 h and those that were solutionized and subsequently cold-rolled. Oritz et al. (2007) studied the strain limits of aluminium alloys 6061, 2024, and 7075 subjected to plastic strain using a tensile testing machine. The strain limit was expressed as the UTS, which varies depending on the temper and the amount of plastic strain applied. They applied heat treatment to improve the mechanical properties of these alloys, particularly their strength and ductility. They observed that forming of aluminium alloys should be done in low-strength, high-ductility tempers to minimize the risk of cracking and increase the formability of the material. They also observed that hardened tempers such as T6 and T8 of aluminium alloys are less ductile and more brittle, which means they have a lower tolerance for plastic deformation. As a result, only small amounts of strain, typically in the range of 2%–3%, should be applied to these tempers before they are at risk of cracking or other forms of failure.
Masounave et al. (1997), observed that the three-way interactions between the variables feed rate, cutting speed, depth of cut, tool nose radius, and tool length have significant effects on the surface roughness. It has been found that the optimal surface roughness can be achieved by utilizing a low feed rate, a large tool nose radius, and a high cutting speed in combination. It has been found that when machining mild carbon steel at certain feed rates, tool nose radius, and cutting speeds, the formation of a built-up edge can negatively impact surface roughness. Liang et al. (2021) studied how the heat from welding affects the properties of an Inconel 625 alloy. They observed that the grains became more rounded, and carbides became more visible. They also found that the metal became weaker when it was exposed to high temperatures. They discovered that when the metal is heated, it changes in ways that make it harder for it to resist being bent or deformed. Zhang et al. (2022a) conducted isothermal compression tests to understand how to control the way grains form in metals. They found that if they heat the metal to a certain temperature and then press it at a certain speed, they can get the grains to be the right size and shape. They studied what happens to the metal at different temperatures and found that if they heat it too much, the grains become too big. They also studied what happens to the metal when it is being pressed and found that two different processes are happening at the same time to control the grain size. One process involves the edges of the grains bulging out, and the other involves the grains rotating. Zhang et al. (2023) conducted experiments to test the corrosion resistance of the AA7A04 when cut in different ways. They treated some samples of the metal at different temperatures and then cut them at high speeds using different cutting techniques. They measured how well the metal resisted corrosion in each case by looking at various factors, such as the size of capacitance arc radius and the amount of corrosion products that formed. They found that certain combinations of cutting speed, depth, and feed rate made the metal more resistant to corrosion. They also noticed that surface scratches made the metal more likely to corrode, while other types of damage didn't have as much of an impact. They identified a chemical called Al(OH)3 insolubles as being the main element that caused the metal to corrode. Finally, they found that the metal treated at a higher temperature was more resistant to corrosion when cut using the same parameters.
Zhang et al. (2022b) used heat to break down Ni-glycolate@RGO complexes, which resulted in the creation of Ni-decorated reduced graphene oxide (Ni-RGO) nanosheets. They discovered that the Ni particles were evenly distributed on both sides of the RGO nanosheets. They also found that when more Ni-RGO was added, the thickness of the interfacial intermetallic compounds (IMCs) decreased, and the grain size in the xNi-RGO/SAC305 composite solders became much smaller. They found that adding small amounts of Ni-RGO nanosheets (0.03 wt%) significantly improved the bonding strength and solderability of the solder joint. Djavanroodi et al. (2012) conducted a study on commercial pure aluminum that underwent up to 8 passes of the Equal Channel Angular Pressing (ECAP) process. They examined how the strain distribution behaved in the ECAPed material by testing four different die channel angles. They used two methods to measure strain homogeneity—inhomogeneity index (Ci) and standard deviation (S.D.). The study revealed that Ci was not the best way to measure uniformity of the strain distribution. The researchers suggested that designing the ECAP die geometry to achieve optimal strain distribution homogeneity is more important than achieving the optimal effective strain magnitude. Ebrahimi et al. (2019) used computer models to investigate how different factors, such as angles, friction, and speed, affect the deformation of aluminum during pressing. They found that the angle of the die channel had the greatest impact on both the strain and the force required, while friction had a smaller effect on strain but still affected the required force. The speed of the press didn't appear to have a significant effect. Based on their findings, the researchers recommend using a die with a steep channel angle and a large corner angle to achieve the desired strain behavior, and minimizing friction to reduce the required force without affecting the strain behavior too much.
Akbarpour et al. (2019) investigated how the microstructure of copper powder was affected by the duration of milling. They observed that longer milling times resulted in smaller grain size and increased lattice strain, leading to greater powder hardness. However, this also caused the powder to have lower density since it didn’t pack together as tightly. Yamada et al. (2000), investigated the two-step aging behavior of Al-Mg-Si alloys. The investigation has involved several methods such as hardness and electrical resistivity measurements, adiabatic calorimetry, and transmission electron microscopy. They observed that the quenching conditions, especially step-quenching and first-aging, have a significant effect on the peak hardness of two-step aged specimens. The impact of different thermal processing parameters on both physical and mechanical properties of 7075 T6 aluminium alloy was studied by Clark Jr et al. (2005). This involved varying the solution treatment temperatures, quenching media, and artificial aging conditions. They found a significant relationship between the tensile strength and hardness which suggests that changes in the microstructure that affect the hardness also affect the tensile strength.
Optimizing the properties of aluminium alloys is crucial to enhance their performance in various applications. The mechanical properties, such as yield strength, ultimate tensile strength, and elongation, play a critical role in determining the suitability of aluminium alloys for different purposes. Hence, cold working and age hardening techniques are used to optimize these mechanical properties and improve the overall performance of the alloy. The present study investigates the effects of input factors on the output response variable, including yield, ultimate tensile strength, and elongation. The objective of this research is to establish a correlation between the input parameters of aging temperature, time, and cold work and the output response variables of yield, ultimate tensile strength (UTS), and elongation. The test results are summarized using ANOVA tables. The key finding is that temperature is the most significant effects on yield and UTS but also there is combine effects of input factors on mechanical properties.
2 Manufacturing process flow
Figure 1 shows the conceptual diagram of aluminium tube manufacturing. The production process begins with melting and casting of aluminum alloys in a furnace. The resulting molten metal is then poured into a mold to create ingots and billets. The extrusion process is utilized to form desired shape from the ingots. The required shape formed from extrusion are then subjected to annealing to enhance their workability and decrease internal stresses. During annealing, the metal is heated to a specific temperature and then cooled at a gradual pace, resulting in an increase in the metal’s ductility and toughness.
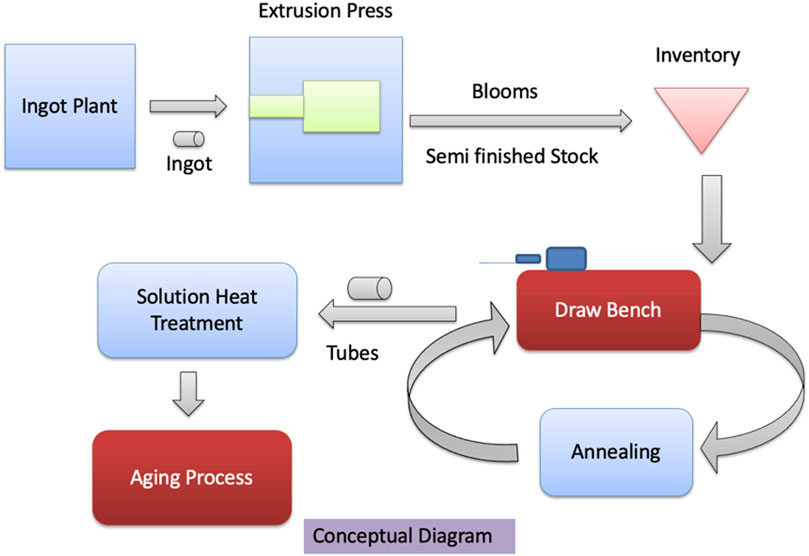
FIGURE 1. Conceptual diagram of Al. Tube Manufacturing: Process Flow.
Once the annealing process is complete on the aluminium alloy undergoes additional processing of cold working using a draw bench. This process enhances the metal strength and the required surface finish and dimension. The final step in aluminium alloy production is quenching and aging. Quenching is the rapid cooling of the alloy to room temperature. The alloy is then aged by heating it to a specific temperature for a certain duration. This process enhances the metal’s strength, toughness, and corrosion resistance. These processes along with the corresponding process parameters values of the input factors, is illustrated in Figure 2. To enhance the properties of AA6061, designed experiments prove to be a powerful technique. The selected process parameters include cold work (10% and 30%). Subsequently, the AA6061 tubes were quenched at 535°C, and age hardening was conducted for 10 and 18 h at temperatures ranging from 160°C to 190°C. Afterward, samples of the alloy were fabricated using an ASTM E8 2004 machine, and tensile testing was performed utilizing an ASTM B557 technique. Finally, the results were subjected to statistical analysis using Design Expert software.
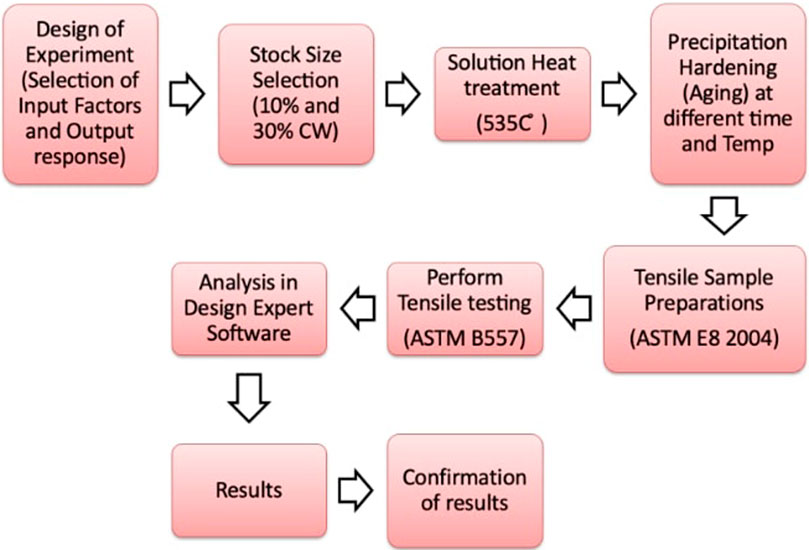
FIGURE 2. Steps in experimentations.
2.1 Test for significance of the regression model
In the analysis of variance (ANOVA) procedure for a design of experiments (DOE), the F-ratio is calculated as the ratio of the mean square regression (MSR) to the mean square error (MSE). The MSR represents the variance explained by the model, while the MSE represents the unexplained variation, or error, in the data. The F-ratio is used to test the null hypothesis that the model has no effect on the response variable against the alternative hypothesis that the model does have an effect. If the F-ratio is large enough, it indicates that the MSR is significantly larger than the MSE, and the null hypothesis can be rejected at the chosen significance level (alpha). This means that the model is significant and has a significant effect on the response variable. A significant model is desirable because it indicates that the factors included in the model have a significant impact on the response variable, and can be used to optimize the process or system being studied.
2.2 Testing the significance of individual model coefficients
After conducting ANOVA and establishing the model’s significance, the next step is usually to optimize the model by deleting the insignificant coefficients. The calculation of the p-value, which is the probability value, is an important step in this process. The p-value is an indication of the degree of evidence against the null hypothesis, and is usually used to determine whether a given factor or coefficient is significant or not. In general, if the p-value is less than the chosen significance level (
2.3 Test for fitting the model
It is necessary to verify whether the model accurately characterizes the experimental data. Examining the coefficient of determination,
3 Experimental details
3.1 Materials used for workpieces
The performance tests were conducted on AA6061 Tubes and its compositions are shown in Table 1. The initial mechanical properties of the test specimen are shown in Table 2.
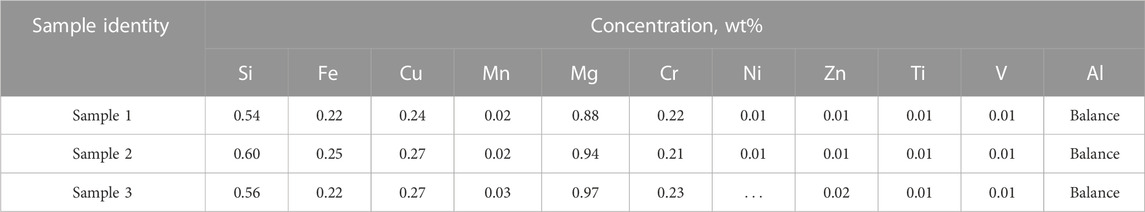
TABLE 1. Composition of workpiece material.
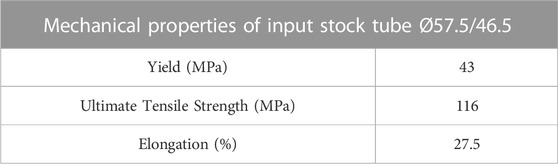
TABLE 2. Mechanical properties of workpiece material.
3.2 Plan for conducting experiments
In this study, three input factors and three output responses as shown in Figure 3 are being studied. The low and high levels of each factor are specified in Table 3. The test piece mechanical properties were studied with a DOE process whereby
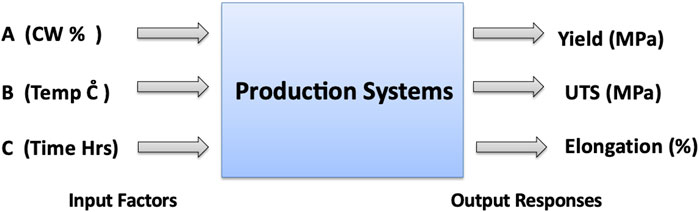
FIGURE 3. Input factors and output responses.
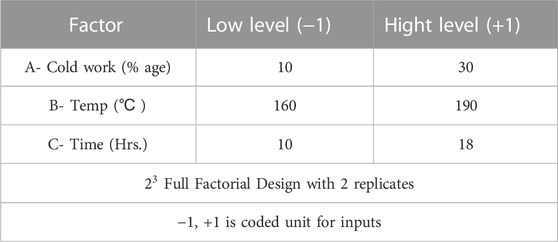
TABLE 3. Factors and levels for response of workpiece.

TABLE 4. Completed design layout.
3.1 Experimental procedures
As described in the previous section, the mechanical properties were evaluated through 16 trials, where the response variables measured were the yield strength, ultimate tensile strength, and elongation. The drawing process was performed by a 10 KN draw bench with a fixed plug at the end of the bench and the samples tested are tabulated in Table 5. This drawing process is highly effective method for producing high-quality, precisely dimensioned metal products with improved mechanical properties. The use of the draw bench machine with a fixed plug allows for a more controlled and consistent process, resulting in higher quality finished products.

TABLE 5. Aluminium alloy 6061 tube sizes after CW.
Aging and quenching processes were performed in a box type electric furnace of size (600 × 300 × 300 mm) and all experimental tubes were quenched at
4 Results and discussion
The results from the cold working and aging trials performed as per the experimental plan are shown in Table 6. The “Std Order” column refers to the standard order of the experimental runs. The “Run order” column indicates the sequence of the experimental runs performed. The experimental data for yield strength, UTS, and elongation are presented in the last three columns of the Table 6. The data obtained from the experiments were subsequently analyzed using the Design Expert software (Montgomery, 1997).
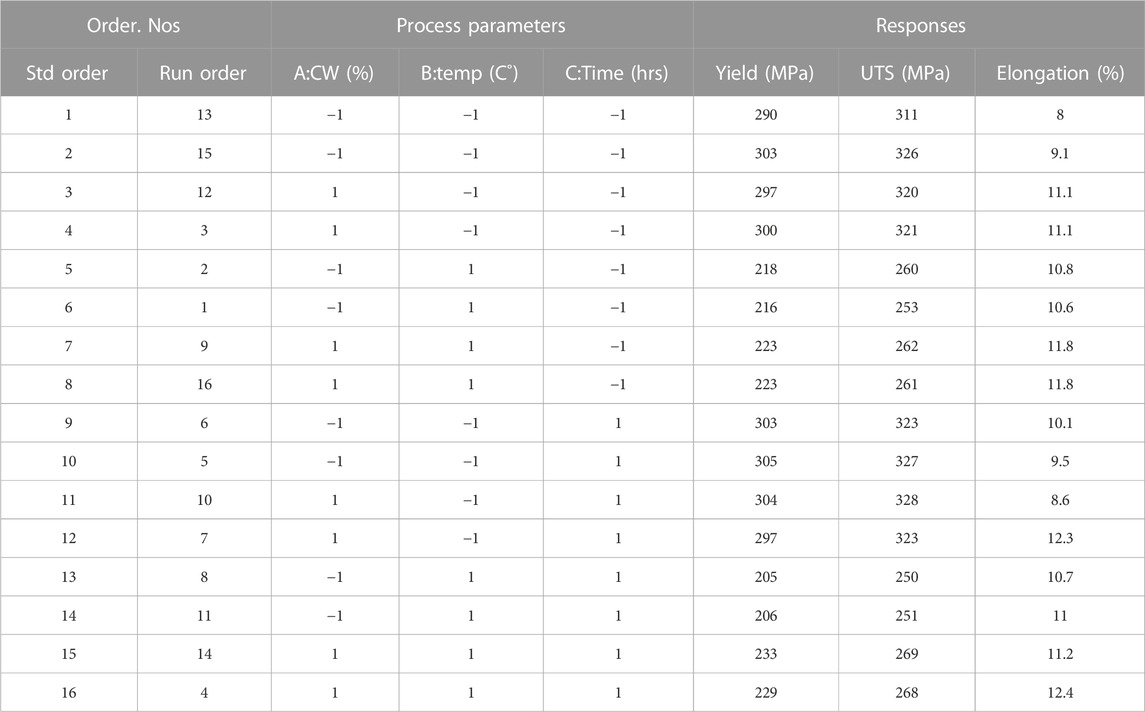
TABLE 6. Results from the experiment.
4.1 Main effects and interaction plots
To visually explore the effects of individual factors and the effect of the relationship between two factors on the response variables, we plot the main effects plots and the interaction plots (Mahadevan et al., 2006) as shown in Figures 4, 5.
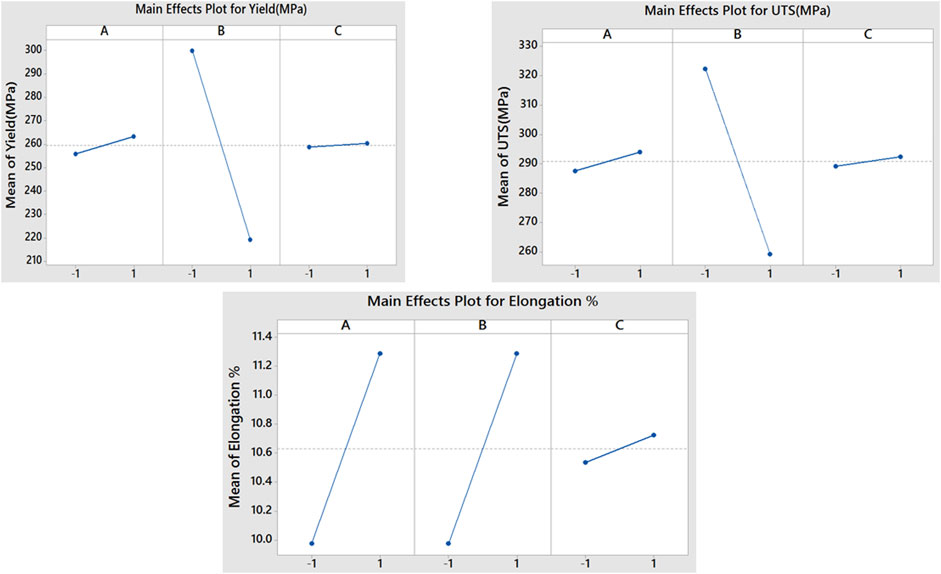
FIGURE 4. Main effect plots for (A) Yield, (B) UTS and (C) Elongation.
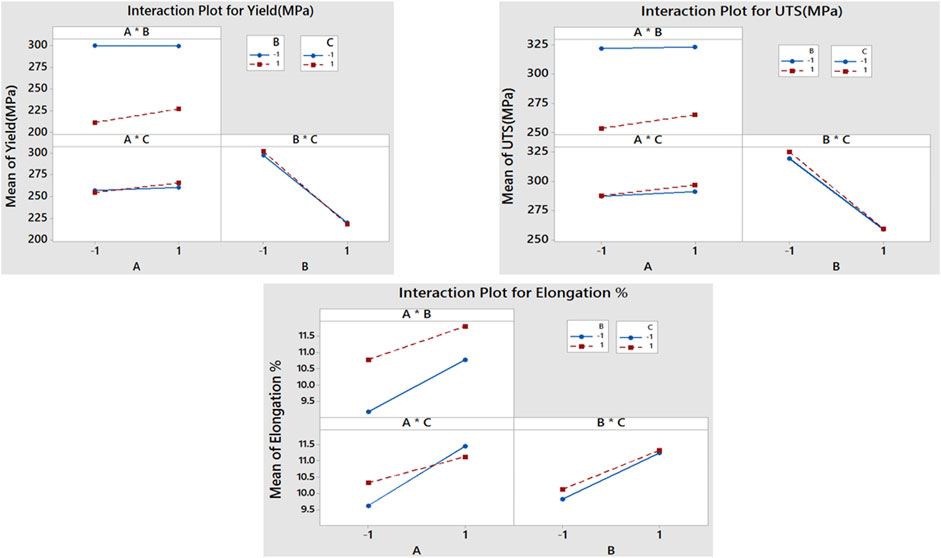
FIGURE 5. The interaction plots for (A) Yield. (B) UTS and (C) Elongation.
The main effects plot shows the effect of each individual factor on the response variables, holding all other factors constant at their average levels (Noordin et al., 2004). We can see from Figure 4 that temperature has the most substantial influence on yield and UTS, and its effect is negative (Mahadevan et al., 2006; Mirzakhani and Mansourinejad, 2011). However, for elongation, the temperature effect is positive. Consequently, a decrease in temperature leads to a higher yield and UTS, while elongation is enhanced despite the negative correlation with temperature.
The interaction plots of the input factors on the response variables have been plotted in Figure 5. This plot indicates a noticeable interaction between the input factors temperature and time concerning yield and UTS. As depicted, when both these input factors (B*C) have lower values, the yield and UTS increases. However, we cannot identify any distinct interaction between the input factors regarding elongation.
4.2 ANOVA analysis
It was previously mentioned to assess the statistical significance of the model and individual model coefficients, test need to be performed. An ANOVA table is a common way to summarize the results of these tests (Noordin et al., 2004). The table typically includes the sources of variation, degrees of freedom, sum of squares, mean squares, F-values, and p-values. The F-values and p-values in the ANOVA table can be used to test for the significance of the model and individual model coefficients. A significant F-value indicates that the model is a good fit to the data, while a significant p-value for an individual coefficient suggests that the corresponding input factor has a significant effect on the response variable (Montgomery, 1997; Noordin et al., 2004).
Table 7 shows the ANOVA table for response surface model for yield. The value of “Prob. > F″ in Table 7 indicates whether the model is significant or not. If the value is less than 0.05, then the model is considered significant, and the terms in the model have a significant effect on the response variable (Montgomery, 1997; Noordin et al., 2004). Similarly, the main effect of A-Cold Work (A-CW) and B-Temperature are significant model terms. Additionally, the two-level interaction between Cold Work and Temperature, as well as the interaction between Cold Work, Temperature, and Time, are also significant model terms. Other model terms can be regarded as insignificant. To enhance yield, we must take into account temperature and Cold Work, along with the interaction between temperature and Cold Work, along with the interaction of all three input factors.
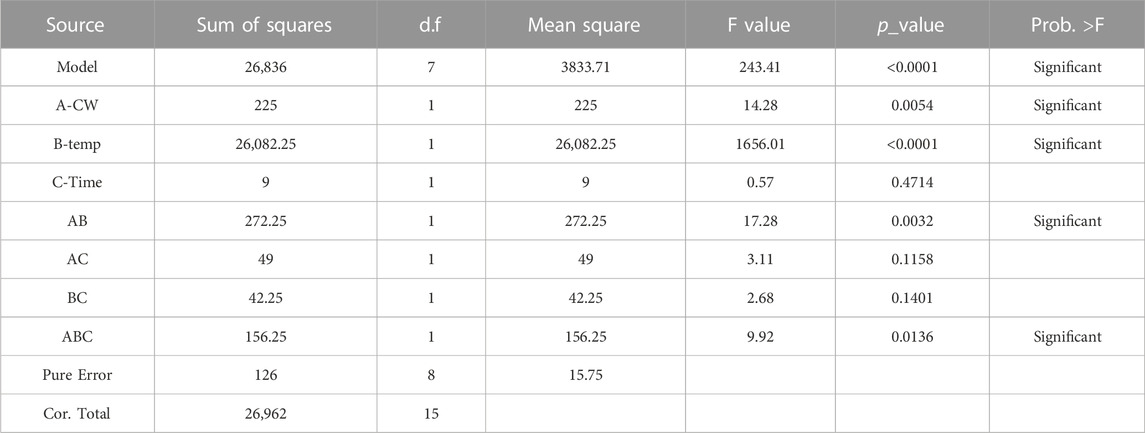
TABLE 7. ANOVA table (partial sum of squares) for response surface model (response: Yield strength).
Table 8 shows the ANOVA table for response surface model for UTS. This also shows that the “Prob. > F″ value for the model is less than 0.05 indicating that the model is statistically significant (Montgomery, 1997; Noordin et al., 2004). We have determined that the main effects of A-Cold Work (A-CW) and B-Temperature are significant model terms. Moreover, the interaction between Cold Work and Temperature is borderline significant, with a value close to 0.05. This suggests that these variables are important predictors of UTS in the model. However, other model terms are not significant, meaning that they do not have a significant effect on UTS.
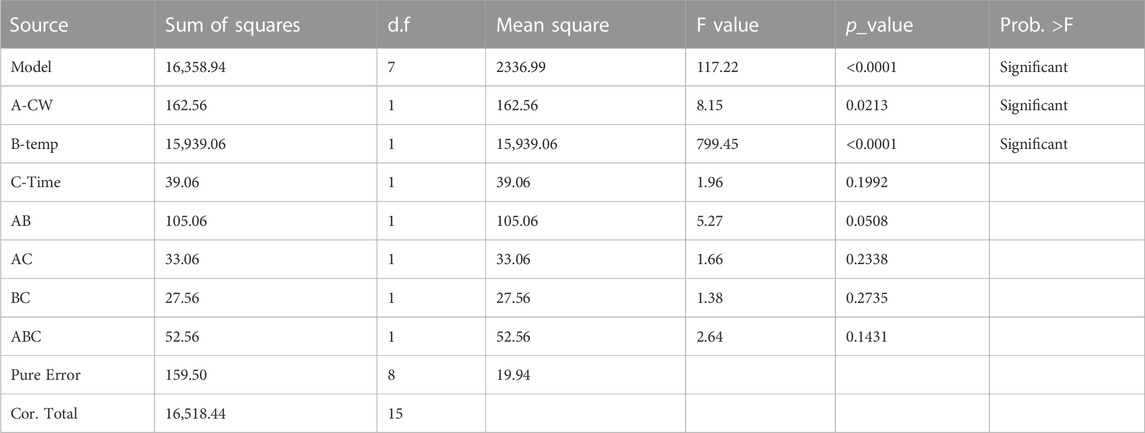
TABLE 8. ANOVA table (partial sum of squares) for response surface model (response: UTS).
Table 9 shows the ANOVA table for response surface model for elongation. We can see from this table that while Cold Work(A) and Temperature(B) are significant model terms, the overall model is not significant. Hence, we cannot predict elongation using these equations.
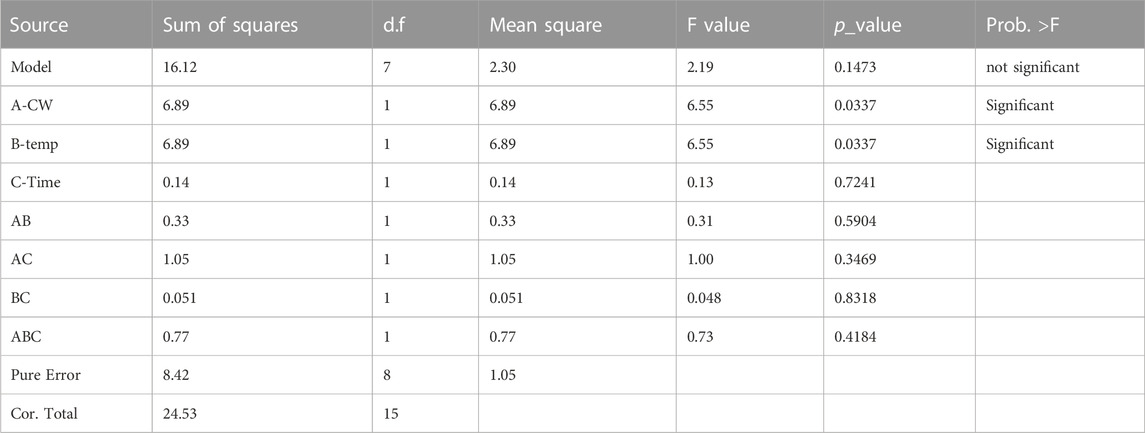
TABLE 9. ANOVA table (partial sum of squares) for response surface model (response: elongation).
The final empirical models in terms of all input factors are given by the following equations:
Thus, considering only the significant input factors, the following equations represent the final empirical models:
Our analysis has revealed that the model is significant for yield and UTS but not for elongation. Consequently, we can easily predict the yield and UTS from the input factors. However, elongation cannot be predicted. To predict yield, we require Cold Work, Temperature, and Time, as mentioned in Table 7. For UTS, only Cold Work, Temperature, and their interactions are significant factors, as noted in Table 8. Nonetheless, we cannot predict elongation based on this model using the input factors.
A scatter plot illustrating the comparison between the predicted and actual values of yield, ultimate tensile strength (UTS), and elongation for the aluminum alloy is shown in Figure 6. The x-axis denotes the actual values, while the y-axis represents the predicted values. Each data point on the graph corresponds to a single sample of the alloy, with the predicted value being the value predicted by the model, and the actual value being the observed value. The correlation coefficient (
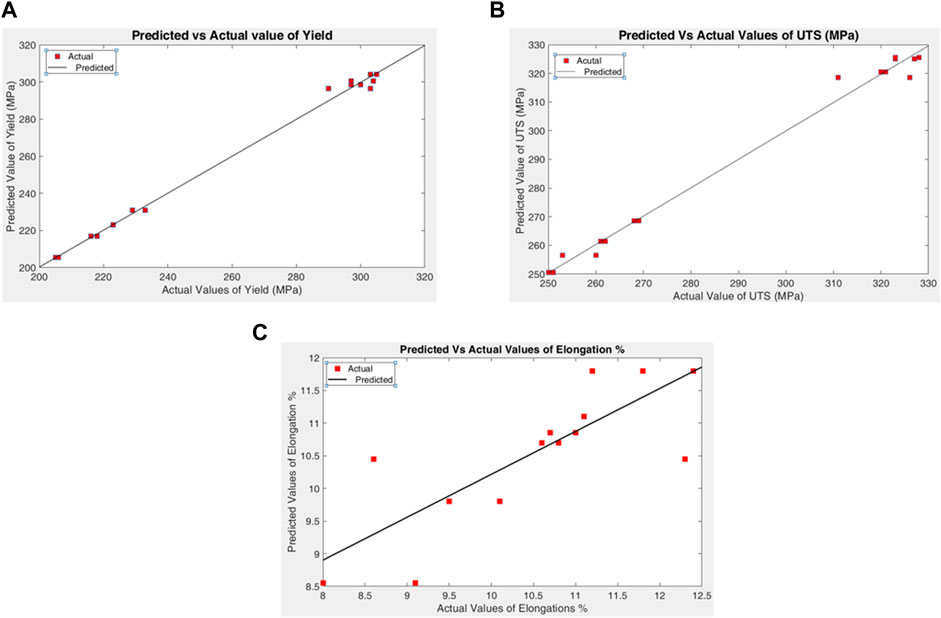
FIGURE 6. Plot of actual and predicted values of (A) yield (
Figures 7, 8, 9 exhibit overlay plots that showcase the relationship between the input variables examined in our study. These plots provide valuable insight into the optimal and feasible ranges of temperature, cold work, and time. The x- and y-axes correspond to a range of values, with +1 representing 30% cold work, 190°C temperature, and 18 h time, while −1 corresponds to 10% cold work, 160°C temperature, and 10 h time. A value of 0 represents the average of all input parameters, namely, 20% cold work, 175°C temperature, and 14 h time. The plots also display the upper and lower limits of yield, ultimate tensile strength (UTS), and elongation, as per our specifications, i.e., yield (260–330 MPa), UTS (290–350 MPa), and elongation (7%–15%). Figure 7 presents a contour plot showing the effect of temperature and time on yield, UTS, and elongation. Multiple combinations of temperature and time can be selected by identifying a point within the optimal region. It is worth noting that the optimum temperature range is approximately 155°C–172°C (Mirzakhani and Mansourinejad, 2011; Sadeghi et al., 2023), with no restriction on time shown but possible is from 10 h to maximum overaged time. Furthermore, Figure 8 demonstrates that cold work also impacts the properties of the alloy, particularly yield. Based on Figures 7, 8, 9, we infer that temperature is the most influential parameter, followed by cold work and time (Dong et al., 2017). Our study reveals that the optimal temperature range is between 155°C and 172°C, with a recommended cold work percentage of 10% and can be more and a preferred time of 10 h up to overage time which are consistent with ASTM standards for aging of aluminum alloy 6,061 (van Gorp et al., 1999).
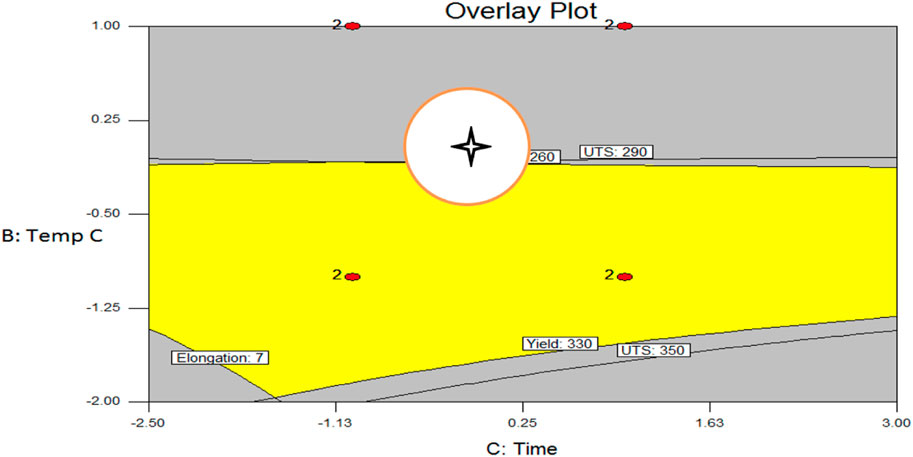
FIGURE 7. Overlay of the yield, UTS and elongation contours between temperature and time, showing the region of the optimum.
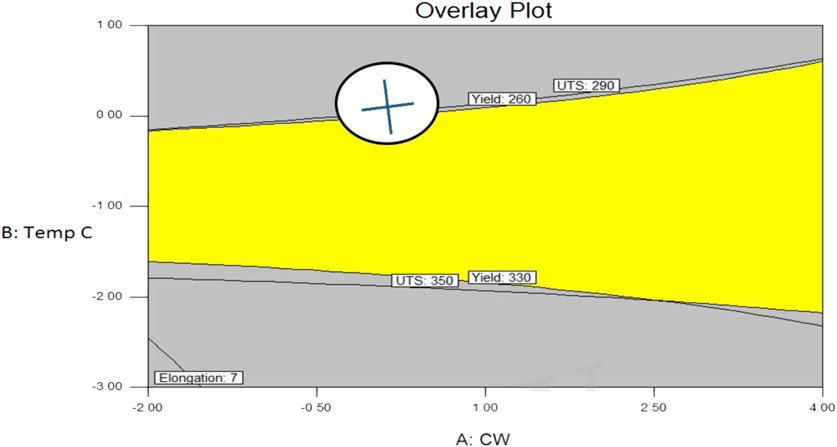
FIGURE 8. Overlay of the yield, UTS and elongation contours between temperature and cold work showing the region of the optimum.
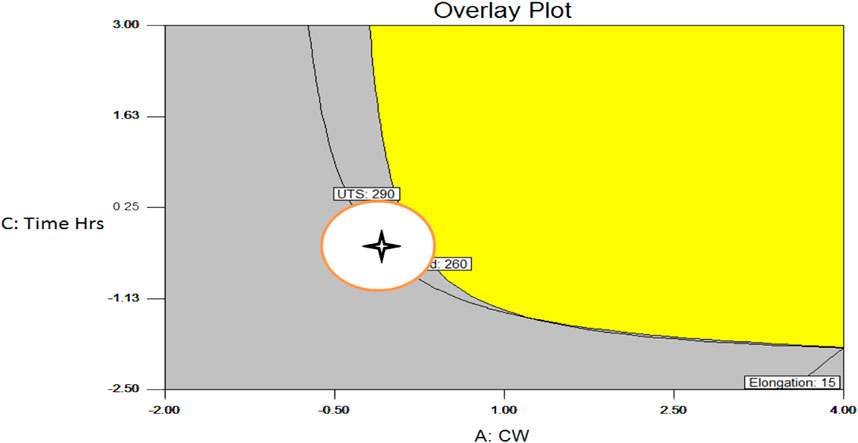
FIGURE 9. Overlay of the yield, UTS and elongation contours between time and cold work showing the region of the optimum.
4.3 Confirmation tests
To confirm the validity of the developed model, six additional experimental runs were conducted ( Table 10). The confirmation tests were performed considering CW as 20%, aging temperature as 175
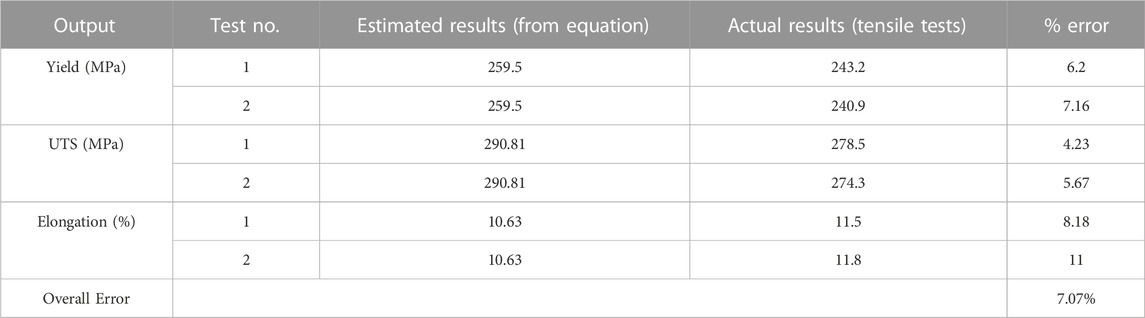
TABLE 10. Confirmation experiments.
5 Conclusion
This paper reports on an experimental study that investigated the effects of cold work percentage, aging time, and aging temperature on the yield strength, ultimate tensile strength, and percentage elongation of AA 6061. It was revealed that temperature factor is found the most significant factor. The empirical models obtained through DOE and subsequently reduced exhibited a reasonable level of accuracy and can be utilized for prediction within the range of the factors that were investigated. We have found that the preferable temperature ranges from 155 to 172
Data availability statement
The raw data supporting the conclusion of this article will be made available by the authors, without undue reservation.
Author contributions
Data curation, MZ; Formal analysis, BU; Funding acquisition, BS and SS; Investigation, MZ; Methodology, AM and KA; Resources, SS; Supervision, SN and BS; Writing—original draft, AM, KA, MZ, SS and RK. All authors contributed to the article and approved the submitted version.
Funding
This study received funding from King Saud University, Saudi Arabia through researchers supporting project number (RSP 2023R145). Additionally, the APCs were funded by King Saud University, Saudi Arabia through researchers supporting project number (RSP 2023R145).
Acknowledgments
The authors would like to thank King Saud University, Riyadh, Saudi Arabia, with researchers supporting project number RSP 2023R145.
Conflict of interest
The authors declare that the research was conducted in the absence of any commercial or financial relationships that could be construed as a potential conflict of interest.
Publisher’s note
All claims expressed in this article are solely those of the authors and do not necessarily represent those of their affiliated organizations, or those of the publisher, the editors and the reviewers. Any product that may be evaluated in this article, or claim that may be made by its manufacturer, is not guaranteed or endorsed by the publisher.
References
Akbarpour, M. R., Ebrahimi, M., and Torknik, F. S. (2019). Experimental investigation and response surface methodology of mechanical milling time effect on the microstructure, densification and microhardness of nanostructured copper. Mater. Res. Express 6 (5), 056537. doi:10.1088/2053-1591/ab056b
Bui, Q. H., Bihamta, R., Guillot, M., Rahem, A., and Fafard, M. (2011). Effect of cross section reduction on the mechanical properties of aluminium tubes drawn with variable wall thickness. J. Manuf. Sci. Eng. 133 (6), 061004. doi:10.1115/1.4005040
Choudhury, I. A., and El-Baradie, M. A. (1997). Surface roughness prediction in the turning of high-strength steel by factorial design of experiments. J. Mater. Process. Technol. 67 (1-3), 55–61. doi:10.1016/s0924-0136(96)02818-x
Clark, R., Coughran, B., Traina, I., Hernandez, A., Scheck, T., Etuk, C., et al. (2005). On the correlation of mechanical and physical properties of 7075-T6 Al alloy. Eng. Fail. Anal. 12 (4), 520–526. doi:10.1016/j.engfailanal.2004.09.005
Djavanroodi, F., Omranpour, B., Ebrahimi, M., and Sedighi, M. (2012). Designing of ECAP parameters based on strain distribution uniformity. Prog. Nat. Sci. Mater. Int. 22 (5), 452–460. doi:10.1016/j.pnsc.2012.08.001
Dong, G., Bi, J., Chen, X., and Zhao, C. (2017). Research on AA6061 tubular components prepared by combined technology of heat treatment and internal high pressure forming. J. Mater. Process. Technol. 242, 126–138. doi:10.1016/j.jmatprotec.2016.11.035
Ebrahimi, M., Pashmforoush, F., and Gode, C. (2019). Evaluating influence degree of equal-channel angular pressing parameters based on finite element analysis and response surface methodology. J. Braz. Soc. Mech. Sci. Eng. 41, 95. doi:10.1007/s40430-019-1597-y
Kadaganchi, R., Gankidi, M. R., and Gokhale, H. (2015). Optimization of process parameters of aluminum alloy AA 2014-T6 friction stir welds by response surface methodology. Def. Technol. 11 (3), 209–219. doi:10.1016/j.dt.2015.03.003
Liang, L., Xu, M., Chen, Y., Zhang, T., Tong, W., Liu, H., et al. (2021). Effect of welding thermal treatment on the microstructure and mechanical properties of nickel-based superalloy fabricated by selective laser melting. Mater. Sci. Eng. A 819, 141507. doi:10.1016/j.msea.2021.141507
Mahadevan, K., Raghukandan, K., Senthilvelan, T., Pai, B., and Pillai, U. (2006). Investigation on the influence of heat-treatment parameters on the hardness of AA6061-SiCp composite. J. Mater. Process. Technol. 171 (2), 314–318. doi:10.1016/j.jmatprotec.2005.06.073
Masounave, J., Youssef, Y. A., Beauchamp, Y., and Thomas, M. (1997). An experimental design for surface roughness and built-up edge formation in lathe dry turning. Int. J. Qual. Sci. 2 (3), 167–180. doi:10.1108/13598539710170803
Mirzakhani, B., and Mansourinejad, M. (2011). Tensile properties of AA6061 in different designated precipitation hardening and cold working. Procedia Eng. 10, 136–140. doi:10.1016/j.proeng.2011.04.025
Noordin, M. Y., Venkatesh, V. C., Sharif, S., Elting, S., and Abdullah, A. (2004). Application of response surface methodology in describing the performance of coated carbide tools when turning AISI 1045 steel. J. Mater. Process. Technol. 145, 46–58. doi:10.1016/s0924-0136(03)00861-6
Ortiz, D., AbdelshehidDalton, M. R., Soltero, J., Clark, R., Hahn, M., et al. (2007). Effect of cold work on the tensile properties of 6061, 2024, and 7075 Al alloys. J. Mater. Eng. Perform. 16 (5), 515–520. doi:10.1007/s11665-007-9074-7
Palani, P., and Murugan, N. (2008). Ferrite number optimisation for stainless steel cladding by FCAW using Taguchi technique. Int. J. Mater. Prod. Technol. 33 (4), 404–420. doi:10.1504/ijmpt.2008.022518
Reilly, C., Duan, J., Yao, L., Maijer, D. M., and Cockcroft, S. L. (2013). Process modeling of low-pressure die casting of aluminum alloy automotive wheels. J. Minerals, Metals Mater. Soc. 65, 1111–1121. doi:10.1007/s11837-013-0677-1
Risanti, D., Yin, M., Castillo, P. R-D., and Zwaag, S. v. d. (2009). A systematic study of the effect of interrupted ageing conditions on the strength and toughness development of AA6061. Mater. Sci. Eng. A 523 (1-2), 99–111. doi:10.1016/j.msea.2009.06.044
Sadeghi, A., Kozeschnik, E., and Biglari, F. R. (2023). Investigation of the formability of cryogenic rolled AA6061 and its improvement using artificial aging treatment. J. Manuf. Mater. Process. 7 (2), 54. doi:10.3390/jmmp7020054
Tamura, R., Watanabe, M., Mamiya, H., Washio, K., Yano, M., Danno, K., et al. (2020). Materials informatics approach to understand aluminum alloys. Sci. Technol. Adv. Mater. 21 (1), 540–551. doi:10.1080/14686996.2020.1791676
Tzeng, C.-J., Lin, Y.-H., Yang, Y.-K., and Jeng, M.-C. (2009). Optimization of turning operations with multiple performance characteristics using the Taguchi method and Grey relational analysis. J. Mater. Process. Technol. 209 (6), 2753–2759. doi:10.1016/j.jmatprotec.2008.06.046
van Gorp, A., Mussert, K., Janssen, M., Bakker, A., and van der Zwaag, S. (1999). A critical appraisal of fracture toughness measurements on AA6061 and an Al O -particle reinforced AA6061 alloy for various heat treatments. Delft: Delft University of Technology.
Venugopal, L., Davidson, M. J., and Selvaraj, N. (2012). Analysis of tube end forming process using Taguchi design of experiments. Usak Univ. J. Material Sci. 2, 137–145.
Yamada, K., Sato, T., and Kamio, A. (2000). Effects of quenching conditions on two-step aging behavior of Al-Mg-Si alloys. Mater. Sci. Forum 331, 669–674. doi:10.4028/www.scientific.net/msf.331-337.669
Yang, W. H., and Tarng, Y. S. (1998). Design optimization of cutting parameters for turning operations based on the Taguchi method. J. Mater. Process. Technol. 84 (1-3), 122–129. doi:10.1016/s0924-0136(98)00079-x
Zhang, B., Wang, Z., Yu, H., and Ning, Y. (2022). Microstructural origin and control mechanism of the mixed grain structure in Ni-based superalloys. J. Alloys Compd. 900, 163515. doi:10.1016/j.jallcom.2021.163515
Zhang, H., Xiao, Y., Xu, Z., Yang, M., Zhang, L., Yin, L., et al. (2022). Effects of Ni-decorated reduced graphene oxide nanosheets on the microstructural evolution and mechanical properties of Sn-3.0Ag-0.5Cu composite solders. Intermetallics 150, 107683. doi:10.1016/j.intermet.2022.107683
Zhang, P., Gao, Y., Liu, Z., Zhang, S., Wang, S., and Lin, Z. (2023). Effect of cutting parameters on the corrosion resistance of 7A04 aluminum alloy in high speed cutting. Vacuum 212, 111968. doi:10.1016/j.vacuum.2023.111968
Keywords: design of experiment, yield, ultimate tensile strength, elongation, anova, aluminium ally AA6061, plasticity
Citation: Mehmood A, Akhtar K, Noor S, Zahir MZ, Ullah B, Khan R, Salah B and Sajid Ullah S (2023) Experimental study to optimize cold working, aging temperature, and time on the properties of AA6061 tubes: analysis using design of experiment. Front. Mater. 10:1199099. doi: 10.3389/fmats.2023.1199099
Received: 02 April 2023; Accepted: 18 May 2023;
Published: 30 May 2023.
Edited by:
Chao Yang, South China University of Technology, ChinaCopyright © 2023 Mehmood, Akhtar, Noor, Zahir, Ullah, Khan, Salah and Sajid Ullah. This is an open-access article distributed under the terms of the Creative Commons Attribution License (CC BY). The use, distribution or reproduction in other forums is permitted, provided the original author(s) and the copyright owner(s) are credited and that the original publication in this journal is cited, in accordance with accepted academic practice. No use, distribution or reproduction is permitted which does not comply with these terms.
*Correspondence: Arshad Mehmood, YXJzaGFkbWVobW9vZEB1ZXRwZXNoYXdhci5lZHUucGs=; Syed Sajid Ullah, c3llZC5zLnVsbGFoQHVpYS5ubw==