 Gui Hou1,2
 Guozhi Zheng
95% of researchers rate our articles as excellent or good
Learn more about the work of our research integrity team to safeguard the quality of each article we publish.
Find out more
ORIGINAL RESEARCH article
Front. Mater. , 30 May 2023
Sec. Structural Materials
Volume 10 - 2023 | https://doi.org/10.3389/fmats.2023.1196989
The bearing plates used in plate load test for highway engineering are typically rigid. However, due to limitations in obtaining the accurate distribution of compressive stress at the bottom of the bearing plate, there is often a significant deviation between the measured subgrade resilient modulus and the actual condition. To address this issue, a flexible bearing plate can be used to test the subgrade and obtain a more accurate resilient modulus. In this study, we use variance and degree of mean deviation to quantitatively evaluate the distribution uniformity of compressive stress. To create a rigid-flexible bearing plate that is similar to a flexible bearing plate, we explore the combinatorial design of steel plates and rubber mats. We examine factors such as the thickness (10, 20, and 30 mm) of the steel plate, elastic modulus (5, 10, and 20 MPa) and thickness (10, 20, and 30 mm) of the rubber mat, friction coefficient (μ:0, 0,2, 0.4, 0.6, 0.8, ∞) between the bearing plate and subgrade, and the combined shape characteristics of the rubber mat and steel plate. To reduce friction between the rubber mat and subgrade, we use lubricant, and through our design process, we develop a flexible bearing plate with relatively uniform compressive stress. Our computations show that when μ = 0.05, the variance is 0.0001, and the degree of mean deviation is 0.0780. These results indicate that the distribution uniformity of the compressive stress is very close to the uniform distribution load, which meets the necessary accuracy requirements for engineering applications.
The compressive stress of rigid bearing plate was studied.
The compressive stress of rigid-flexible bearing plate was studied.
A flexible bearing plate based on steel plate and rubber mat was designed.
With the development of the economy and society, vehicle load and traffic volume increase day by day. The road is facing severe challenges. Many newly built roads cannot meet design life requirements. It is essential to select the modulus of each structural layer reasonably before design and calculation. The lower the subgrade’s resilient modulus is, the higher the thickness of the overall structure layer of the road is. If the subgrade resilient modulus is too high, it is necessary to increase the compaction degree of the subgrade or take other measures to meet the requirements. Such a wide range of treatments will inevitably cause resource waste. Fentaw et al. (2021) examined the effects of poor subgrade soil stabilization using the mixture of MD, RHA and cement to enhance substandard soil engineering properties to be used as subgrade materials. Hossain et al. (2021) found that Soft cohesive soils have low strength, high plasticity, and a large expansion ratio making them unsuitable as a road subgrade. The use of fly ash from the power plants to improve soft cohesive soils for road subgrade may be an environment-friendly alternative to its disposal in the ponds. Degu et al. (2022)found that the cause for failure of flexible pavement in the case of Bako to Nekemte was: insufficient and absence of side drainage structure, traffic loading, poor gradation of base course and sub-base material, and poor quality of subgrade soil. A. Rashid et al. (2017) developed a series of preliminary design charts to predict the bearing capacity of fully and partially penetrated deep mixing (DM) of soft soil.
Is The subgrade’s resilient modulus is one of the essential parameters in the pavement structure design, which is a mechanical index reflecting the subgrade’s stiffness. Detecting and evaluating the resilient modulus of the completed subgrade is vital for highway engineering quality assessment. The subgrade’s resilient modulus testing mainly includes indoor and outdoor testing. Indoor testing includes static triaxial testing (Salamatpoor and Salamatpoor, 2014) and dynamic triaxial testing (Kaya et al., 2021). Outdoor testing includes bearing plate testing, Beckman beam testing (Ueshita et al., 1973), field testing of CBR value (Mendoza and Caicedo, 2019), Rayleigh wave testing (Cao-Rial et al., 2020), falling weight deflectometer testing (Zhao et al., 2022) (FWD), and portable falling weight deflectometer testing (George and Kumar, 2020) (PFWD). The first three work by applying static load, and the last three work by using dynamic load. The outdoor test method is relatively more complex than indoor test method, but the test results are more closer to the actual pavement service state than indoor test method. The standard subgrade’s resilient modulus testing is rigid bearing plate testing. Field testing of highway subgrade and pavement (JTG 3450-2019) (TRANSPORT, 2019) gives specific test steps and calculation methods for the bearing plate testing.
A series of research on the bearing plate had been carried out, including theoretical analysis and experimental research. (Wang, 1990) used the Hankel integral formula to transform the integral representation of stress and displacement into an algebraic expression, which was in elastic half-space body under the action of a circular rigid bearing plate. Li et al. (1992) used rigid bearing plate load as the mechanical model to calculate the compressive resilient modulus of each pavement structural layer and compiled a back-calculation program. The rationality of this method was proved by back-calculation of the actual test results and comparative analysis with the recommended value in Revision of Highway Flexible Pavement Design Specification (JTJ 014-86) (TRANSPORT, 1986). Liu et al. (2014a) carried out an in-depth theoretical analysis of the critical technologies and theories involved in the bearing plate testing, such as the grading influence quantity, coordinate origin correction, and calculation formula. On this basis, he proposed a new calculating method to determine the resilient modulus. Ma and Shi, (2006) selected four different classified highways to conduct bearing plate testing under different loads due to the shortcomings in the bearing plate testing. They put forward the deflection and compressive stress range at the top of the subgrade of different classified highways. (Shi, 2011) analyzed the current bearing plate testing. According to the existing problems of the testing, he put forward a new bearing plate testing applied to different classified highways. Zhang et al. (2018) proved the necessity of using a two-parameter foundation model by outdoor bearing plate testing. Chindaprasirt et al. (2022) accurately estimated the resilient modulus of on-site loess and laterite-loess through indoor bearing plate testing. Rezaei et al. (2018) studied the influence of stress values and size of the bearing plate on the in situ deformation modulus of the rock mass. Huang et al. (2020) derived the viscoelastic analytical solution for the bearing plate testing according to the proposed viscoelastic combined model and the viscoelastic theory. They conducted the flexible bearing plate testing and the rigid bearing plate testing. Based on the testing results, the optimal rheological model and corresponding parameters of the rock aging deformation model were determined according to the optimized inversion method. (Khafizov, 2006) used the finite element method to conduct a numerical analysis of the stress-strain state of permafrost under rigid bearing plate testing. Elastic-plastic deformation and crack formation were taken into account. Zhang et al. (2008) conducted the deformation testing of the rigid bearing plate’s center hole. They derived the settlement deformation formula of deep rock under the circular bearing plate, which can be used to calculate the equivalent elastic modulus and equivalent deformation modulus of rock mass at different depths. Yamamoto et al. (1967) used a rigid bearing plate to test flexible pavement structures with different structural layer thicknesses and base layers and analyzed the results.
Xu et al. (2017); (Xu et al., 2018) developed a flexible bearing plate suitable for PLT by adding an airbag under the rigid bearing plate. They tested the deformation modulus of foundation soil through indoor testing. The results showed that the testing results based on the rigid bearing plate were 14% larger than that of the flexible bearing plate. It was pointed out that the traditional rigid bearing plate testing can accurately determine the bearing capacity of the foundation soil but cannot inverse the shear strength parameters c and ϕ of the soil. At the same time, the indoor flexible bearing plate testing using clay and dry sand proved the feasibility of the inversion method and the applicability and advance of the inversion method. Liu et al. (2014b); (Yang et al., 2014) developed a flexible bearing plate suitable for PLT by adding a flexible water sac under the rigid bearing plate. Displacement sensors of inductive type were presented in the position of the bottom to measure the deflection of different positions. The feasibility and accuracy of the method were proved by instrument manufacturing, calibration, and testing. Nozomu et al. (2018) conducted a series of direct shear tests with plastic bearing plates of different sizes and stiffness to evaluate the influence of size and stiffness on shear strength. Zhu et al. (2021) applied a uniform load to the top surface of the subgrade with the help of a flexible airbag. The research results showed that the subgrade’s bearing capacity and deformation modulus tested with the flexible bearing plate was greater than those tested with the rigid bearing plate. (Beer, 1970) applied uniform load to the subgrade by using a flexible airbag to simulate the overburden pressure and studied the influence of the bearing plate’s shape on the bearing capacity of the subgrade.
This paper uses the finite element method to change the stress distribution by adding a rubber mat under the plate. The distribution of vertical compressive stress was studied by changing the rubber mat’s thickness and shape. A flexible bearing plate composed of steel and rubber is proposed. The variance (s2)and degree of mean deviation(p) of compressive stress at different positions are used to analyze and describe the distribution uniformity of the compressive stress. Based on the above research results, a flexible bearing plate composed of steel and rubber is designed. The test result of flexible bearing plate is closer to the actual situation than that of rigid bearing plate. The research of this paper provides a reference for the application of flexible bearing plate in engineering practice.
Ideal rigid bearing plate means that the elastic modulus of rigid bearing plate compared with subgrade is infinitely great. The expression of compressive stress under vertical load is:
where p is the load grade (MPa), δ is the radius of the rigid bearing plate (mm), and r is the distance between a certain point and the center point (mm).
For the ideal rigid bearing plate, the compressive stress is shown in Figure 1 (Guo and Feng, 2001). The load degree is 0.7 MPa. The radius of the rigid bearing plate is 150 mm.
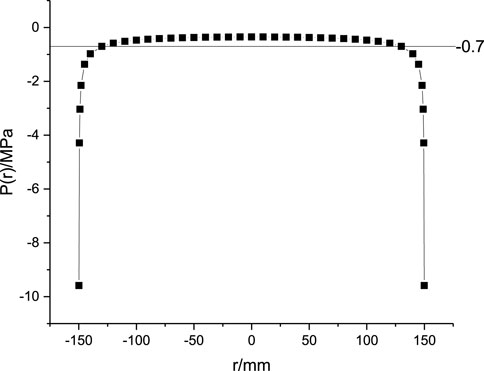
FIGURE 1. Compressive stress at the bottom of the ideal rigid bearing plate.
As shown in Figure 1, for the ideal rigid bearing plate, the central compressive stress of the bearing plate is 0.35 MPa, and the compressive stress at the edge tends to be infinitely great. From the edge to the center, the compressive stress decreases gradually. The distribution uniformity of the compressive stress is very poor (Guo and Feng, 2001).
Points are selected from the center to the edge every 10 mm to study the distribution uniformity of compressive stress. The outermost point was at the bottom edge of the bearing plate. The sketch map is shown in Figure 2.
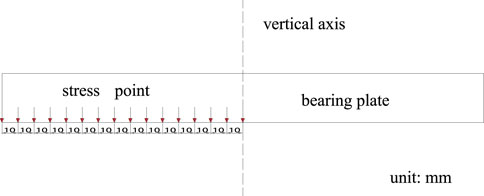
FIGURE 2. Sketch map of compressive stress at the bottom of bearing plate.
In this paper, variance and degree of mean deviation represent the distribution uniformity of compressive stress. The formula of variance is defined as below:
of which,
The degree of mean deviation is defined as below:
of which,
The smaller s2 and d are, the better uniformity the compressive stress is. When s2 and d are equal to zero, it means the uniform compressive stress.
This paper uses the general finite element software ABAQUS for simulating calculation. Because the bearing plate is circular and the subgrade is an elastic half-space body, the model is symmetrical in the vertical direction of any plane crossing the Y-axis. The calculation can be simplified by any two-dimensional plane model crossing the Y-axis. The first step is to define a model. The subgrade is 5000 mm × 5000 mm. According to the calculation examples, the sizes of the steel plate and the rubber mat are selected. The second step is to set up materials. The elastic modulus of the subgrade is selected according to the calculation examples, ranges from 40 MPa to 80 MPa The Poisson’s ratio of the subgrade is 0.40. The elastic modulus of the steel plate is 200000 MPa. The Poisson’s ratio of the steel plate is 0.25. The Poisson’s ratio of rubber is 0.47. The elastic modulus of rubber is selected according to the calculation example, ranges from 5 MPa to 20 MPa. The third step is to create an instance. The fourth step is to choose the analysis step. This paper adopts the static universal analysis step. The fifth step is to set up the interaction. Complete continuous contact is adopted between the steel plate and the rubber mat. Hard contact is assumed between the rubber mat and the subgrade vertically. The horizontal connection is divided into rough, smooth, and semi-continuous. The sixth step is load application. A uniformly distributed load is applied on the top surface of the steel plate. The load is selected according to the calculation examples. The fixed constraint is used at the bottom of the subgrade, and the standard displacements of the two sides are all zero. The seventh step is meshing generation. The global size of the mesh used in the subgrade is 10 mm. The global size of the steel plate and rubber mat are all 1 mm. Quadrilateral mesh is adopted in this paper. The finite element calculation model is shown in Figure 3.
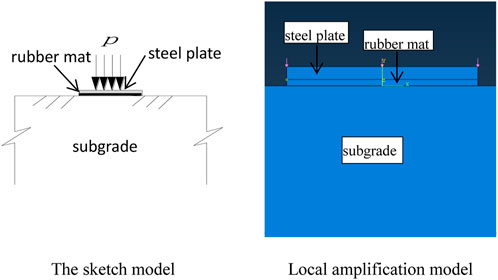
FIGURE 3. Finite element method model.
The model parameters are in Table 1. Models I to IV are models of Sections 5.1, 5.2, 5.3, 5.4.
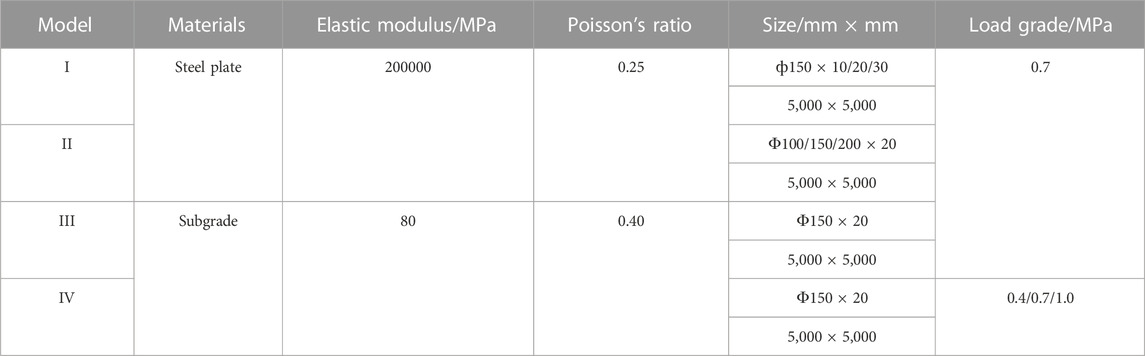
TABLE 1. Model parameters (rigid bearing plate).
Compressive stress with different thicknesses (h1) and the distribution uniformity is shown in Figure 4. The size of the standard rigid bearing plate is ф150 mm × 20 mm. Because the bending stiffness of the bearing plate is related to the ratio of the diameter and thickness of the rigid bearing plate, the radius of the rigid bearing plate is kept unchanged, and the bearing plate with a thickness (h1) of 10 mm, 20 mm, and 30 mm is used for calculation.
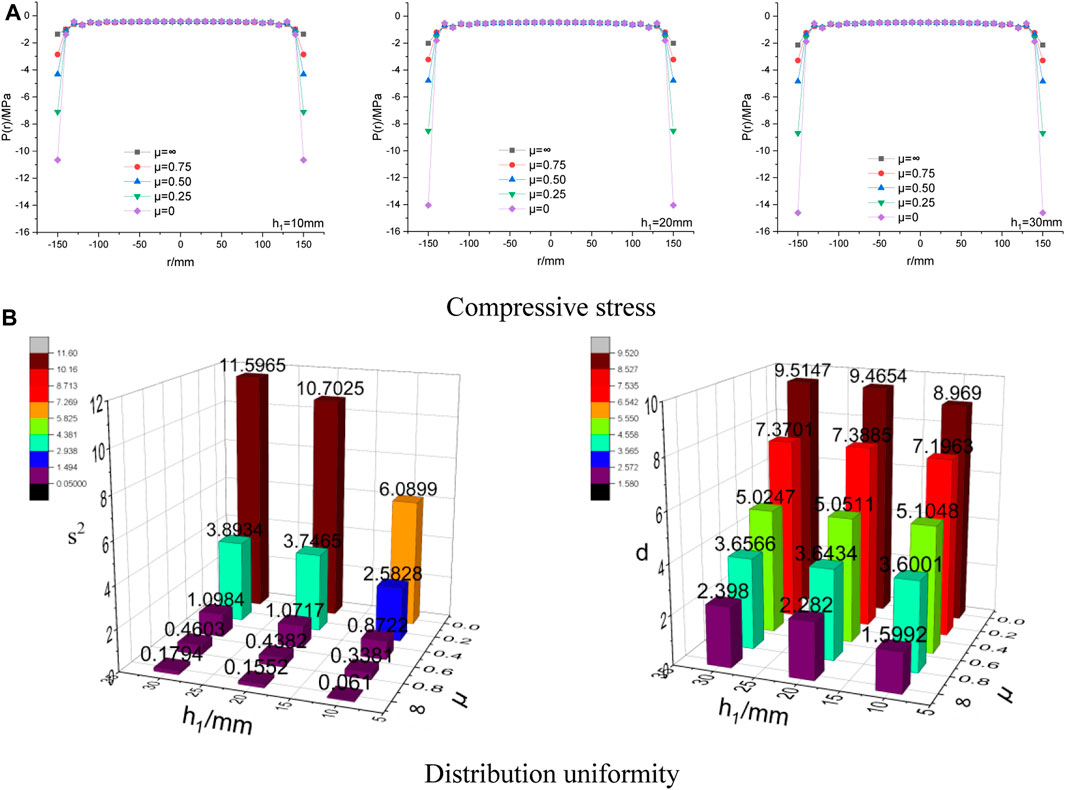
FIGURE 4. Compressive stress with different thicknesses (h1) and the distribution uniformity.
When the rigid bearing plate acts directly on the subgrade, μ significantly influences the compressive stress. As shown in Figure 4A, the compressive stress at the bottom edge increases with the decrease of μ. At the edge position, the greater the thickness of the bearing plate is, the greater the compressive stress is. There is a significant difference between the edge compressive stress under completely smooth and rough conditions. The stress distribution of the rigid bearing plate is closest to that of the ideal rigid bearing plate when the contact surface is entirely rough. In the design of a flexible bearing plate, the friction between the bearing plate and subgrade should be as small as possible. As shown in Figure 4B, the distribution uniformity of compressive stress increases with the decrease of μ. From the angle of variance, the distribution uniformity of compressive stress decreases with the steel plate’s thickness increase. From the angle of deviation degree, when μ≥ 0.75, the distribution uniformity of compressive stress decreases with the increase of the thickness of the steel plate. When μ = 0.5 and the thickness of the bearing plate is 20 mm, the distribution uniformity of compressive stress is the worst. When μ≤ 0.25, the distribution uniformity of compressive stress decreases with the increase of the thickness of the steel plate. The distribution uniformity of compressive stress decreases with the increase of the rigid bearing plate’s thickness. When the rigid bearing plate’s thickness increases from 10 mm to 20 mm, the distribution uniformity of compressive stress decreases observably. When the rigid bearing plate’s thickness increases from 20 mm to 30 mm, the distribution uniformity of compressive stress decreases finitely. The phenomenon above indicates that it is reasonable to adopt ф 150 mm × 20 mm for the rigid bearing plate.
Compressive stress with different radius(δ) and the distribution uniformity is shown in Figure 5. The thickness of the bearing plate is 20 mm, and the bearing plate with a radius(δ) of 100 mm, 150 mm, and 200 mm is used for calculation.
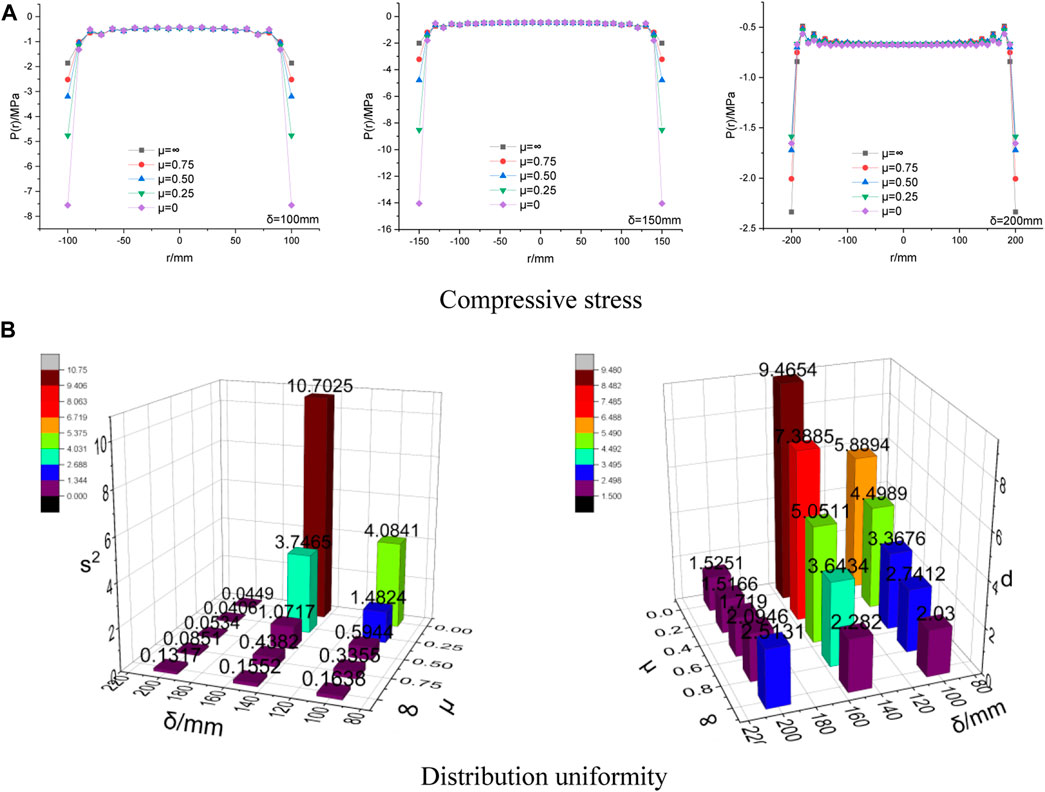
FIGURE 5. Compressive stress with different radius(δ) and the distribution uniformity.
As shown in Figure 5A, when the thickness of the bearing plate is 20 mm, the difference between the compressive stress at the bottom edge and the center of the bearing plate with a radius of 15 mm is the largest. The stress distribution at the bottom is closest to the ideal rigid bearing plate. As shown in Figure 5B, the distribution uniformity of compressive stress with a radius of 10 mm and 15 mm decreases with> the decrease of μ. When μ is 0.25, the distribution uniformity of the compressive stress with a radius of 20 mm is the best. When μ0.25, the distribution uniformity of the compressive stress increases with the decrease of μ. When μ≤ 0.25, the distribution uniformity of the compressive stress decreases with the decrease of μ. When the contact surface is completely rough, the distribution uniformity of compressive stress with a radius of 10 mm is the worst, slightly larger than that with a radius of 15 mm. When μ≤ 0.75, the distribution uniformity of compressive stress with a radius of 15 mm is the worst. As shown in the above results, when the thickness of the bearing plate is 20 mm, the distribution uniformity of compressive stress with a radius of 150 mm is closest to the ideal rigid bearing plate.
The suggested resilient modulus at the top of the subgrade is in Table 2 (TRANSPORT, 2017). Compressive stress with different subgrade elastic modulus (Es) and the distribution uniformity in Figure 6. According to the suggested values, the subgrade with an elastic modulus (Es) of 40 MPa, 60 MPa, and 80 MPa is used for calculation.

TABLE 2. Resilient modulus at the top of subgrade (MPa).
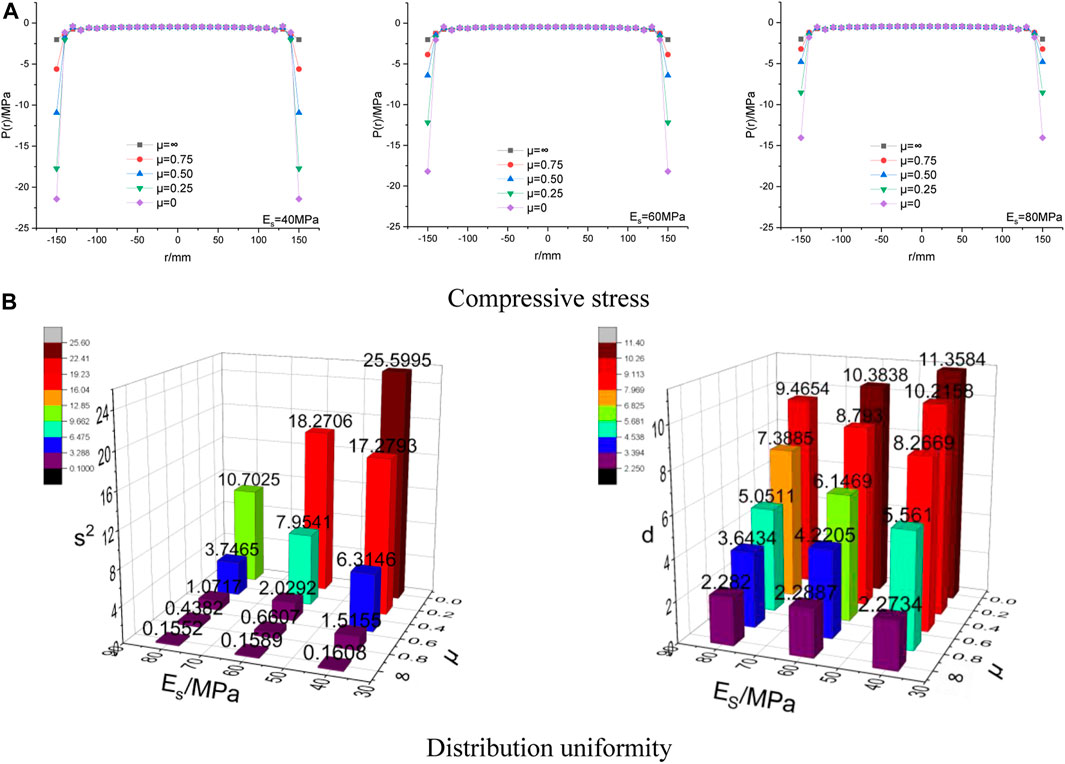
FIGURE 6. Compressive stress with different subgrade elastic modulus (Es) and the distribution uniformity.
As shown in Figure 6A, for the subgrade with different elastic modulus, the compressive stress at the bottom edge increases with the decrease of μ. As shown in Figure 6B, when the interface is entirely rough, from the angle of variance, the distribution uniformity of compressive stress increases with the increase of the subgrade’s modulus. From the angle of the degree of mean deviation, when the soil modulus is 40 MPa, the distribution uniformity of compressive stress is the best. When the subgrade modulus is 60 MPa and 80 MPa, the distribution uniformity of compressive stress is approximative. When μ≤ 0.75, the distribution uniformity of compressive stress increases with the increase of the subgrade’s elastic modulus. According to Specifications for Design of Highway Asphalt Pavement (JTG D50-2017), the equivalent resilient modulus of the top surface of the subgrade is not less than 70 MPa under load IV. In this paper, when calculating the compressive stress and designing the flexible bearing plate, the elastic modulus of the subgrade is 80 MPa to participate in the calculation and design.
Compressive stress with different load grade(p) and the distribution uniformity is shown in Figure 7. The loading grades of 0.4 MPa, 0.7 MPa, and 1.0 MPa are chosen for calculation.
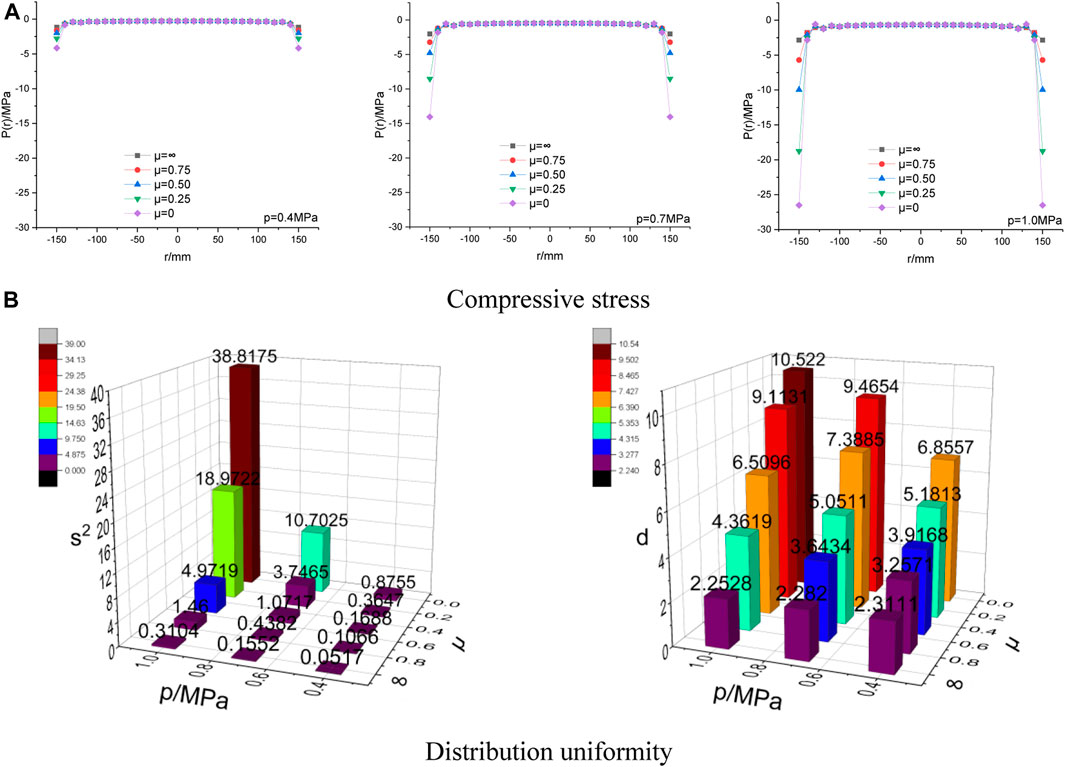
FIGURE 7. Compressive stress with different load grade(p) and the distribution uniformity.
As shown in Figure 7A, for the three different load grades, the compressive stress at the bottom edge decreases with the decrease of μ. As shown in Figure 7B, for the three different load grades, the distribution uniformity of compressive stress increases with the decrease of μ. When the contact surface is completely rough, from the angle of variance, the distribution uniformity of compressive stress increases with the increase of load grade. From the angle of the degree of mean deviation, the distribution uniformity of compressive stress decreases with the increase of load grade. When μ≤ 0.75, the distribution uniformity of compressive stress increases with the increase of load grade.
The model parameters are in Table 3. Models I to IV are models of Sections 6.1, 6.2, 6.3, 6.4.

TABLE 3. Model parameters (rigid-flexible bearing plate).
Due to modification, there are thousands of types of rubber, ranging in modulus from low to high. The rubber mats with an elastic modulus (Er) of 5 MPa, 10 MPa, and 20 MPa are chosen for calculation in this paper. Compressive stress with different rubber mat elastic modulus (Er) and the distribution uniformity is shown in Figure 8.
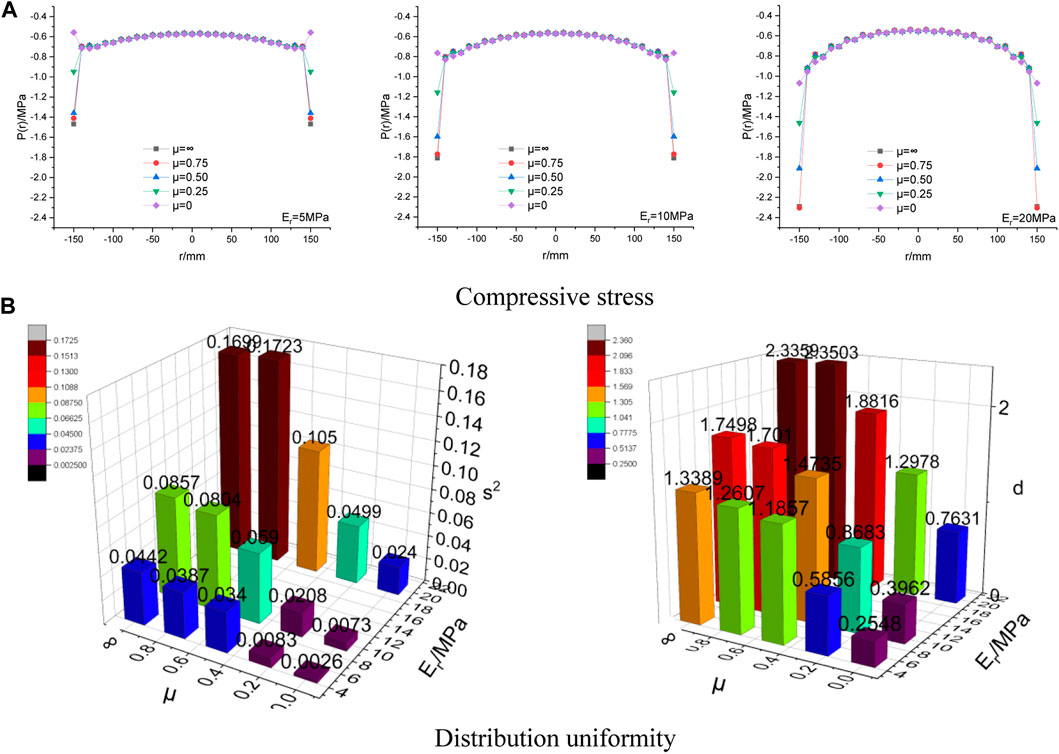
FIGURE 8. Compressive stress with different rubber mat elastic modulus (Er) and the distribution uniformity.
As shown in Figure 8A, for rubber mats with an elastic modulus of 5 MPa and 10 MPa, the compressive stress at the bottom edge decreases with the decrease of μ. For rubber mats with elastic modulus of 20 MPa, when the contact surface is wholly rough, or μ is 0.75, the compressive stress at the bottom edge of the bearing plate is nearly the same. When μ≤ 0.75, the compressive stress at the bottom edge decreases with the decrease of μ. As shown in Figure 8B, for rubber mats with an elastic modulus of 5 MPa and 10 MPa, the distribution uniformity of compressive stress increases with the decrease of μ. For rubber mats with elastic modulus of 20 MPa, the distribution uniformity of compressive stress is the worst when μ is 0.75. When μ≤ 0.75, the distribution uniformity of compressive stress increases with the decrease of μ. For any μ, the distribution uniformity of compressive stress increases with the rubber mat’s elastic modulus decrease. In the design of a flexible bearing plate, the rubber mat with a relatively small elastic modulus should be selected as far as possible. The elastic modulus of natural rubber is 7.8 MPa, and Poisson’s ratio is 0.47. Natural rubber can be considered in the flexible bearing plate design. In the following analysis, the elastic parameters of the rubber mat are selected according to natural rubber.
Compressive stress with different thicknesses (h2) of rubber mat and the distribution uniformity is shown in Figure 9. The stiffness of the rigid-flexible bearing plate is related to the thickness of the rubber mat, so the rubber mats with a thickness (h2) of 10 mm, 20 mm, and 30 mm are chosen for calculation in this paper.
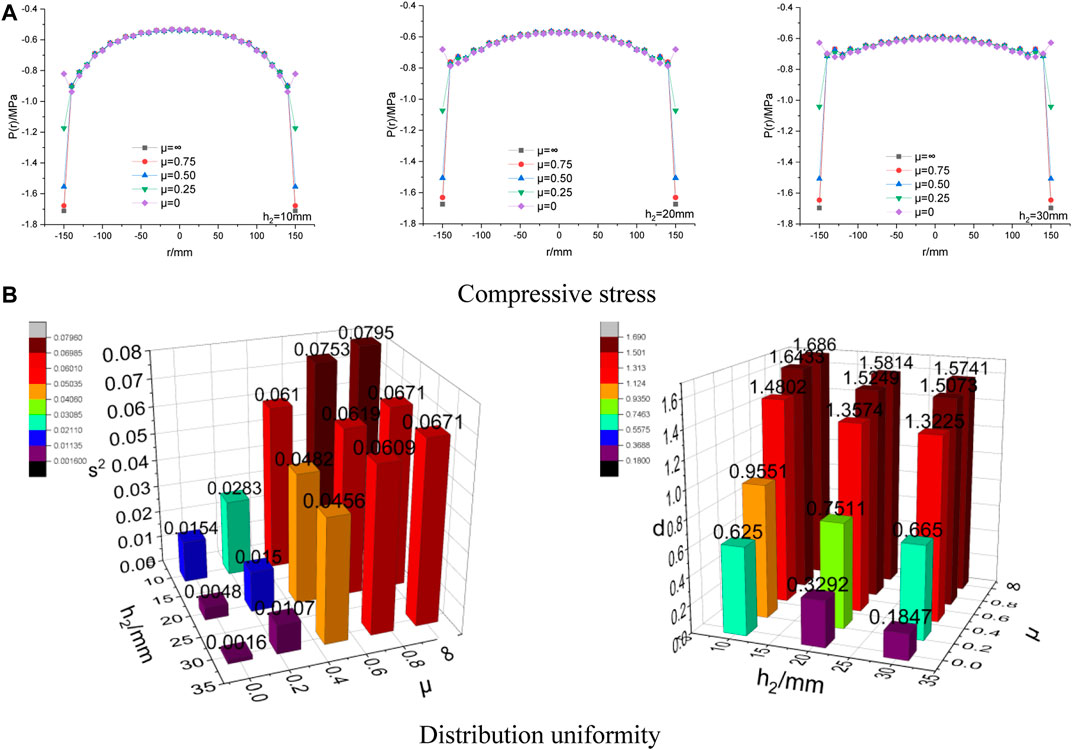
FIGURE 9. Compressive stress with different thicknesses (h2) of rubber mat and the distribution uniformity.
As shown in Figure 9A, for rubber mats of different thicknesses, the compressive stress at the bottom edge decreases with the decrease of μ. As shown in Figure 9B, for rubber mats of different thicknesses, the distribution uniformity of compressive stress at the bottom edge increases with the increase of μ. When μ is the same, the distribution uniformity of compressive stress increases with the increase of the rubber mat’s thickness. When μ> 0.25, the influence of μ on the distribution uniformity of compressive stress is limited. When μ< 0.25, the influence of μ on the distribution uniformity of compressive stress is significant. In the manufacturing operation of the rubber mat, it is necessary to ensure the smoothness and flatness of the rubber mat as far as possible. The purpose is to reduce the friction between the rubber mat and the subgrade. During outdoor testing, friction between the rubber mat and the subgrade decreases by using a lubricant (French chalk et al.) on the contact surface. μ should be controlled as small as possible through the manufacturing operation and the planeness of subgrade in outdoor testing. When μ is small, the rubber mat should not be too thick, considering the influence of horizontal displacement. Overall consideration, the thickness of the rubber mat should be around 20 mm–30 mm.
Compressive stress with different subgrade elastic modulus (Es) and the distribution uniformity is shown in Figure 10. According to the suggested values of standard, the subgrade with an elastic modulus of 40 MPa, 60 MPa, and 80 MPa is chosen for calculation.
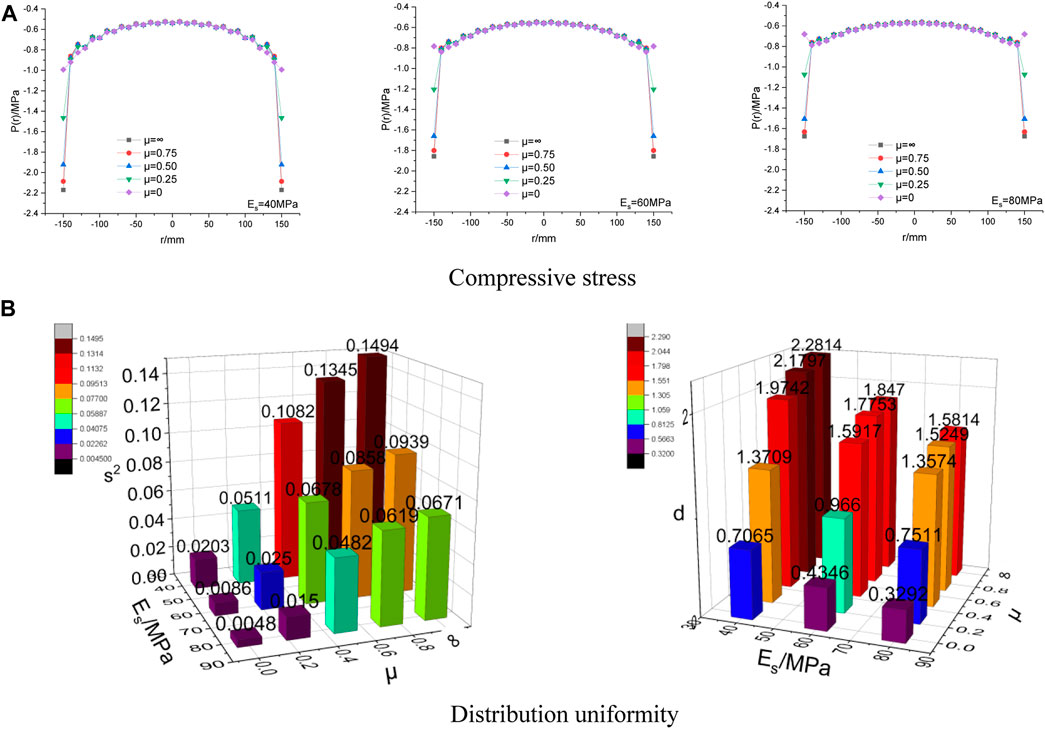
FIGURE 10. Compressive stress with different subgrade elastic modulus (Es) and the distribution uniformity.
As shown in Figure 10A, for the subgrade with different elastic modulus, the compressive stress at the bottom edge decreases with the decrease of μ. As shown in Figure 10B, for the subgrade with different elastic modulus, the distribution uniformity of compressive stress increases with the decrease of μ. When μ is the same, the distribution uniformity of compressive stress decreases with the increase of the subgrade’s elastic modulus. The change rule is opposite to that of the rigid bearing plate.
Compressive stress with different load grade (p) and the distribution uniformity is shown in Figure 11. The same as the rigid bearing plate, the loading grades of 0.4 MPa, 0.7 MPa, and 1.0 MPa are chosen for calculation.
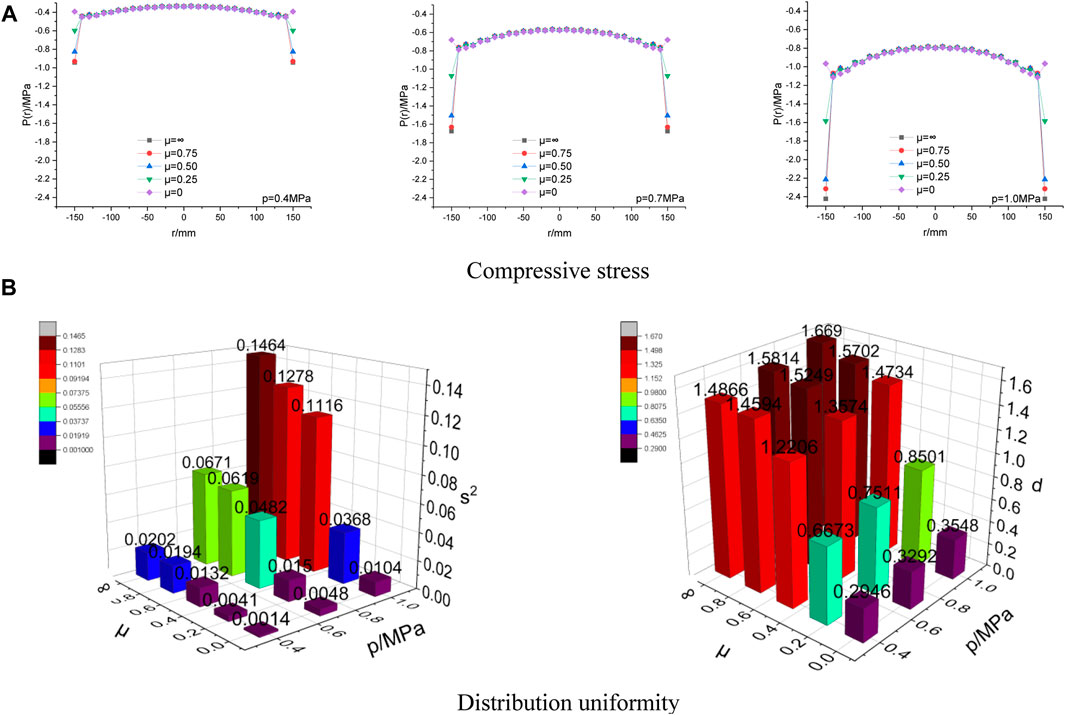
FIGURE 11. Compressive stress with different load grade (p) and the distribution uniformity.
As shown in Figure 11A, for different load grades, the compressive stress at the bottom edge increases with the increase of μ. As shown in Figure 11B, the greater the load grade is, the worse the distribution uniformity of compressive stress is. For the same load grade, the greater μ is, the worse the distribution uniformity of compressive stress is. When the load grade is 0.7 MPa, and the contact surface is entirely smooth, the variance of compressive stress is 0.0014, and the degree of mean deviation is 0.2946, the distribution uniformity of compressive stress is excellent. According to Field testing of highway subgrade and pavement (JTG 3450-2019), the pressure-deformation curve of the soil foundation is tested by stepwise loading. When p < 0.1MPa, the load increases by 0.02 MPa each step. When p > 0.1 MPa, the load increases by 0.04 MPa each step. For 20-step loading, the final load is 0.70 MPa. Since the standard double circular load is 0.7 MPa, the load from the road surface to the top surface of the subgrade is diffused and attenuated. When it reaches the top surface of the subgrade, it is less than 0.7 MPa. Therefore, the flexible bearing plate is designed and calculated with a load of 0.7 MPa, fully meeting the requirements.
The model parameters are in Table 4. According to the previous study in this paper, stress concentration tends to occur at the edge of the rigid-flexible bearing plate. In this section, the thickness of the rubber mat gradually decreases from the edge to the center, and the thickness of the steel plate gradually increases from the edge to the center. The purpose is to reduce the stiffness of the edge part and increase the stiffness of the middle part. As shown in Figure 12, five working conditions are adopted for calculation. Compressive stress with variable thickness of steel plate and rubber mat and the distribution uniformity is shown in Figure 13.
TABLE 4. Model parameters (variable thickness).
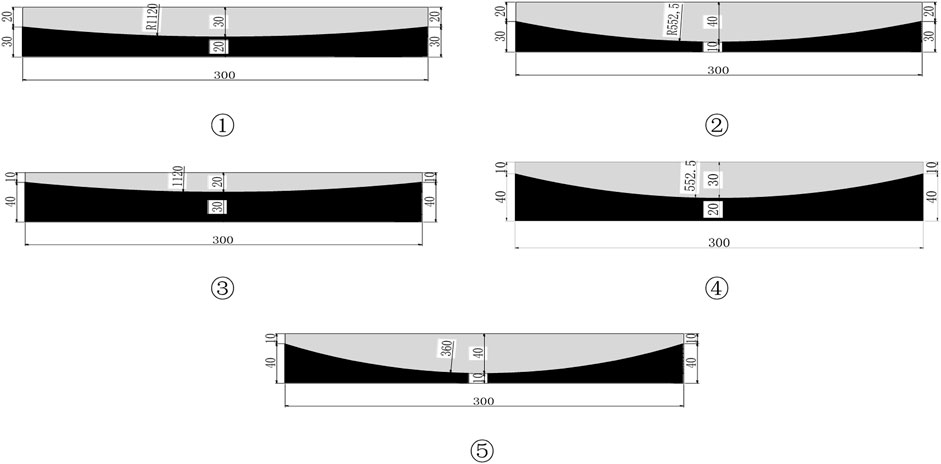
FIGURE 12. Sketch map of the rigid-flexible bearing plate with variable thickness.
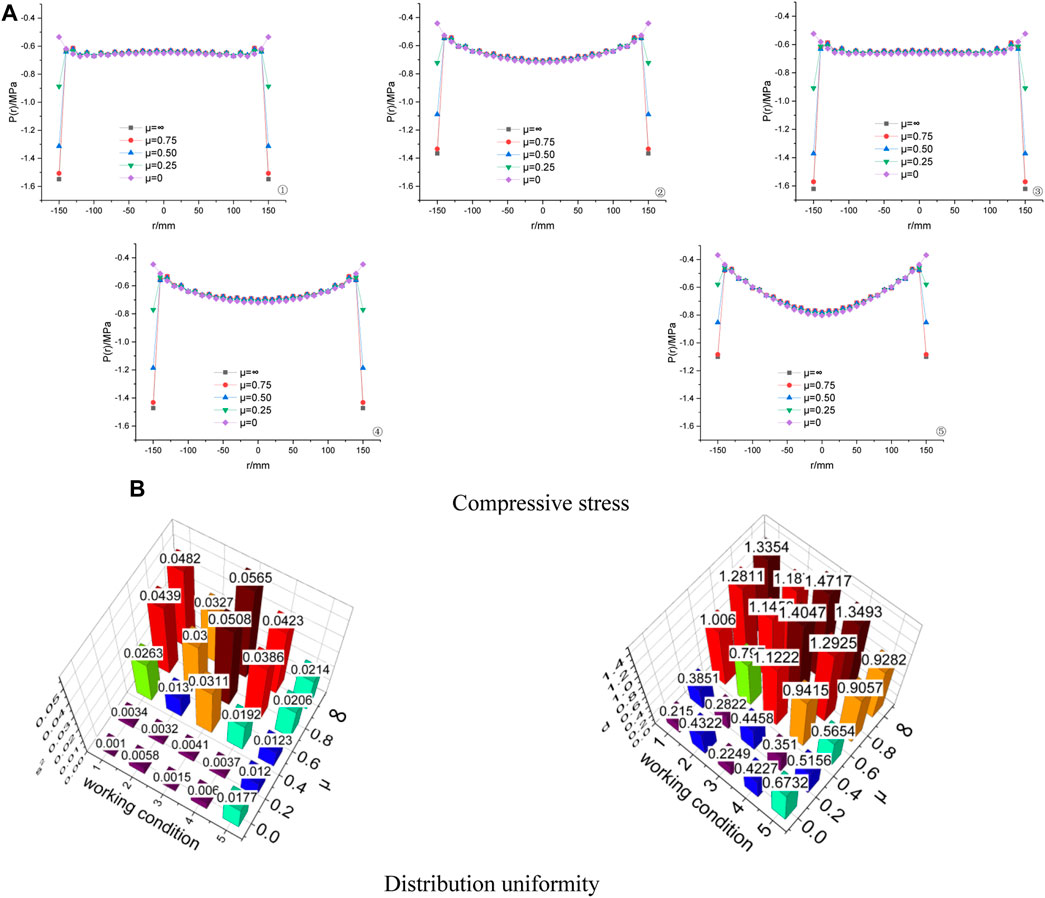
FIGURE 13. Compressive stress with variable thickness of steel plate and rubber mat and the distribution uniformity.
As shown in Figure 13A, for five different working conditions, the compressive stress at the bottom edge decreases with the decrease of μ. For the center point of the bearing plate, the compressive stress of ⑤ is the largest. As shown in Figure 13B, when μ≥ 0.25, the distribution uniformity of compressive stress increases with the decrease of μ. For ②, ④, and ⑤, when μ is 0.25, the distribution uniformity of compressive stress is the best. For ① and ③, when the contact surface is entirely smooth, the distribution uniformity of compressive stress is the best. Among the five working conditions, the distribution uniformity of compressive stress of working condition ① is the best.
The model parameters are in Table 5. According to the previous study, stress concentration tends to occur at the edge of the rigid rigid-flexible bearing plate. In this section, Fillet design is used to reduce the stress concentration at the edge. Radii of 1 mm, 2 mm, and 4 mm are chosen for calculation. The purpose is to reduce the stiffness of the bearing plate at the edge position. The sketch map is shown in Figure 14. Compressive stress with different fillet radius(R) of rubber mat and the distribution uniformity is shown in Figure 15.
TABLE 5. Model parameters (chamfer of rubber mat).
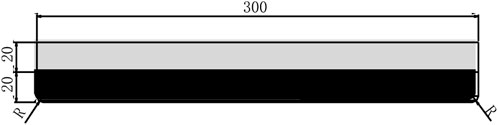
FIGURE 14. Sketch map of the fillet at the bottom edge of the rigid-flexible bearing plate.
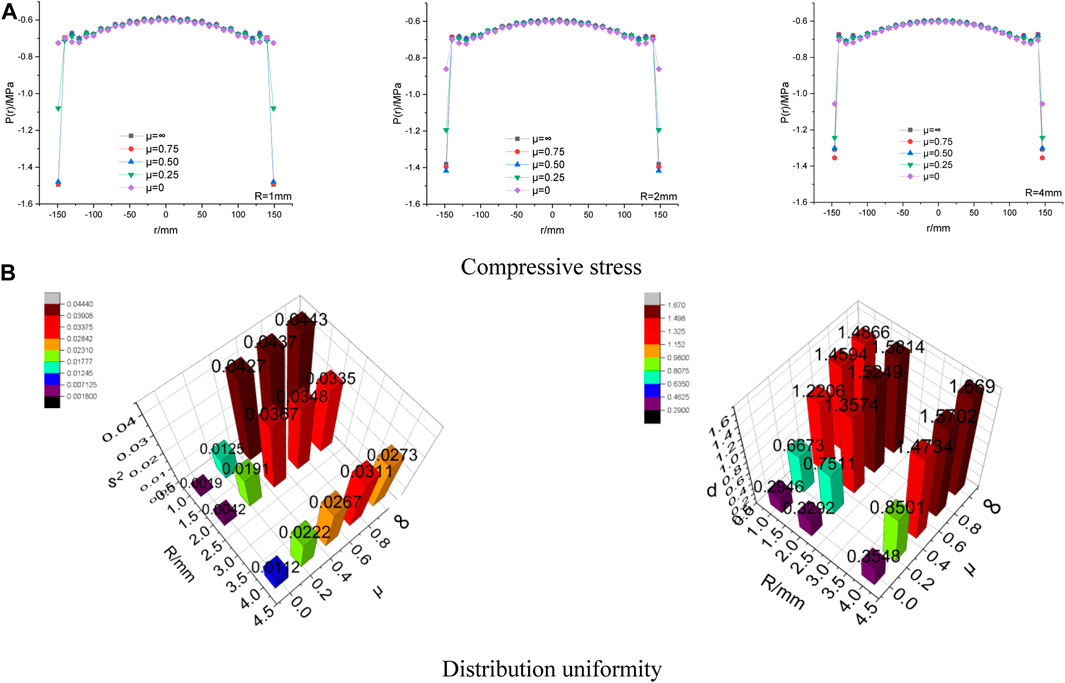
FIGURE 15. Compressive stress with different fillet radius(R) of rubber mat and the distribution uniformity.
As shown in Figure 15A, at the edge of the rigid-flexible bearing plate, when μ≥ 0.5, the compressive stress at the edge of the rigid-flexible bearing plate changes small. When μ≤ 0.5, the compressive stress at the edge of the rigid-flexible bearing plate decreases with the decrease of μ. As shown in Figure 15B, for three different filleting radii, the distribution uniformity of compressive stress decreases with the increase of μ. When μ≥ 0.5, the distribution uniformity of compressive stress increases with the increase of fillet radius. When≤0.25, the distribution uniformity of compressive stress decreases with the increase of fillet radius. In a flexible bearing plate design, the friction between the bearing plate and the subgrade should be as small as possible. The distribution uniformity of rigid-flexible bearing plate with a fillet radius of 1 mm is the best.
Based on this paper’s research results, this section intends to adopt working condition ①, a rubber mat with a fillet radius of 1 mm for research. Compressive stress with different friction coefficients and the distribution uniformity is shown in Figure 16.
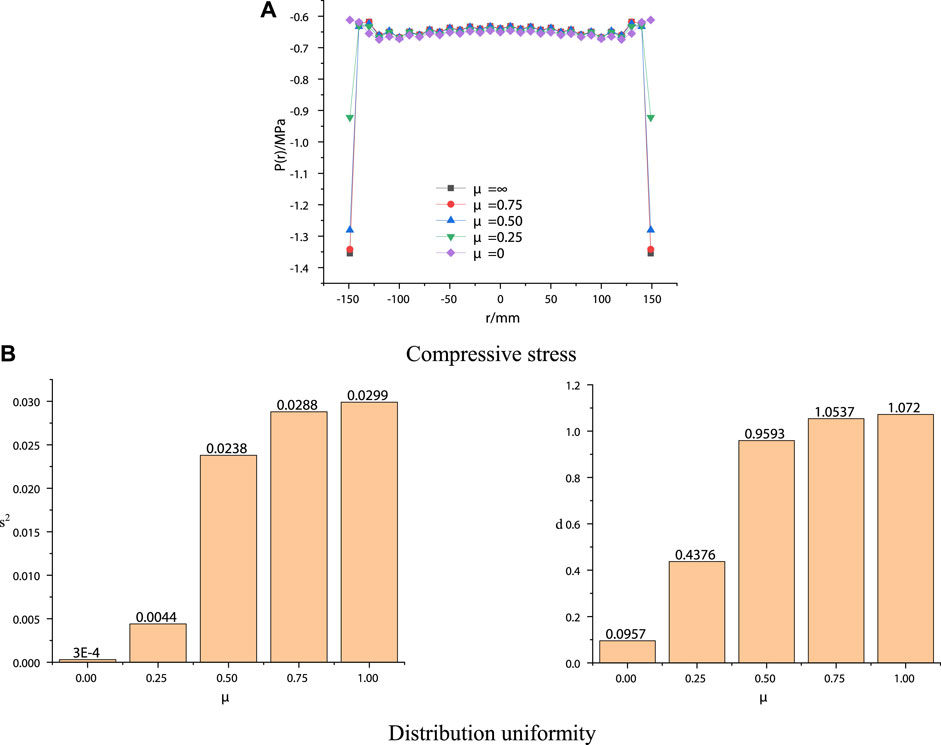
FIGURE 16. Compressive stress with different friction coefficients and the distribution uniformity.
As shown in Figure 16A, the compressive stress at the bottom edge decreases with the decrease of μ. As shown in Figure 16B, the distribution uniformity of compressive stress increases with the decrease of μ. When μ≤ 0.25, the distribution uniformity of compressive stress is good. The ratio of the compressive stress at the edge of the bearing plate to the center of the bearing plate is within 1.5 times.
When the bearing plate is used in testing, lubricants are used to control μ within 0.2. Compressive stress with different low friction coefficients and the distribution uniformity is shown in Figure 17.
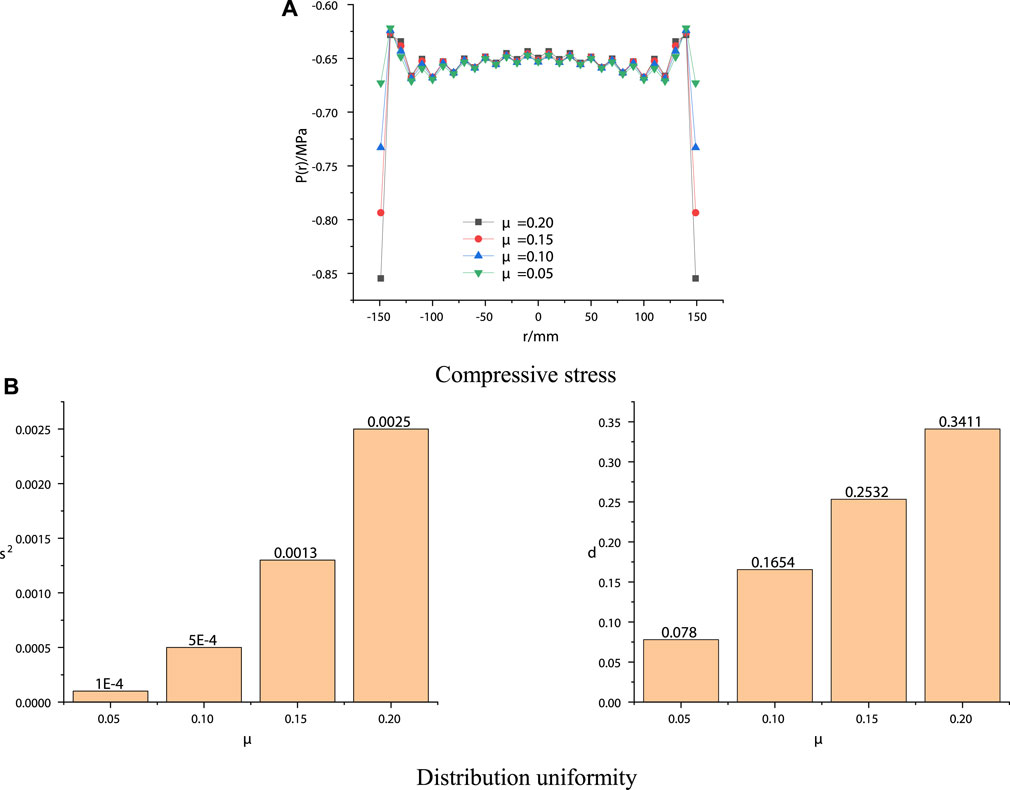
FIGURE 17. Compressive stress with different low friction coefficients and the distribution uniformity.
As shown in Figure 17A, under the condition of a low friction coefficient, the compressive stress at the bottom edge decreases with the decrease of μ. As shown in Figure 17B, the distribution uniformity of compressive stress increases with the decrease of μ. When μ is 0.05, the distribution uniformity of compressive stress is the best, the variance of the compressive stress is 0.0001, the degree of mean deviation is 0.0780, is very close to the uniformly distributed load, fully meets the requirements of engineering precision.
As shown in Figure 18, the Distribution uniformity of compressive stress of ideal rigid bearing plate is terrible. The Distribution uniformity of compressive stress of the flexible bearing plate design in this paper is excellent.
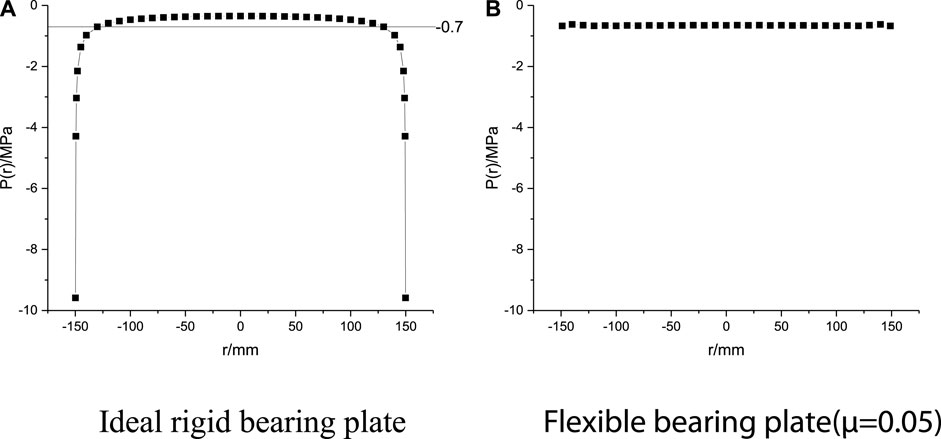
FIGURE 18. Comparison diagram.
In this paper, by studying the compressive stress of the rigid bearing plate and the rigid-flexible bearing plate, a flexible bearing plate was designed. The following conclusions can be drawn from this study.
(1) For the rigid bearing plate, when the radius is 150mm, and the thickness reaches 20 mm, the thickness of the steel plate continues to increase, which has little effect on the stress distribution. From the point of economy and application, the steel plate’s thickness of 20 mm is the most appropriate. The analysis results are consistent with the standard bearing plate size.
(2) The smaller the elastic modulus of the rubber mat is, the better the distribution uniformity of the compressive stress is. The elastic modulus of natural rubber is small and is suitable for use in a flexible bearing plate. The larger the rubber mat’s thickness is, the better the distribution uniformity of the compressive stress is. From the angle of engineering, it is unreasonable to design a flexible bearing plate by increasing the thickness of the rubber mat. It is recommended that the thickness of the rubber mat be between 20 mm and 30 mm.
(3) Friction coefficient significantly influences the distribution uniformity of compressive stress. The greater μ is, the worse the distribution uniformity of compressive stress is. During outdoor testing, lubricant should be used to ensure the friction coefficient is as tiny as possible.
(4) In this paper, the methods of the variable thickness rubber mat and steel plate, circle fillet of the rubber mat at the bottom edge are used to design of a flexible bearing plate. The results show that the distribution uniformity of compressive stress is excellent when the friction coefficient is small.
(5) Based on the results of this paper, in the future, a flexible bearing plate can be manufactured to be used in outdoor testing. The stress sensor detects the distribution and compares it with the design value.
(6) The conclusion of this paper are based on numerical simulation results, and further experimental studies will be conducted in the future.
The data analyzed in this study is subject to the following licenses/restrictions: the restrictions can be received form the corresponding author. Requests to access these datasets should be directed to emd6QHN0dS5jc3VzdC5lZHUuY24=.
Conceptualization: GH; methodology: GZ; validation: GZ and NZ; formal analysis: GH and GZ; investigation: GH and NZ; resources: NZ and GH data creation: GH and GZ; writing: GH and GZ; writing—review and editing: NZ and GZ; visualization: GH and GZ; supervision: NZ; project administration: GZ; funding acquisition: GH. All authors contributed to the article and approved the submitted version.
This work was supported by National Natural Science Foundation of China(51578081 and 51608058), The Inner Mongolia Autonomous Region Traffic and Transportation Department Transportation Projects of Science and Technology(HMJSKJ-201801), Technological Innovation Projects of Enterprises in Wuhan(2019zkhx111 and 2020020602012145).
The authors declare that the research was conducted in the absence of any commercial or financial relationships that could be construed as a potential conflict of interest.
All claims expressed in this article are solely those of the authors and do not necessarily represent those of their affiliated organizations, or those of the publisher, the editors and the reviewers. Any product that may be evaluated in this article, or claim that may be made by its manufacturer, is not guaranteed or endorsed by the publisher.
A Rashid, A. S., Black, J. A., Kueh, A. B. H., Mohamad, H., and Md Noor, N. (2017). Bearing capacity charts of soft soil reinforced by deep mixing. Proc. Inst. Civ. Eng. - Ground Improv. 170, 12–25. doi:10.1680/jgrim.15.00008
Beer, D. (1970). Experimental determination of the Shape factors and the bearing capacity factors of sand. Geotechnique 20, 387–411. doi:10.1680/geot.1970.20.4.387
Cao-Rial, M. T., Moreno, C., and Quintela, P. (2020). Determination of Young modulus by using Rayleigh waves. Appl. Math. Model. 77, 439–455. doi:10.1016/j.apm.2019.07.051
Chindaprasirt, P., Sriyoratch, A., Arngbunta, A., Chetchotisak, P., Jitsangiam, P., and Kampala, A. (2022). Estimation of modulus of elasticity of compacted loess soil and lateritic-loess soil from laboratory plate bearing test. Case Stud. Constr. Mater. 16, e00837. doi:10.1016/j.cscm.2021.e00837
Degu, D., Fayissa, B., Geremew, A., and Chala, G. (2022). Investigating causes of flexible pavement failure: A case study of the bako to nekemte road, oromia, Ethiopia. J. Civ. Eng. Sci. Technol. 13, 112–135. doi:10.33736/jcest.4332.2022
Fentaw, M., Alemayehu, E., and Geremew, A. (2021). Experimental study of stabilization of expansive soil using the mixture of marble dust, rice husk ash and cement for sub-grade road construction: A case study of woldia town. J. Civ. Eng. Sci. Technol. 12, 141–159. doi:10.33736/jcest.3977.2021
George, V., and Kumar, A. (2020). Effect of soil parameters on modulus of resilience based on portable falling weight deflectometer tests on lateritic sub-grade soils. Int. J. Geotech. Eng. 14, 55–61. doi:10.1080/19386362.2017.1403075
Guo, D., and Feng, D. (2001). Mechanics of layered elastic systems. Harbin, China: Harbin Institute of Technology Press.
Hossain, Md.B., Roknuzzaman, Md., Biswas, Md.A., and Islam, M. (2021). Evaluation of engineering properties of thermal power plant waste for subgrade treatment. J. Civ. Eng. Sci. Technol. 12, 112–123. doi:10.33736/jcest.3975.2021
Zhang, J. G., Zhang, Q. Y., Yang, W. D., and Zhang, Y., Study on center hole deformation test of rigid bearing plate, Adv. Mater. Res. (2008) 1187–1194. doi:10.4028/www.scientific.net/AMR.33-37.1187
Kaya, Z., Erken, A., and Cilsalar, H. (2021). Characterization of elastic and shear moduli of adapazari soils by dynamic triaxial tests and soil-structure interaction with site properties. Soil Dyn. Earthq. Eng. 151, 106966. doi:10.1016/j.soildyn.2021.106966
Khafizov, R. M. (2006). Stress-strain state of a frozen soil bed under a rigid plate. Soil Mech. Found. Eng. 43, 1–7. doi:10.1007/s11204-006-0014-6
Li, Y., Yin, R., and Zheng, J. (1992). Back-calculating compressive elastic moduli of multilayer pavement by the test of rigid loading plate. J. Chang. Commun. Inst. 08, 13–18.
Liu, G., Xu, N., Wu, T., and Li, X. (2014b). Application of capacitance water level sensor in flexible bearing board test. SHANXI Archit. 40, 46–48. doi:10.13719/j.cnki.cn14-1279/tu.2014.16.029
Liu, S., Cao, W., Li, Y., and Fang, J. (2014a). Key technique and new calculating method for resilient modulus of subgrade measured by bearing plate. China J. Highw. Transp. 27, 23–29. doi:10.19721/j.cnki.1001-7372.2014.01.004
Ma, B., and Shi, H. (2006). Research on ameliorative method for testing subgrade rebound modulus by bearing plate. HIGHWAY 12, 146–150.
Mendoza, C., and Caicedo, B. (2019). Elastoplastic framework of relationships between CBR and Young’s modulus for fine grained materials. Transp. Geotech. 21, 100280. doi:10.1016/j.trgeo.2019.100280
Nozomu, K., Shota, M., Takeshi, K., and Eisuke, S. (2018). Direct shear test on reinforced slope model by soil nailing with flexible bearing plates. Geosynth. Eng. J. 33, 183–190. doi:10.5030/jcigsjournal.33.183
Rezaei, M., Ghafoori, M., and Ajalloeian, R. (2018). Effects of stress value and loading plate dimensions on in-situ deformation modulus of rock mass in plate loading test. J. Aalytical Numer. Methods Min. Eng. 8, 95–106. doi:10.29252/anm.8.16.95
Salamatpoor, S., and Salamatpoor, S. (2014). Evaluation of babolsar sand behaviour by using static triaxial tests and Comparison with case history. Open J. Civ. Eng. 04, 181–197. doi:10.4236/ojce.2014.43016
Shi, H. (2011). Research on test method for modulus of resilience bearing plates on highway soil roadbed. Technol. Highw. Transp. 08, 1–4+13.
Huang, S., Ding, X., He, J., and Xiong, S. (2020). Analytical solution for rock mass bearing plate rheological tests based on a novel viscoelastic combination model. Eur. J. Environ. Civ. Eng. 26. doi:10.1080/19648189.2020.1796819
Transport, R. I. O. H. M. O. (2019). Field test methods of highway subgrade and pavement. Ind. Stand.-Transp.
Transport, R. I. O. H. M. O. (1986). Revision of highway flexible pavement design specification. Ind. Stand.-Transp.
Transport, R. I. O. H. M. O. (2017). Specifications for design of highway asphalt pavement. Ind. Stand.-Transp.
Ueshita, K., Yoshikane, T., and Tamano, T. (1973). Analysis of pavement structures measured by core boring and the benkelman beam test. Proc. Jpn. Soc. Civ. Eng. 1973, 17–25. doi:10.2208/jscej1969.1973.214_17
Wang, J. (1990). Stresses and displacements produced in a semi-infinite elastic by rigid circular bearing plate. J. Chongqing Jiaot. Inst. 09, 95–106.
Xu, N., Wu, T., Feng, Q., Wang, K., and Shao, W. (2017). Research on flexible bearing plate test for deformation modulus of soil. Rock Soil Mech. 38, 496–500.
Xu, N., Wu, T., Pi, H., You, L., and Wu, Y. (2018). Inversion of shear strength of soil based on flexible bearing plate loading test. Rock Soil Mech. 39, 227–234. doi:10.16285/j.rsm.2018.0440
Yamamoto, E., Kondner, R. L., and Krizek, R. J. (1967). Load-deflection response of layered flexible pavement sections under rigid bearing plates. Soils Found. 7, 1–19. doi:10.3208/sandf1960.7.2_1
Yang, X., Xu, N., Yin, Y., and Fang, N. (2014). The application of inductive displacement sensor in flexible bearing plate load test. Shanxi Archit. 40, 56–57. doi:10.13719/j.cnki.cn14-1279/tu.2014.16.029
Zhang, W., Chen, B., Xiao, L., Liu, J., and Deng, X. (2018). Experimental study and evaluation methodlogy of foundation coefficients for two-parameter foundation model based on rigid plate loading tests. J. Hunan Univ. Sci. 45, 122–129. doi:10.16339/j.cnki.hdxbzkb.2018.09.014
Zhao, W., Yang, Q., Wu, W., and Liu, J. (2022). Structural condition assessment and fatigue stress analysis of cement concrete pavement based on the GPR and FWD. Constr. Build. Mater. 328, 127044. doi:10.1016/j.conbuildmat.2022.127044
Keywords: bearing plate, rubber mat, distribution uniformity, flexibility, finite element method
Citation: Hou G, Zheng G and Zhang N (2023) A flexible bearing plate based on steel plate and rubber mat. Front. Mater. 10:1196989. doi: 10.3389/fmats.2023.1196989
Received: 30 March 2023; Accepted: 10 May 2023;
Published: 30 May 2023.
Edited by:
Ramadhansyah Putra Jaya, Universiti Malaysia Pahang, MalaysiaReviewed by:
Syahrul Fithry Senin, Universiti Teknologi Teknologi MARA, MalaysiaCopyright © 2023 Hou, Zheng and Zhang. This is an open-access article distributed under the terms of the Creative Commons Attribution License (CC BY). The use, distribution or reproduction in other forums is permitted, provided the original author(s) and the copyright owner(s) are credited and that the original publication in this journal is cited, in accordance with accepted academic practice. No use, distribution or reproduction is permitted which does not comply with these terms.
*Correspondence: Guozhi Zheng, emd6QHN0dS5jc3VzdC5lZHUuY24=
Disclaimer: All claims expressed in this article are solely those of the authors and do not necessarily represent those of their affiliated organizations, or those of the publisher, the editors and the reviewers. Any product that may be evaluated in this article or claim that may be made by its manufacturer is not guaranteed or endorsed by the publisher.
Research integrity at Frontiers
Learn more about the work of our research integrity team to safeguard the quality of each article we publish.