
94% of researchers rate our articles as excellent or good
Learn more about the work of our research integrity team to safeguard the quality of each article we publish.
Find out more
ORIGINAL RESEARCH article
Front. Mater., 05 May 2023
Sec. Biomaterials and Bio-Inspired Materials
Volume 10 - 2023 | https://doi.org/10.3389/fmats.2023.1169945
 Umar Nishan1*
 Sajida Rehman1
 Riaz Ullah2
 Ahmed Bari3
 Saifullah Afridi1
 Mohibullah Shah4
 Jibran Iqbal5Muhammad Asad1Amir Badshah1Naeem Khan1In Min Hwang6Hameed Ullah Khan1Nawshad Muhammad7*
Nitrite (NO2−) and nitrate (NO3−) are frequently used in cured meat products as preservatives, as they give a better taste and work well in color fixation. As a key possible carcinogen, excessive dietary consumption of NO2− in cured meat products would be bad for health. Herein, copper oxide nanoparticles (CuO NPs) were synthesized using the drug Augmentin as a reducing and capping agent. The desired synthesis of CuO NPs was confirmed by various characterization techniques, including UV–visible spectroscopy, Fourier transform infrared spectroscopy, energy-dispersive X-ray spectroscopy, thermal gravimetric analysis, X-ray diffraction, and scanning electron microscopy. The new approach of drug-mediated acetic acid-capped CuO NPs was developed for simple colorimetric detection of nitrite ions in a mimic solution of processed food. The color of the detection system changes from brown to yellow with the increase in the concentration of NO2− and has been observed with the naked eye. The selectivity of the NO2− detection system by the UV–visible spectrum and the naked eye is compared to other ions, such as Br−, I−, Cl−1, PO4−3, CO32−, and SO42−. The platform was successfully employed for the determination of nitrite in real samples. Moreover, this probe can be used for the sensitive detection of NO2− with a linear range of 1 × 10⁻⁸ to 2.40 × 10⁻⁶ M, a detection limit of 2.69 × 10⁻⁷ M, a limit of quantification 8.9 × 10⁻⁷ M, and a regression coefficient (R2) of 0.997. Our results suggest that this sensor can be used for on-site analysis and quantification as well as in the fields of disease diagnosis, environmental monitoring, and food safety.
Among nitrogen-containing inorganic ions, three ions, i.e., NH4+, NO2−, and NO3−, in the environment are essential nutrients for the growth of plants and in the food industry (Flores and Toldrá, 2021). Sodium and potassium salts of nitrite and nitrate have long been used in the meat industry as food preservatives. They work by prolonging the shelf life of processed meat, giving it a better taste, and fixing its color (Majou and Christieans, 2018). Nitrite is more frequently detected in groundwater than in surface water. Livestock waste, artificial fertilizers, and erosion of natural deposits are its main sources (Greer et al., 2005). The Environmental Protection Agency (EPA) of the United States has defined the maximum contamination level (MCL) of nitrite in drinking water and food products to be 21.7 mM (Ozdestan and Uren, 2010) and 125 mg/kg, respectively (Singh et al., 2019). The excess intake of NO2− reported different medical issues, such as birth defects and methemoglobinemia, commonly known as blue baby syndrome (Brender, 2020), affecting the nervous system (Wang et al., 2016), spleen, and kidneys, and also causing esophageal cancer (Ozdestan and Uren, 2010). Due to the strong reactivity of nitrite, rapid and accurate analytical techniques are required to reduce human health risks. It is vital to identify and monitor the NO2− concentration of food products and environmental, organic, and inorganic samples.
Carboxylic acids are the most common organic compounds and belong to the class of green solvents, possessing no or low toxicity and being relatively inexpensive (Teles et al., 2017). They have significant applications in the petrochemical, food, dye, and stabilizer industries, as well as in nanotechnology (Odedairo et al., 2013). In addition to stabilizing nanoparticles, they can also affect the solubility, reactivity, size, and shape of nanoparticles, as well as the surface modification of nanostructures (Sarkar et al., 2005). Carboxylic acids are used as stabilizers because they can easily coordinate with the surface of nanoparticles (Hosseini-Monfared et al., 2015). Moreover, the functionalization of nanoparticles with the carboxylic group produces more active sites for sensing (Sáenz-Galindo et al., 2018).
Numerous methods have been employed to detect nitrite, such as chromatographic (Lim et al., 2022), chemiluminescence (Basu et al., 2022), electroanalytical (Gao et al., 2020), and spectrophotometric methods (Karrat et al., 2022). However, the aforementioned analytical techniques have some limitations when used on a daily basis for nitrite detection. Due to complicated sample preparation procedures, expensive and complicated instruments, and highly trained operators, these techniques have become undesirable in laboratories, especially with limited financial resources. Therefore, it is desirable to develop such techniques, which could be more efficient, more fruitful, and less expensive. Usually, scientists try to translate the analyte signals into colors, which can be easily detected with the naked eye. A very simple and cheap colorimetric sensor is particularly attractive for nitrite detection in food and water samples (Zhang et al., 2012). Simple, cost-effective design, and quick response are the cornerstones of colorimetric sensors (Nishan et al., 2021a). Prior to becoming a bulky and complicated device, a sensor’s various functional components, such as the transducer, recycling unit, and discovery unit, were crucial to a delayed detector response (Cheng et al., 2014). Recently, electrocatalyst materials have played important roles in colorimetric sensors due to their desirable characteristics, including strong surface plasmon resonance and distance-dependent optical properties, as well as the fact that their performance events may be seen with the naked eye (Nishan et al., 2021b). Currently, a number of electrocatalytic materials, including metallic oxides, carbon nanomaterials, and metal nanomaterials, have been employed to create nitrite sensors (Lin et al., 2011; Wang et al., 2014).
For the colorimetric detection of nitrite, various nanomaterials have been reported, such as Au NPs-rGO (Amanulla et al., 2017), Ag/Au NPs (Li et al., 2015), MTT-G NPs (Nam et al., 2014), Au NPs (Ye et al., 2015), Er2O3 NPs@RGO (Rajaji et al., 2019), Fe3O4@SiO2/Au magnetic nanoparticles (Chen et al., 2016), shell-isolated nanoparticles (Zhang et al., 2013), Pd NPs (Pourreza and Abdollahzadeh, 2019), Ag NPs (Kumar and Anthony, 2014), Fe3O4/MWCNTs (Qu et al., 2015), AuNP–CeO2 NP@GO (Adegoke et al., 2021), and MnO2 NPs (Nishan et al., 2022). Compared to different inorganic oxides, such as V2O5, NiO, and Co3O4, copper oxide nanoparticles (CuO NPs) have gained much attention because of their low cost, availability, and lack of toxicity (Jaiswal et al., 2017). CuO NPs are exceptional materials for the optical detection of nitrite due to their surface plasmon properties.
The current research reports the drug-mediated production of CuO nanostructures via using the Augmentin drug as a reducing and stabilizing agent. It is the first study on the production of CuO NPs via drug-mediated means without the need for any additional reduction agents. Furthermore, to overcome the problem of agglomeration of the nanoparticles and the availability of surface area for reactions, acetic acid has been employed as a deagglomerating and capping agent. The platform of acetic acid-capped CuO NPs has been successfully used as a colorimetric sensor for the detection of nitrite. Comprehensive optimization of various parameters, such as loading of nanoparticles, pH, reaction time, and concentration of nitrite, was carried out. The sensing platform was also successfully applied to real samples.
All the required chemicals, including acetic acid (CH3COOH, 98.4%), copper sulfate (CuSO4, 99.4%), and sodium nitrite (NaNO2, 98.2%), were analytical-grade reagents and were purchased from Sigma-Aldrich, and 1 g of Augmentin drug tablets (GSK) were purchased from a local medical store.
An FTIR spectrometer (Agilent Technologies, Danbury, Connecticut, United States) was used to observe the characteristic peaks of CuO NPs. Samples were analyzed for their thermal stability by simultaneous thermal analysis (STA) (PerkinElmer, Waltham, Massachusetts, United States) and thermal gravimetric analysis (TGA) at temperatures ranging from 30°C–800°C. An energy-dispersive X-ray spectrometer (EDX) (Model JSM 6390) was used for the confirmation of the chemical composition of the synthesized CuO NPs (SEM–EDS) with a TESCAN VEGA (LMU) SEM with INCAx-act (Brno, Czech Republic). X-ray diffraction was used for the analysis and phase identification of CuO NPs (Shimadzu, Kyoto, Japan, LabX XRD-6100) with Cu-Kα radiation at a scan range of 10°C–80°C. Absorption spectra were measured through UV–visible spectroscopy (Agilent Shimadzu, UV-1800, Kyoto, Japan).
Two 1 g Augmentin tablets were mechanically ground into a fine powder, and 50 mM of Augmentin solution was prepared (50 mL) in distilled water followed by filtration. The clear filtrate was added to the 50 mM copper nitrate solution dropwise for 5 h under stirring, and the solution was centrifuged for 15 min at 4,000 rpm at 4°C. The prepared nanoparticles were kept in an oven for drying at 50°C for 4 h. The dried nanoparticles were kept in an Eppendorf tube at room temperature for further use (Nishan et al., 2020; Asad et al., 2022).
Copper oxide nanoparticles were coated with acetic acid. Acetic acid has been used as a dispersion medium and stabilizing agent to avoid the agglomeration of the nanoparticles. In this process, 1 mL of acetic acid and 6 mg of copper oxide nanoparticles were combined and stirred for 30 min with a glass rod for uniform dispersion. The acquired mixture of copper oxide nanoparticles coated with acetic acid was stored and used for the colorimetric detection of nitrite. One of the methods used is to cover colloids with a protective agent that may be bound to the surface of the particles in order to keep the nanoparticles suspended and, thus, prevent aggregation (Deng et al., 2013).
For the colorimetric detection of nitrite ions, the reaction was conducted at ambient temperature and in acidic media. For the proposed assay, 100 μL of nitrite solution (2.4 × 10⁻⁶ M) and 100 μL of CH3COOH-capped copper oxide nanoparticles were taken in an Eppendorf tube at room temperature. After the addition of nitrite solution, the brown color of the acetic acid-coated copper oxide nanoparticles changed into a light yellow color. The proposed assay response was observed with the naked eye and also assessed using a UV–Vis spectrophotometer.
Prior to the investigation of the potential sensing application of the proposed CuO NPs, it was characterized by the following techniques.
The UV–visible spectrum of the synthesized CuO NPs is shown in Figure 1. The recorded main peak at 350 nm is consistent with the literature-reported values of corresponding CuO NPs (Fernández-Arias et al., 2020).
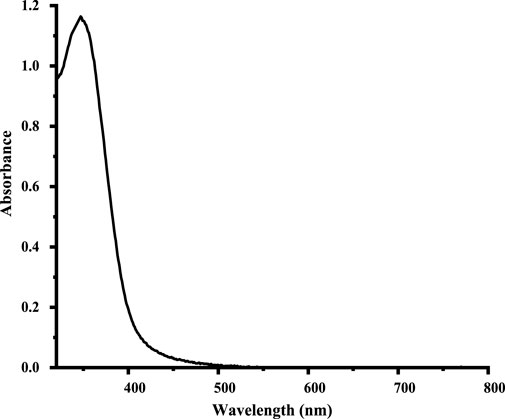
FIGURE 1. UV–visible spectrum of the synthesized CuO NPs.
The produced nanoparticles’ FTIR spectrum is depicted in Figure 2. FTIR confirms the existence of various functional groups. The broad band in the region of 3,238–2,500 cm−1 indicated the presence of the OH group of the carboxylic group. The band at 1,592 cm−1 is assigned to the C–O stretching vibrations of the carboxylic group. The 1,242 cm−1 and 1,373 cm−1 absorption band regions were assigned to C–N bending vibration and S = O stretching, respectively. The absorption band in the 655 cm−1 region indicated a Cu–O stretching vibration, confirming the formation of CuO NPs (Ethiraj and Kang, 2012).
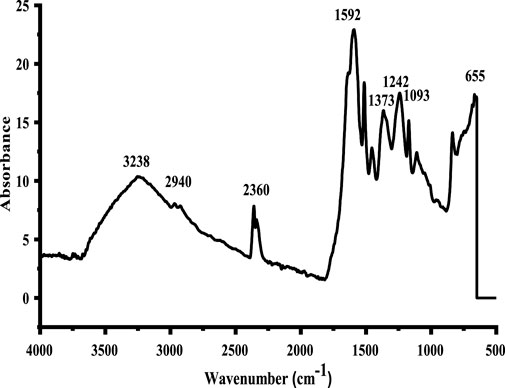
FIGURE 2. FTIR spectrum of the CuO NPs.
The XRD pattern shows the high crystalline nature of the drug-induced CuO NPs with prominent sharp peaks, as shown in Figure 3. The diffraction peaks ascribed to the Miller indices 110, 111, 200, 220, 311, and 222.68 at 2ϴ are 29.86°C, 36.58°C, 42.60°C, 61.84°C, 73.85°C, and 77.68°C. The XRD analysis shows the peculiar purity of CuO NPs with no additional peaks. By using the Debye–Scherrer equation, the average crystalline size of CuO NPs is 22 nm. The findings were intimately associated with the results for nanoparticles of cuprous oxide (Shi et al., 2019).
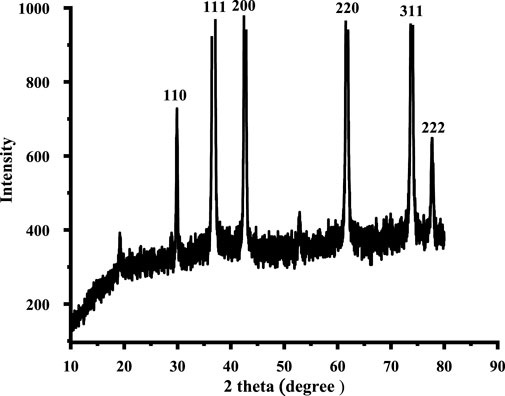
FIGURE 3. XRD pattern of the synthesized CuO NPs.
Figure 4 displays the produced nanoparticles’ EDX spectrum. The EDX of the copper oxide nanoparticles spectrum indicates that the weight composition of copper and oxygen is 87.2% and 12.72%, respectively. The EDX spectrum with no other peak reflects the high purity of the synthesized copper oxide nanoparticles. The elemental analysis is shown in Table 1. The EDX results are in good conformity with the available literature for CuO nanoparticles (Hosseini-Koupaei et al., 2019).
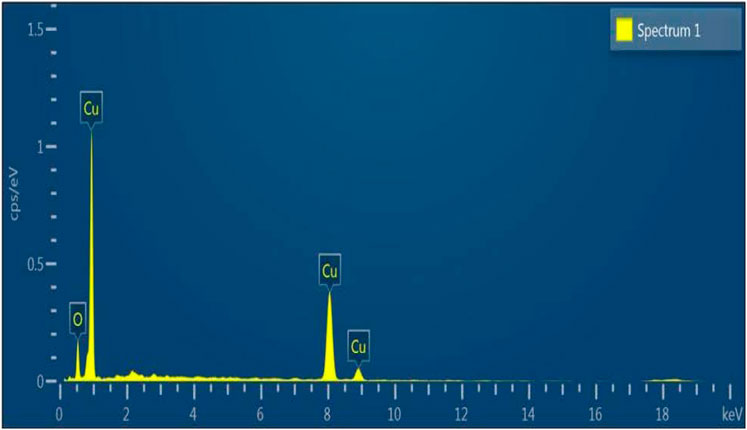
FIGURE 4. EDX analysis of the synthesized CuO NPs.

TABLE 1. EDX analysis.
The thermal stability of the copper oxide nanoparticles was confirmed by TGA, as shown in Figure 5. The first TGA curve between 100°C–150°C curve shows a 0.7 percent loss in weight, indicating the loss of water, while the loss of organic moieties is in the range of 170°C–250°C, with a weight loss of 2.7 percent. Owing to the surface oxidation reactions taking place in the reacting atmosphere, the curve also shows weight gain in the sample (Loganathan et al., 2017).
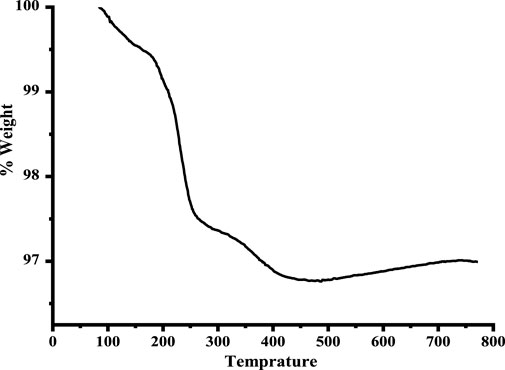
FIGURE 5. TGA investigation of the prepared CuO nanostructures.
Figure 6 shows the SEM images of the cross-section of the prepared CuO NPs. SEM images confirm the morphology of the prepared nanoparticles. The SEM images clearly show that due to the agglomeration propensity, the nanoparticles are formed in cubical, crystalline, and clustered forms and are compatible with the cited literature (Lanje et al., 2010).
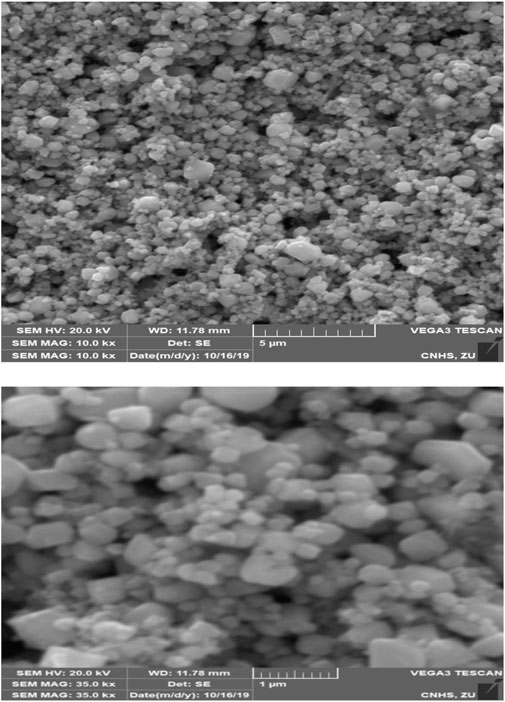
FIGURE 6. SEM photographs of the produced CuO NPs.
Acetic acid-coated CuO NPs have been used as a sensing platform for the colorimetric detection of nitrite. For the sensing of nitrite, 100 µL of CH3COOH-capped CuO nanoparticles were mixed with an equal volume (100 μL; 2.4 × 10⁻⁶ M) of sodium nitrite solution. The process was carried out at an ambient temperature, resulting in the color changing from brown to yellow after adding nitrite solution, as shown in Figure 7. The absorption spectra of the proposed assay were recorded using a UV–Vis spectrophotometer, as shown in Figure 7.
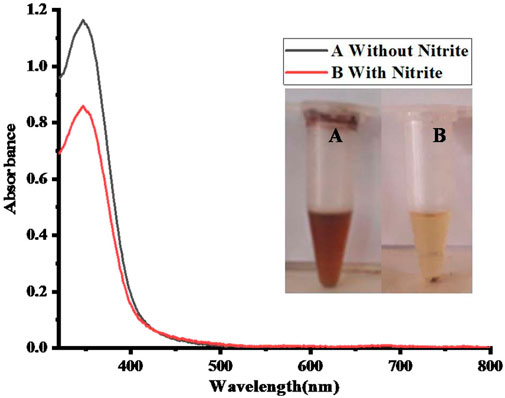
FIGURE 7. UV–Vis spectra of (A) 100 µL of CH3COOH-capped CuO nanoparticles without nitrite (B) in the presence of 100 µL of nitrite solution (2.4 × 10⁻⁶ M).
The suggested mechanism for nitrite sensing by the well-characterized acetic acid-coated CuO NPs is shown in Scheme 1. In brief, the acetic acid-coated CuO NPs reduce the sodium nitrite salt into sodium acetate and nitrite acid (as shown in reaction 1). Then, the nitrite acid is oxidized into NO and NO2 in the presence of CuO (as shown in reaction 2), resulting in the color changing to yellow.
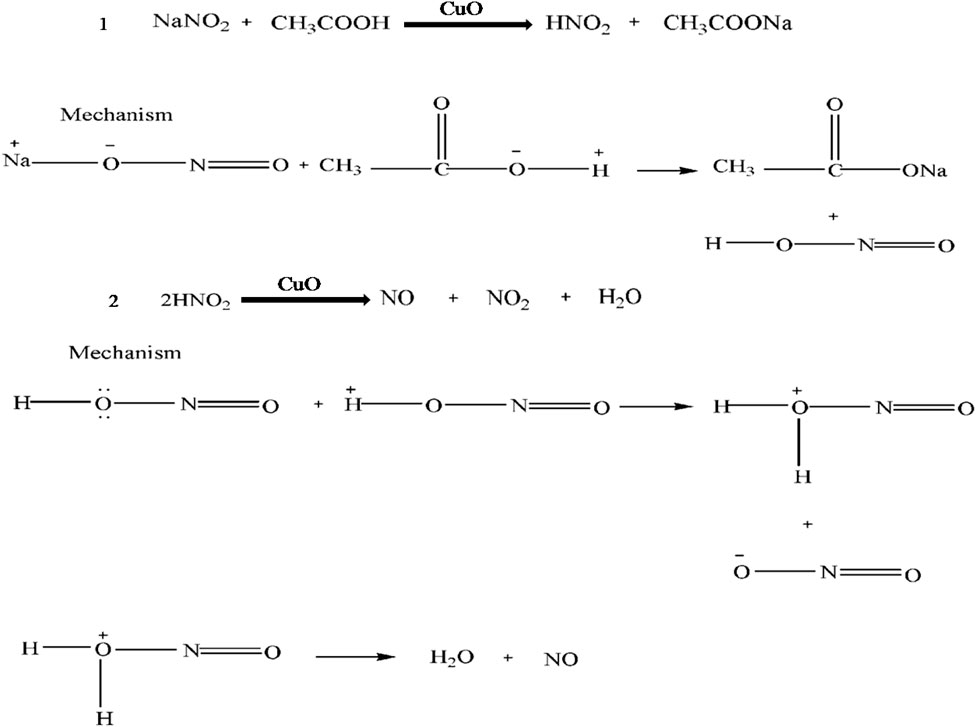
SCHEME 1. Proposed mechanism.
Normally, colloids of nanoparticles appear to aggregate in a solution. In order to keep the nanoparticles suspended and prevent them from aggregating, one of the strategies is to cover colloids with a protective agent that can be associated with the surface of the particle (Sun and Luo, 2005). Acetic acid serves as a stabilizing agent in the present work. Visual color change was observed in the colorimetric approach using copper oxide nanoparticles. To obtain the best colorimetric response of the proposed sensor, different amounts of acetic acid-capped nanoparticles (50–300 µL) were used. The color of the solution does not improve at a higher concentration of nanoparticle dispersion with 100 μL of nitrite ions (2.4 × 10⁻⁶ M); it remains brown because the analyte cannot completely bind to the surface of the nanoparticles. As the amount of dispersion decreases, the color slowly changes from brown to yellow. In nanoparticle dispersion at 100 µL, the colorimetric detection of nitrite was clearly seen by the naked eye, where the dark brown color changed to a yellow color along with the bubbles of nitric oxide gas formation. The solution of nitrite ions in 100 μL interacts promptly with the dispersion of CH3COOH-coated copper oxide nanoparticles in 100 µL, as shown in Figure 8.
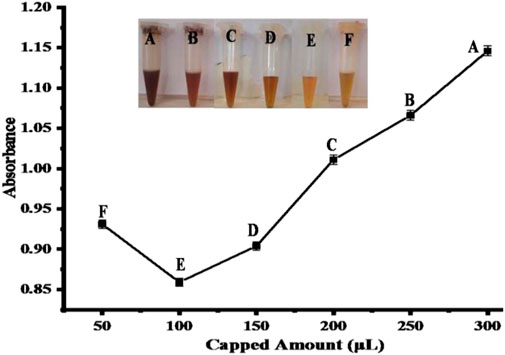
FIGURE 8. Optimization of acetic acid-capped CuO NPs in (μL). The best response was observed at point E, with reaction conditions [100 μL of capped CuO NPs and 100 μL of nitrite solution (2.40 × 10⁻⁶ M)]. Points (A-F) represents the absorbance changes in response to different amounts of capped CuO NPs.
The sensor’s response was also evaluated at different pH ranges (3–11) using standard HCl and NaOH solutions for pH calibration in the fabrication of the proposed sensor, as shown in Figure 9. The proposed sensor’s best response was observed at pH 5, which resulted in a complete color change of the mixture from brown to yellow. Therefore, pH 5 was considered optimal for the proposed sensor for further experiments. When compared to the literature, the pH value is 1.3 for the colorimetric detection of nitrite (Li et al., 2015).
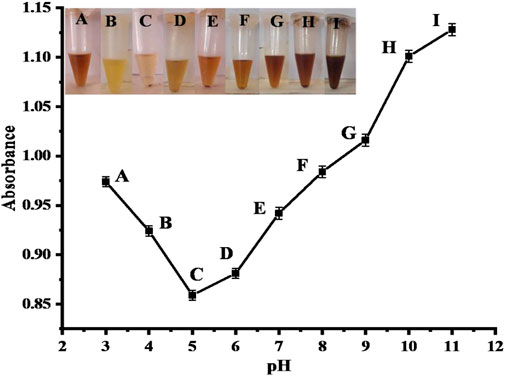
FIGURE 9. Optimization of pH. Point C (pH 5) shows a good response with [CH3COOH-coated CuO nanoparticles = 100 μL] [nitrite = 2.40 × 10⁻⁶ M (100 μL)] reaction conditions. Points (A-I) represents the absorbance changes in response to change in pH.
The optimization of time is a key factor in biosensors. To find the optimum time for the proposed sensor, the response was examined at various time intervals ranging from 1–6 min, as shown in Figure 10. The excellent response of the proposed sensor was observed at 4 min because all the available Cuo NPs were used for the sensing of nitrite at this time. After 4 min, the color completely changed from brown to yellow. So, 4 min is the optimum time for the proposed sensor for further experiments. According to the literature, the incubation time for the sensing of nitrite is 5 min (Daniel et al., 2009).
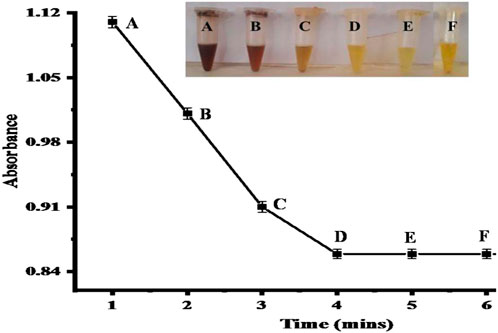
FIGURE 10. Time optimization. Point D (4 min) shows a good response with [CH3COOH-coated CuO nanoparticles = 100 μL] [nitrite = 2.40 × 10⁻⁶ M (100 μL) ] reaction mixture conditions. The inset figure displays the colorimetric changes with time. Points (A-F) represents the absorbance changes in response to change in time.
The analytical performance of the fabricated sensor is shown in Figure 11. The absorption peak of the proposed sensor gradually decreased with the increase in NO2− concentration. Under optimum conditions, with the increase in the concentration of nitrite solution, the color changes from brown to yellow, and the UV–Vis spectra are shown in Figure 11A. Using nitrite solution with a linear concentration ranging from 1 × 10⁻⁸ to 2.4 × 10⁻⁶ M at 350 nm, a drop in absorbance spectra was observed. Additionally, this probe may be utilized to accurately detect nitrate ions with a linear range of 1 × 10⁻⁸ to 2.40 × 10⁻⁶ M, with a limit of detection (LOD) of 2.69 × 10⁻⁷ M, limit of quantitation (LOQ) of 8.9 × 10⁻⁷ M, and regression coefficient (R2) of 0.997, as shown in Figure 11B. The outcomes of the suggested assay were also evaluated using previously reported colorimetric sensors for the detection of nitrite based on various nanomaterials, as shown in Table 2. For the proposed sensor, the response time was 4 min. Furthermore, the practical performance of the proposed assay was tested on meat samples. In comparison with the previously reported sensors, the analytical results obtained from our sensor were correlated and comparable to the reported nitrite sensors (Hu et al., 2019).
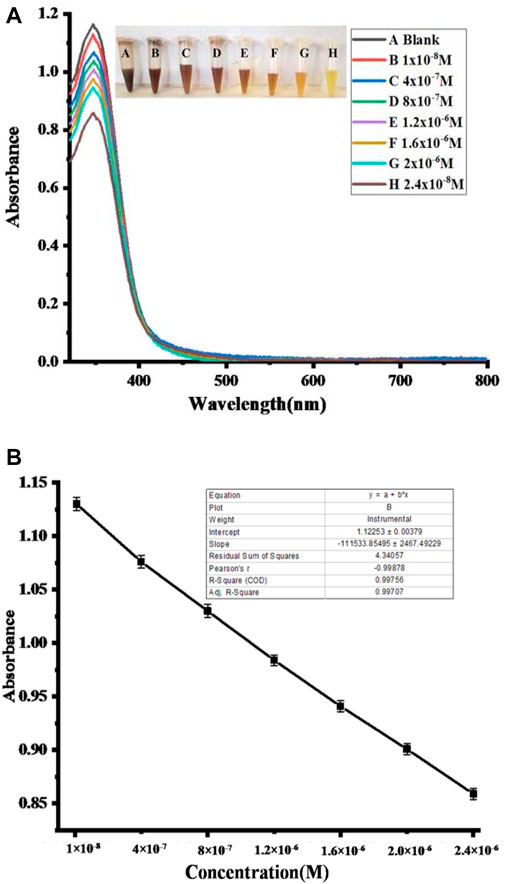
FIGURE 11. Biosensing of NO2−. (A) UV–Vis spectra and the resulting change with respect to the change in different nitrite concentrations. (B) Nitrite concentration versus absorbance calibration graph.
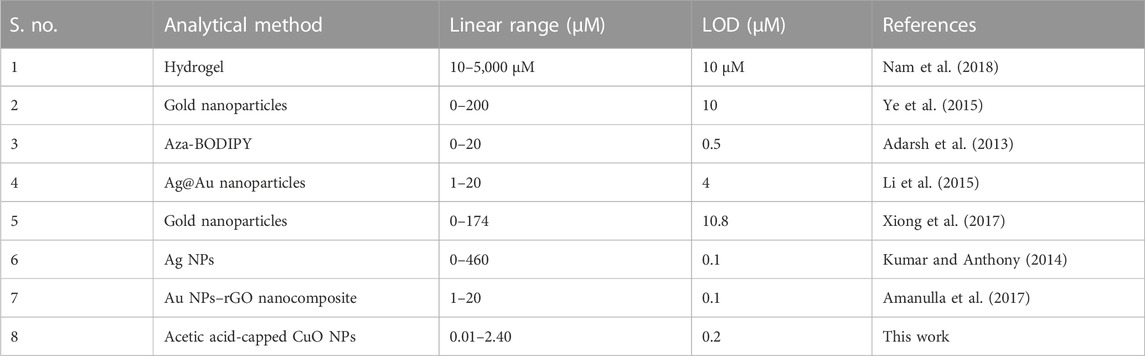
TABLE 2. Comparative analysis of the proposed assay with the previously reported studies.
The selectivity of the proposed biosensor was checked with other co-existing ions, such as SO42-, CO32-, PO43-, Cl−, I−, Br -, tar, Ca2+ and NO2−, at the same concentration of 2.40 × 10⁻⁶ M (100 μL). No colorimetric response has been observed with other ions, and only the addition of nitrite can lead to a substantial reduction in absorption at 350 nm, as shown in Figure 12. It is clearly shown that the fabricated sensor is only specific for NO2− determination, with an obvious color change from brown to yellow when other ions are present at an equivalent concentration, as shown in Figure 12. The sensitivity of acetic acid-coated copper oxide nanoparticles for nitrite detection is significantly higher. From the results, it is clear that the fabricated test can be used to detect nitrite specifically, both using UV–Visible spectra and the naked eye. The outcomes of the suggested assay were consistent with the published literature (Ye et al., 2015).
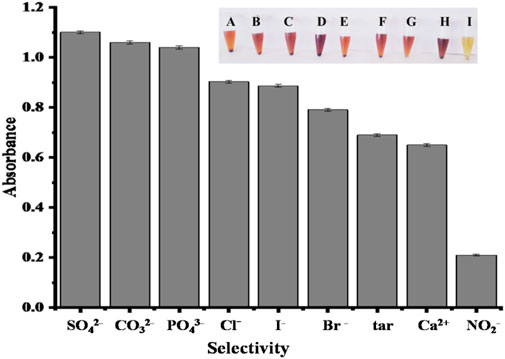
FIGURE 12. Biosensor selectivity of CH3COOH-coated CuO nanoparticles for NO2− and the fabricated sensor with other co-existing ions at the same concentration (2.40 × 10⁻⁶ M), such as SO42− (A), CO32− (B), PO43− (C), Cl− (D), I− (E), Br− (F), tar (G), Ca2+ (H), and NO2− (I), under optimum experimental conditions.
In real samples, no direct NO2− was detected. The proposed sensor was alternatively tested by the recovery of spiked NO2− solution, and standard additions, such as 0.54, 0.97, and 2.7 μM, are spiked into real samples of meat solution, as can be seen in Figure 13. It indicates that in aqueous solutions, such a method is applicable for the quantification of NO2−. By employing various concentrations of NO2− solution utilizing the optimal conditions, the actual concentration of NO2− in real samples is calculated using a calibrated graph that has already been produced. The obtained results with the help of percentage recovery formula are summarized in Table 3 (Nishan et al., 2021c).
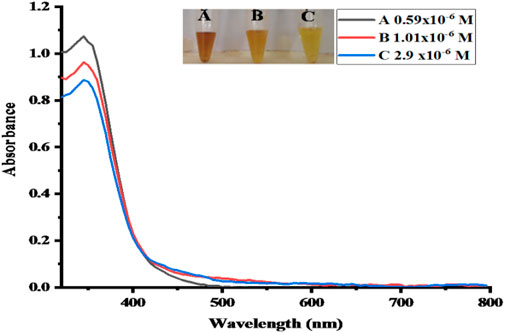
FIGURE 13. UV–Vis spectra of the real samples. Absorbance changes for (A, B and C) can be seen in the spectra.
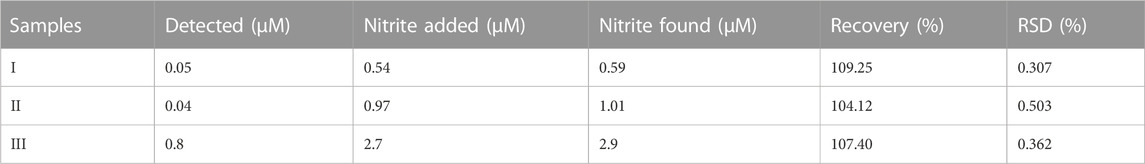
TABLE 3. Detection of NO2− in real samples.
Recovery % = nitrite found/nitrite added x 100 (Nishan et al., 2022).
In the present work, a simple and inexpensive colorimetric sensor was developed for the sensing and monitoring of nitrite employing acetic acid-coated CuO nanoparticles. The fabricated sensor could selectively detect nitrite ions by a distinct color change from brown to yellow, with a limit of detection of 2.69 × 10⁻⁷ M. In the present work, no sophisticated instrumentation is required for the colorimetric response. The proposed sensor gives the best colorimetric response under optimized conditions of 100 μL of capped CuO NPs, 100 μL of nitrite solution (2.40 × 10⁻⁶ M), 4 min, and pH 5 at room temperature. We believe that the proposed sensor, under optimized conditions, will be utilized to detect and measure the nitrite and nitrate ions on the spot.
The original contributions presented in the study are included in the article/Supplementary Material; further inquiries can be directed to the corresponding authors.
UN, SR, NM, and MA conceived the idea. MS, RU, AB, SR, JI, and NM performed the experiments. UN, HK, AM, and SA analyzed the data. UN, NM, MA, and SA wrote the manuscript. NK and IH critically evaluated the manuscript.
This research work was supported by researchers supporting Project number RSP2023R346, King Saud University, Riyadh, Saudi Arabia.
The authors extend their appreciation to the researchers supporting Project number RSP2023R346, King Saud University, Riyadh, Saudi Arabia, for financial support.
The authors declare that the research was conducted in the absence of any commercial or financial relationships that could be construed as a potential conflict of interest.
All claims expressed in this article are solely those of the authors and do not necessarily represent those of their affiliated organizations, or those of the publisher, the editors, and the reviewers. Any product that may be evaluated in this article, or claim that may be made by its manufacturer, is not guaranteed or endorsed by the publisher.
Adarsh, N., Shanmugasundaram, M., and Ramaiah, D. (2013). Efficient reaction based colorimetric probe for sensitive detection, quantification, and on-site analysis of nitrite ions in natural water resources. Anal. Chem. 85, 10008–10012. doi:10.1021/ac4031303
Adegoke, O., Zolotovskaya, S., Abdolvand, A., and Daeid, N. N. (2021). Rapid and highly selective colorimetric detection of nitrite based on the catalytic-enhanced reaction of mimetic Au nanoparticle-CeO2 nanoparticle-graphene oxide hybrid nanozyme. Talanta 224, 121875. doi:10.1016/j.talanta.2020.121875
Amanulla, B., Palanisamy, S., Chen, S.-M., Chiu, T.-W., Velusamy, V., Hall, J. M., et al. (2017). Selective colorimetric detection of nitrite in water using chitosan stabilized gold nanoparticles decorated reduced graphene oxide. Sci. Rep. 7, 14182–14189. doi:10.1038/s41598-017-14584-6
Asad, M., Muhammad, N., Khan, N., Shah, M., Khan, M., Khan, M., et al. (2022). Colorimetric acetone sensor based on ionic liquid functionalized drug-mediated silver nanostructures. J. Pharm. Biomed. Anal. 221, 115043. doi:10.1016/j.jpba.2022.115043
Basu, S., Ricart, K., Gladwin, M. T., Patel, R. P., and Kim-Shapiro, D. B. (2022). Tri-iodide and vanadium chloride based chemiluminescent methods for quantification of nitrogen oxides. Nitric Oxide 121, 11–19. doi:10.1016/j.niox.2022.01.006
Brender, J. D. (2020). “Human health effects of exposure to nitrate, nitrite, and nitrogen dioxide,” in Just enough nitrogen: Perspectives on how to get there for regions with too much and too little nitrogen, 283–294.
Chen, J., Pang, S., He, L., and Nugen, S. R. (2016). Highly sensitive and selective detection of nitrite ions using Fe3O4@SiO2/Au magnetic nanoparticles by surface-enhanced Raman spectroscopy. Biosens. Bioelectron. 85, 726–733. doi:10.1016/j.bios.2016.05.068
Cheng, Y.-H., Kung, C.-W., Chou, L.-Y., Vittal, R., and Ho, K.-C. (2014). Poly (3, 4-ethylenedioxythiophene)(PEDOT) hollow microflowers and their application for nitrite sensing. Sens. Actuators B Chem. 192, 762–768. doi:10.1016/j.snb.2013.10.126
Daniel, W. L., Han, M. S., Lee, J.-S., and Mirkin, C. A. (2009). Colorimetric nitrite and nitrate detection with gold nanoparticle probes and kinetic end points. J. Am. Chem. Soc. 131, 6362–6363. doi:10.1021/ja901609k
Deng, D., Jin, Y., Cheng, Y., Qi, T., and Xiao, F. (2013). Copper nanoparticles: Aqueous phase synthesis and conductive films fabrication at low sintering temperature. ACS Appl. Mater. Interfaces 5, 3839–3846. doi:10.1021/am400480k
Ethiraj, A. S., and Kang, D. J. (2012). Synthesis and characterization of CuO nanowires by a simple wet chemical method. Nanoscale Res. Lett. 7, 70. doi:10.1186/1556-276x-7-70
Fernández-Arias, M., Boutinguiza, M., Del Val, J., Riveiro, A., Rodríguez, D., Arias-González, F., et al. (2020). Fabrication and deposition of copper and copper oxide nanoparticles by laser ablation in open air. Nanomaterials 10, 300. doi:10.3390/nano10020300
Flores, M., and Toldrá, F. (2021). Chemistry, safety, and regulatory considerations in the use of nitrite and nitrate from natural origin in meat products-Invited review. Meat Sci. 171, 108272. doi:10.1016/j.meatsci.2020.108272
Gao, B., Zhao, X., Liang, Z., Wu, Z., Wang, W., Han, D., et al. (2020). CdS/TiO2 nanocomposite-based photoelectrochemical sensor for a sensitive determination of nitrite in principle of etching reaction. Anal. Chem. 93, 820–827. doi:10.1021/acs.analchem.0c03315
Greer, F. R., Shannon, M., and Health, C. o. E. (2005). Infant methemoglobinemia: The role of dietary nitrate in food and water. Pediatrics 116, 784–786. doi:10.1542/peds.2005-1497
Hosseini-Koupaei, M., Shareghi, B., Saboury, A. A., Davar, F., Sirotkin, V. A., Hosseini-Koupaei, M. H., et al. (2019). Catalytic activity, structure and stability of proteinase K in the presence of biosynthesized CuO nanoparticles. Int. J. Biol. Macromol. 122, 732–744. doi:10.1016/j.ijbiomac.2018.11.001
Hosseini-Monfared, H., Parchegani, F., and Alavi, S. (2015). Carboxylic acid effects on the size and catalytic activity of magnetite nanoparticles. J. Colloid Interface Sci. 437, 1–9. doi:10.1016/j.jcis.2014.08.056
Hu, X., Shi, J., Shi, Y., Zou, X., Tahir, H. E., Holmes, M., et al. (2019). A dual-mode sensor for colorimetric and fluorescent detection of nitrite in hams based on carbon dots-neutral red system. Meat Sci. 147, 127–134. doi:10.1016/j.meatsci.2018.09.006
Jaiswal, N., Tiwari, I., Foster, C. W., and Banks, C. E. (2017). Highly sensitive amperometric sensing of nitrite utilizing bulk-modified MnO2 decorated Graphene oxide nanocomposite screen-printed electrodes. Electrochim. Acta 227, 255–266. doi:10.1016/j.electacta.2017.01.007
Karrat, A., Digua, K., and Amine, A. (2022). Development of a simplified spectrophotometric method for nitrite determination in water samples. Spectrochim. Acta Part A Mol. Biomol. Spectrosc. 267, 120574. doi:10.1016/j.saa.2021.120574
Kumar, V. V., and Anthony, S. P. (2014). Highly selective silver nanoparticles based label free colorimetric sensor for nitrite anions. Anal. Chim. Acta 842, 57–62. doi:10.1016/j.aca.2014.06.028
Lanje, A. S., Sharma, S. J., Pode, R. B., and Ningthoujam, R. S. (2010). Synthesis and optical characterization of copper oxide nanoparticles. Adv. Appl. Sci. Res. 1, 36–40.
Li, T., Li, Y., Zhang, Y., Dong, C., Shen, Z., and Wu, A. (2015). A colorimetric nitrite detection system with excellent selectivity and high sensitivity based on Ag@Au nanoparticles. Analyst 140, 1076–1081. doi:10.1039/c4an01583e
Lim, H. S., Lee, S. J., Choi, E., Lee, S. B., Nam, H. S., and Lee, J. K. (2022). Development and validation of an ionic chromatography method for nitrite determination in processed foods and estimation of daily nitrite intake in Korea. Food Chem. 382, 132280. doi:10.1016/j.foodchem.2022.132280
Lin, A.-J., Wen, Y., Zhang, L.-J., Lu, B., Li, Y., Jiao, Y.-Z., et al. (2011). Layer-by-layer construction of multi-walled carbon nanotubes, zinc oxide, and gold nanoparticles integrated composite electrode for nitrite detection. Electrochim. acta 56, 1030–1036. doi:10.1016/j.electacta.2010.10.058
Loganathan, S., Valapa, R. B., Mishra, R. K., Pugazhenthi, G., and Thomas, S. (2017). “Thermogravimetric analysis for characterization of nanomaterials,” in Thermal and rheological measurement techniques for nanomaterials characterization (Elsevier), 67–108.
Majou, D., and Christieans, S. (2018). Mechanisms of the bactericidal effects of nitrate and nitrite in cured meats. Meat Sci. 145, 273–284. doi:10.1016/j.meatsci.2018.06.013
Nam, Y.-S., Noh, K.-C., Kim, N.-K., Lee, Y., Park, H.-K., and Lee, K.-B. (2014). Sensitive and selective determination of NO2− ion in aqueous samples using modified gold nanoparticle as a colorimetric probe. Talanta 125, 153–158. doi:10.1016/j.talanta.2014.02.030
Nam, J., Jung, I.-B., Kim, B., Lee, S.-M., Kim, S.-E., Lee, K.-N., et al. (2018). A colorimetric hydrogel biosensor for rapid detection of nitrite ions. Sens. Actuators B Chem. 270, 112–118. doi:10.1016/j.snb.2018.04.171
Nishan, U., Gul, R., Muhammad, N., Asad, M., Rahim, A., Shah, M., et al. (2020). Colorimetric based sensing of dopamine using ionic liquid functionalized drug mediated silver nanostructures. Microchem. J. 159, 105382. doi:10.1016/j.microc.2020.105382
Nishan, U., Sabba, U., Rahim, A., Asad, M., Shah, M., Iqbal, A., et al. (2021a). Ionic liquid tuned titanium dioxide nanostructures as an efficient colorimetric sensing platform for dopamine detection. Mater. Chem. Phys. 262, 124289. doi:10.1016/j.matchemphys.2021.124289
Nishan, U., Haq, S. U., Rahim, A., Asad, M., Badshah, A., Ali Shah, A.-u.-H., et al. (2021b). Ionic-Liquid-Stabilized TiO2 nanostructures: A platform for detection of hydrogen peroxide. ACS Omega 6, 32754–32762. doi:10.1021/acsomega.1c04548
Nishan, U., Niaz, A., Muhammad, N., Asad, M., Khan, N., Khan, M., et al. (2021c). Non-enzymatic colorimetric biosensor for hydrogen peroxide using lignin-based silver nanoparticles tuned with ionic liquid as a peroxidase mimic. Arabian J. Chem. 14, 103164. doi:10.1016/j.arabjc.2021.103164
Nishan, U., Khan, H. U., Rahim, A., Asad, M., Qayum, M., Khan, N., et al. (2022). Non-enzymatic colorimetric sensing of nitrite in fortified meat using functionalized drug mediated manganese dioxide. Mater. Chem. Phys. 278, 125729. doi:10.1016/j.matchemphys.2022.125729
Odedairo, T., Chen, J., and Zhu, Z. (2013). Metal–support interface of a novel Ni–CeO2 catalyst for dry reforming of methane. Catal. Commun. 31, 25–31. doi:10.1016/j.catcom.2012.11.008
Ozdestan, O., and Uren, A. (2010). Development of a cost-effective method for nitrate and nitrite determination in leafy plants and nitrate and nitrite contents of some green leafy vegetables grown in the Aegean region of Turkey. J. Agric. food Chem. 58, 5235–5240. doi:10.1021/jf904558c
Pourreza, N., and Abdollahzadeh, R. (2019). Colorimetric determination of hydrazine and nitrite using catalytic effect of palladium nanoparticles on the reduction reaction of methylene blue. Microchem. J. 150, 104067. doi:10.1016/j.microc.2019.104067
Qu, J., Dong, Y., Wang, Y., and Xing, H. (2015). A novel sensor based on Fe3O4 nanoparticles–multiwalled carbon nanotubes composite film for determination of nitrite. Sens. Bio-Sens. Res. 3, 74–78. doi:10.1016/j.sbsr.2014.10.009
Rajaji, U., Manavalan, S., Chen, S.-M., Chinnapaiyan, S., Chen, T.-W., and Ramalingam, R. J. (2019). Facile synthesis and characterization of erbium oxide (Er2O3) nanospheres embellished on reduced graphene oxide nanomatrix for trace-level detection of a hazardous pollutant causing Methemoglobinaemia. Ultrason. Sonochem. 56, 422–429. doi:10.1016/j.ultsonch.2019.02.023
Sáenz-Galindo, A., López-López, L. I., Fabiola, N., Castañeda-Facio, A. O., Rámirez-Mendoza, L. A., Córdova-Cisneros, K. C., et al. (2018). “Applications of carboxylic acids in organic synthesis, nanotechnology and polymers,” in Carboxylic acid: Key role in life sciences, 35.
Sarkar, A., Kapoor, S., and Mukherjee, T. (2005). Synthesis of silver nanoprisms in formamide. J. colloid interface Sci. 287, 496–500. doi:10.1016/j.jcis.2005.02.017
Shi, W.-Z., Liang, Y.-S., Lu, B., Chen, M., Li, Y., and Yang, Z. (2019). Cuprous oxide nanoparticles: Preparation and evaluation of antifouling activity. Quím. Nova 42, 638–641. doi:10.21577/0100-4042.20170374
Singh, P., Singh, M. K., Beg, Y. R., and Nishad, G. R. (2019). A review on spectroscopic methods for determination of nitrite and nitrate in environmental samples. Talanta 191, 364–381. doi:10.1016/j.talanta.2018.08.028
Sun, X., and Luo, Y. (2005). Preparation and size control of silver nanoparticles by a thermal method. Mater. Lett. 59, 3847–3850. doi:10.1016/j.matlet.2005.07.021
Teles, A. R. R., Capela, E. V., Carmo, R. S., Coutinho, J. A., Silvestre, A. J., and Freire, M. G. (2017). Solvatochromic parameters of deep eutectic solvents formed by ammonium-based salts and carboxylic acids. Fluid Phase Equilib. 448, 15–21. doi:10.1016/j.fluid.2017.04.020
Wang, J., Zhao, D., Zhang, Y., Li, J., and Xu, C. (2014). A highly sensitive sensor for the detection of nitrite based on a nanoporous Fe2O3–CoO composite. Anal. Methods 6, 3147–3151. doi:10.1039/c4ay00171k
Wang, X., Hu, Y., and Wei, H. (2016). Nanozymes in bionanotechnology: From sensing to therapeutics and beyond. Inorg. Chem. Front. 3, 41–60. doi:10.1039/c5qi00240k
Xiong, Y., Li, M., Liu, H., Xuan, Z., Yang, J., and Liu, D. (2017). Janus PEGylated gold nanoparticles: A robust colorimetric probe for sensing nitrite ions in complex samples. Nanoscale 9, 1811–1815. doi:10.1039/c6nr07879f
Ye, Y., Guo, Y., Yue, Y., and Zhang, Y. (2015). Facile colorimetric detection of nitrite based on anti-aggregation of gold nanoparticles. Anal. Methods 7, 4090–4096. doi:10.1039/c5ay00386e
Zhang, J., Yang, C., Wang, X., and Yang, X. (2012). Colorimetric recognition and sensing of nitrite with unmodified gold nanoparticles based on a specific diazo reaction with phenylenediamine. Analyst 137, 3286–3292. doi:10.1039/c2an35204d
Keywords: Augmentin drug, CuO NPs, cured meat samples, biosensor, interference study, nitrite
Citation: Nishan U, Rehman S, Ullah R, Bari A, Afridi S, Shah M, Iqbal J, Asad M, Badshah A, Khan N, Hwang IM, Khan HU and Muhammad N (2023) Fabrication of a colorimetric sensor using acetic acid-capped drug-mediated copper oxide nanoparticles for nitrite biosensing in processed food. Front. Mater. 10:1169945. doi: 10.3389/fmats.2023.1169945
Received: 20 February 2023; Accepted: 18 April 2023;
Published: 05 May 2023.
Edited by:
Ibrahim Sadek, Helwan University, EgyptReviewed by:
Hassan Mostafa, Université de Sherbrooke, CanadaCopyright © 2023 Nishan, Rehman, Ullah, Bari, Afridi, Shah, Iqbal, Asad, Badshah, Khan, Hwang, Khan and Muhammad. This is an open-access article distributed under the terms of the Creative Commons Attribution License (CC BY). The use, distribution or reproduction in other forums is permitted, provided the original author(s) and the copyright owner(s) are credited and that the original publication in this journal is cited, in accordance with accepted academic practice. No use, distribution or reproduction is permitted which does not comply with these terms.
*Correspondence: Umar Nishan, dW1hcm5pc2hhbjg1QGdtYWlsLmNvbQ==; Nawshad Muhammad, bmF3c2hhZGJudUBnbWFpbC5jb20=
Disclaimer: All claims expressed in this article are solely those of the authors and do not necessarily represent those of their affiliated organizations, or those of the publisher, the editors and the reviewers. Any product that may be evaluated in this article or claim that may be made by its manufacturer is not guaranteed or endorsed by the publisher.
Research integrity at Frontiers
Learn more about the work of our research integrity team to safeguard the quality of each article we publish.