 T. Sowoidnich
 H. Cölfen
 C. Rößler1
94% of researchers rate our articles as excellent or good
Learn more about the work of our research integrity team to safeguard the quality of each article we publish.
Find out more
ORIGINAL RESEARCH article
Front. Mater., 28 April 2023
Sec. Structural Materials
Volume 10 - 2023 | https://doi.org/10.3389/fmats.2023.1159772
This article is part of the Research TopicSustainable raw materials for innovative concretes and structuresView all 5 articles
Introduction: Metakaolin (MK) is used as supplementary cementitious material to reduce the CO2 footprint of Portland cements. However, the early hydration of Portland cement (OPC) is often retarded due to its use. The present work investigates the mechanisms of this retardation. Focus is laid on the interaction of MK with the main clinker phase C3S (Ca3SiO5, pure form of alite) that is known to govern the kinetics of early hydration of OPC.
Methods: Hydration reactions of MK and C3S were analysed by optical emission spectroscopy, electron microscopy, thermal analysis, X-ray diffraction and reaction calorimetry.
Results: Results on MK showed that compared to sodium ions the presence of calcium ions reduced the maximum amounts of silicate and aluminate ions released into solution by MK. For MK + C3S mixtures, C-A-S-H was formed at the surfaces of both C3S and MK within minutes with a composition of (CaO)1.3(SiO2)0.8(Al2O3)0.2(H2O)2.7. The solubility constant of (CaO)1.3(SiO2)0.8(Al2O3)0.2(H2O)2.7 was determined.
Discussion: C-A-S-H appeared to be an unsuitable substrate for C-S-H nucleation. Therefore, its formation during early hydration is expected to play an important role in the retardation of C3S hydration. Indeed, when C-A-S-H seeds are formed, less C-S-H seeds are formed leading to lengthen the duration of the induction period. The presence of sulfate ions reduces the amount of C-A-S-H seeds as most aluminate ions are consumed to form ettringite. Consequently, sulfate ions induce an increase of the hydration kinetics such as observed in MK + C3S mixtures.
Lowering the CO2 emissions in concrete production is one of the main targets of academic and industrial research and development. Therefore, different approaches are being currently followed (Gartner, 2012; Scrivener, 2014). Among them, the search for potential alternatives that partly or fully substitute ordinary Portland cement (OPC) clinker is an important strategy. These substituting materials are termed supplementary cementitious materials (SCMs).
Calcined clays are an upcoming SCM, that is obtained by calcination of raw clays at temperatures that are dependent on the clay mineral composition (typically between 400°C and 900°C) (Hanein et al., 2021). Thereby, the crystalline clay minerals undergo a structural disorder, and the calcined clay is therefore also termed meta-clay. Calcined kaolinite (metakaolin, MK) is known to possess a higher pozzolanic reactivity than other meta-clays (Tironi et al., 2012). However, due to economic reasons and the limited availability of kaolinite, other meta-clays with lower reactivity as compared to MK are more favoured for application in cement and concrete (He et al., 1995; Buchwald et al., 2009; Pomakhina et al., 2012; Taylor-Lange et al., 2015; Avet et al., 2016; Yanguatin et al., 2017; Nancy Beuntner et al., 2019; Chen et al., 2020). Furthermore, it is known that it is advantageous to combine SCMs in a cement blend such as blast furnace slag (Menéndez et al., 2003), fly ash and limestone (Mounanga et al., 2011). The combination of cement clinker, calcined clay and limestone is currently introduced into application as so-called limestone calcined clay cements [LC3 (Antoni et al., 2012)].
The partial substitution of OPC by SCMs alters the reactivity, strength development and durability. Generally, the reactivity, especially during the first 24 h, can be retarded or accelerated, which is based on the filler or seeding effect (Darweesh, 2004; Berodier and Scrivener, 2014). The mechanisms of the filler effect are discussed controversially as follows: i) The addition of SCMs causes dilution of the OPC, which increases the water/cement (w/c) ratio at constant water/solid ratio. As a result, more OPC dissolves in order to reach the saturation state with the contiguous aqueous phase (Gutteridge and Dalziel, 1990), ii) agglomeration of SCM particles (inducing a dependence of acceleration on the SCM replacement level because the agglomeration of particles leads to less surfaces that are exposed to the environment) (Cook et al., 2019), iii) heterogeneous nucleation of hydration products on the surface of the filler (provision of extra surfaces) (Makar et al., 2012; Kumar et al., 2017), and iv) transport processes of ions (from cement particle surfaces into solution) in the event of mixing the cement paste (Berodier and Scrivener, 2014). General considerations of the filler effect can be found in review articles [e.g., (Lothenbach et al., 2011; Skibsted and Snellings, 2019)]. The seeding effect is based on the direct provision of reaction product nuclei (or larger nuclei-aggregates) that grow, whereby the barrier for nucleation is low or absent. A recent review regarding the seeding effect in cementitious materials can be found in (John et al., 2018).
When calcined clays are used in blended cements with limestone and an optimised content of set regulator (calcium sulfate sources), usually an acceleration of the hydration kinetics is observed (filler effect) (Zunino and Scrivener, 2019). But without limestone and/or optimized set regulator content the replacement of OPC (or C3S/tricalcium silicate, the pure form of the main clinker phase alite) by MK leads to a retardation of the early hydration of OPC (and C3S) (Lapeyre and Kumar, 2018; Ez-zaki et al., 2021). The origin of this retardation is currently discussed, whereby the aluminate is seen as the cause (Begarin et al., 2011; Pustovgar et al., 2017; Lapeyre and Kumar, 2018). This makes the correct sulfatisation of the cement blend very important (Andrade Neto et al., 2021).
Sulfate is known as strong reaction partner for C3A (pure form of the clinker phase tricalcium aluminate) that enables the workability of cements (Lerch, 1946) and is also important for durability aspects. Additionally, sulfate can have an influence on the C3S hydration kinetics. Thereby, a prolonging of the induction period and an acceleration of the main hydration period are reported (Andrade Neto et al., 2022). The mechanisms are claimed to be hindered C3S dissolution and adsorption (Zunino and Scrivener, 2020) or absorption (Valentini et al., 2015) of sulfate at/in C-S-H. However, several parameters of the interaction between sulfate and C3A/C3S are still not understood (Andrade Neto et al., 2021).
The formation of carboaluminates (AFm) from the pozzolanic reaction between MK and portlandite provides extra space filling phases that increase the strength and durability of concrete. In this respect the role of C-A-S-H and C-S-H formation is not clear. Especially, whether C-A-S-H and C-S-H are the same phase with different aluminate content within the structure or not (Haas and Nonat, 2015). Additionally, some attempts are given that C-A-S-H is not a good substrate for C-S-H nucleation (Begarin, 2012).
The present study aims at understanding the causes of the retarding effect that MK induces on cement and in particular C3S hydration with a special focus on the role of sulfate content and C-A-S-H formation. For this purpose, we study the reactions of C3S and MK separately and in combination by investigating 1) the impact of aqueous calcium ion concentration on the early reactivity of MK, 2) the development of aluminate ion concentration in the aqueous phase and 3) the reaction of MK and C3S in [C3S + MK] mixtures. Therefore, the ion concentrations in [C3S + MK] mixtures are measured during the very early hydration. These values are used to calculate C-A-S-H solubility. Finally, the role of C-A-S-H and C-S-H are discussed.
Although monoclinic polymorphs of C3S are predominantly present in Portland cement clinker, triclinic C3S was used in this study. This excludes the occurrence of ions (e.g., iron, aluminum, magnesium) in the studied aqueous phase that are needed to stabilize the monoclinic C3S polymorph and could superimpose with the studied ions. C3S synthesized by burning a mixture of calcium carbonate (CaCO3, Merck, p. a.) and amorphous silica (SiO2, Merck, p. a.) at 1550°C. Subsequently, the material was cooled to room temperature and ground in a disc mill (made of zirconia). This burning-cooling-milling procedure was repeated 3 times. The phase analysis by means of quantitative XRD showed the dominance of the triclinic modification of C3S (>99 wt.-%). Metakaolin was purchased from MC Bauchemie Müller GmbH and Co. KG (Centrilit). The MK contained 92.1 wt.-% amorphous phase, 4.2 wt.-% quartz and 2.7 wt.-% muscovite.
The chemical analysis of C3S and MK was determined by chemical wet analysis and is shown in Table 1.
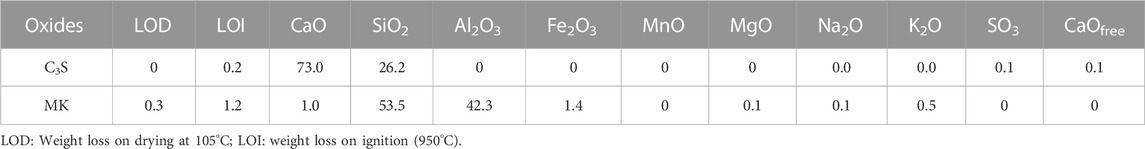
TABLE 1. Chemical composition of C3S and MK [mass-%].
The reactivity of MK was tested by the R3 test using calorimetry and the protocol from (Avet et al., 2022). The total heat was 1033 J/gMK (3d) and 1052 J/gMK (7d), which indicates a more reactive calcined clay compared to the calcined clay used in (Avet et al., 2022) (495 J/gcc (3d), 537 J/gcc (7d)). The N2-BET specific surface area (SSA) was determined according to DIN ISO 9277 (BET procedure, Beckman Coulter SA3100). The values of the SAA measures: 0.4 m2/g (sample: C3S) and 9.2 m2/g (sample: MK).
Calcium hydroxide (Merck, p.A.) was used to prepare saturated solutions for the suspension experiments. These solutions were obtained by mixing 2 g of Ca(OH)2 in 1 L water for 1 hour or more with subsequent filtration of the suspension (filter mesh of 0.45 µm, N2-pressure filtration). The semi-saturated Ca(OH)2-solution was obtained by mixing the as prepared saturated Ca(OH)2-solution with CO2-free water. Saturated gypsum solutions were prepared by mixing 4 g CaSO4*2H2O (Casea, Germany) in 1 L water. This suspension was filtered (filter mesh of 0.45 µm, N2-pressure filtration) after 1 h. The suspension experiments were started by adding MK, respectively, [C3S + MK] or [C3S] to the solutions. All preparation steps were conducted at 25°C and under N2 atmosphere to prevent carbonation.
Ion concentrations of the aqueous phase were analysed in stirred diluted suspensions, whereby the liquid/solid ratio is given in the respective sections. The solid and the liquid phase were separated for analyzing the ion concentration of the aqueous phase. Therefore, approx. 10 mL of an aliquot of the suspension was filtered (syringe filter, 0.2 µm pore size). In order to stabilize the aqueous samples, a small amount of acid (5M HNO3) was added after filtering. The measured concentrations were corrected taking this dilution (<2%) into account. Ion concentrations were measured by ICP-OES (Horiba ActivaM, Jobin Yvon) at λ = 317.933 and 373.690 nm (Ca), 308.215 nm (Al) and λ = 251.611 nm (Si). The limit of detection was 0.3 μmol/L for Al and 0.07 μmol/L for Si, whereas the limit of quantification was 0.7 μmol/L for Al and 0.2 μmol/L for Si.
For thermodynamic calculations, the measured ion concentrations were transformed into ion activities using the Debye-Hückel approach (Debye and Hückel, 1923). For this purpose, the software PHREEQC, (2021) was used.
Reaction calorimetry was performed on C3S pastes at various w/s (water/solid) ratios (by mass) whereby the w/C3S ratio was constantly 0.5. The water demand of the MK was addressed by dosing additional water to the mixture, whereby the ratio between water and the surface area of [C3S + MK] was kept constant at a value of 0.9. The measurements were conducted in an isothermal heat conduction calorimeter (TAM Air, TA Instruments). The reference material was water, whereby the heat capacity between the sample and the reference was equalized by the mass of water. Four grams of solid with the respective water/solution mass were placed in the calorimeter, which was placed at 20°C room temperature, whereas the measurements were conducted at 25°C. Results are given per mass C3S. All analyses were performed in duplicate to detect outliers.
For analysis of the solid fraction of the pastes by thermogravimetry, XRD and SEM, the hydration progress was terminated by mixing the paste with 2-propanol (4 g paste with 20 mL 2-propanol). Subsequently this mixture was filtered using cellulose filters with a pore size of 0.1 µm. Afterwards the as-obtained samples were dried at 35°C for 24 h.
Thermogravimetry (TA instruments SDT Q600) was performed at a heating rate of 10 K/min under a stream of nitrogen. The portlandite content was derived from the mass loss between 400°C and 500°C (exact values were chosen on the base of DTG) using the following equation:
Eq. 1:
With cCa(OH)2 is the concentration of portlandite [mass-%], WLCa(OH)2 the loss of water in portlandite [weight -%] and 74/18 refers to the molar masses of water and portlandite.
XRD (D8, Siemens) was performed using Cu-radiation at 40 mA and 40 kV. Scans in a step size of 0.01°2Theta were recorded over a range of 5°–70°2Theta at a scan time of 4 s per step.
Specimens were analyzed by SEM-EDX (Nova NanoSEM 230, FEI, Netherlands) equipped with a field-emission gun (Schottky emitter). For imaging secondary electrons (SE) were used at low voltage, low current settings (1.5 kV, 20 pA) and a short exposure time. This allows to image electrically non-conductive samples without applying a coating layer.
The effects of MK and gypsum on the hydration kinetics of Portland cement clinker are already known (gypsum fascilitates the silicate hydration by controlling the aluminate/MK hydration) (Ez-zaki et al., 2021), but the magnitudes of these effects are dependent on the characteristics of the used materials. We start our investigations with the analysis of the interaction between Portland cement clinker, MK and gypsum by isothermal conduction calorimetry. This enable us to discuss the results of the model systems presented later in a broader context. Results are shown in Figure 1.

FIGURE 1. Heat release rate per mass of clinker during hydration of Portland cement clinker without and with gypsum and MK.
The pure clinker hydration (solid line in Figure 1) is characterized by a splitting of the main hydration peak, which shows a first smaller shoulder that was assigned to the aluminate hydration (Zunino and Scrivener, 2019) starting after 4 h of hydration. After 20 h of hydration, the second part of the main peak begins to evolve, showing a maximum after 39 h of hydration. The hydration at this stage is governed mostly by the silicate reaction (Bernal et al., 2022; Zunino et al., 2022).
The addition of gypsum (red dashed line in Figure 1) leads to a faster reaction of the clinker and reflects the hydration of a Portland cement in which the aluminate and the silicate reaction occur simultaneously. When MK substitutes the clinker (no addition of gypsum), the occurance of the hydration stages is delayed (Figure 1: blue dash-point curve). Thereby, no first shoulder of the main hydration peak, which was observed for the pure clinker, is detected. The main maximum occurs 6 h later compared to pure clinker. Also the clinker hydrates at lower rate compared to the pure clinker sample. This delayed and slower hydration of clinker with MK can be compensated by the addition of gypsum [Figure 1: green (dash-point-point) curves], whereby the occurance of the aluminate peak before the silicate peak indicates an undersulfated system (Zunino and Scrivener, 2019). In the following, we have investigated the observed retardation of the cement hydration when Portland cement clinker is substituted by MK, i.e., the mechanism of the slowed reaction represented by the blue dash-point curve in Figure 1.
The impact of MK on the hydration of C3S-pastes was examined with focus on reaction kinetics, phase development and the microstructure of the solid phase. Pastes with [100 wt.-% C3S] and [50 wt% C3S+50 wt% MK] as the solid phase at L/s = 0.5 were prepared. For these pastes both water and saturated gypsum solutions were used as starting solutions. Saturated gypsum solutions instead of solid gypsum were chosen to account for the impact of sulfate on the C3S hydration to provide sulfate ions already at the first contact of C3S/MK with the solution.
Figure 2 shows the results obtained by isothermal conduction calorimetry of the aforementioned pastes. It is obvious that the use of saturated gypsum solution instead of water as starting solution has only minor prolonging effects on the induction period of C3S hydration in the absence of MK. It should be noticed that water as starting solution is very quickly saturated with respect to calcium hydroxide (Sowoidnich et al., 2019), which will be focused on in the next section in more detail. A slight prolonging of the induction period that results in a shift of the maximum of the main hydration peak to later stages is observed (21 min later) when saturated gypsum solution is the starting solution instead of water. At the same time, the main hydration peak is slightly narrower with gypsum-solution compared to water as starting solution, so that the deceleration periods of the sample with water and saturated gypsum solution are identical. This results in lower heat that is released after 50 h in the sulfated sample compared to the sample with water as starting solution (Figure 2B, 162 J/gsolid (water) resp. 152 J/gsolid (gypsum-solution). The measured total heat of [C3S + MK] is greater than the value expected due to diluting effect, when MK is considered to be inert during the first 50 h of hydration [theoretically 81 J/gC3S (water), 76 J/gC3S (gypsum-solution)]. Therefore, an enhanced C3S hydration and/or additional MK reaction is revealed by the total heat release.
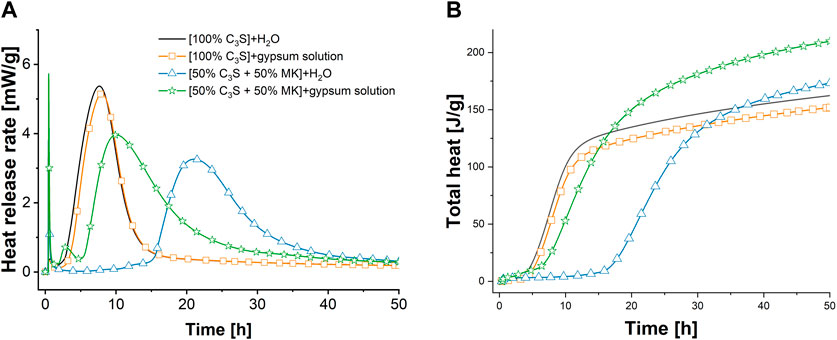
FIGURE 2. Heat release rate (A) and total heat (B) per mass of solid during hydration of C3S and [50% C3S+50% MK]-pastes with water or saturated gypsum solution as starting solutions at l/s mass ratio of 0.5.
When 50 mass-% of the C3S is replaced by MK, a strong prolonging of the induction period is observed (from 2.2 h to 15.0 h) when water is the starting solution. [C3S + MK]-pastes show a lower maximum heat release rate during the main hydration period of C3S compared to the pure C3S pastes. Thereby, the main peak is broadened due to the MK addition. This indicates that the hydration during the main hydration period occurs at lower intensity but is not strongly hindered. Indeed, the total heat is similar after the main hydration peak (137 J/gsolid after 32 h, Figure 2B).
When saturated gypsum solution is used as starting solution instead of water, the retarding effect induced by MK on C3S hydration vanishes almost completely. Thereby, the main hydration peak is split into a first small peak at 2.5 h of hydration and the larger second peak at 10 h of hydration. The second peak looks like the one obtained with water as starting solution for [C3S + MK]-paste but with higher intensity as the first main hydration peak.
The increased measured total heat per g of C3S in [C3S + MK]-pastes in relation to the pure C3S pastes shown in Figure 2B indicate that either the C3S hydration proceeds with higher intensity or MK contributes additionally to the heat release. This behaviour is identical to the case when water is the starting solution.
The solid part of the C3S pastes was investigated by TG, XRD and SEM after 7 h and 24 h of hydration. Figure 3 presents the TG/DTG A) and the XRD B) results, and Table 2 summarizes the TGA results.
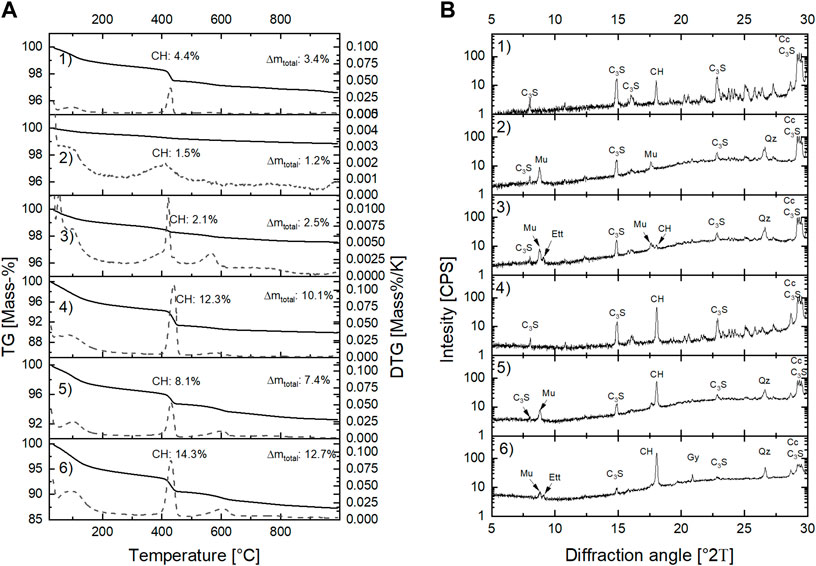
FIGURE 3. Results of TG (solid lines), DTG (dashed lines) (A) and XRD (B) analyzes of pastes hydrated with H2O or saturated gypsum solution for 7 h and 24 h. Abbreviations: CH (portlandite) Mu (muscovite), Ett (ettringite), CH (portlandite), Gy (gypsum), Qz (quartz), Cc (calcite).
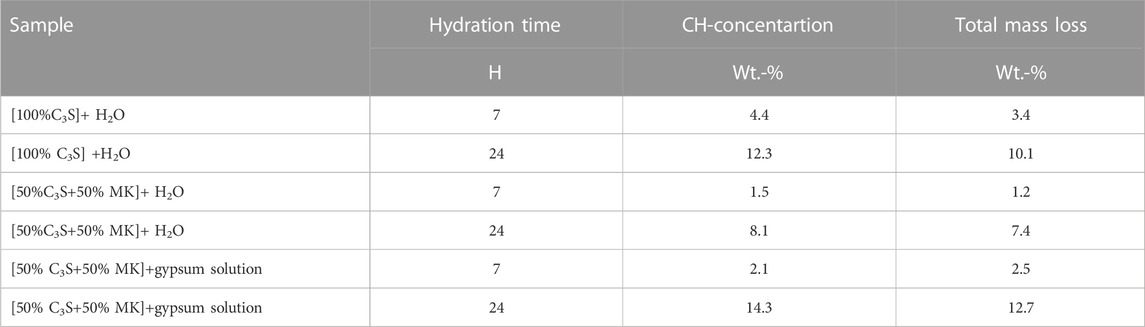
TABLE 2. Portlandite (CH) concentration and total mass loss of C3S-pastes hydrated for 7 and 24 h.
In general, the results from isothermal conduction calorimetry are confirmed by TG/DTG and XRD. Accordingly, the samples that are hydrated in saturated gypsum solution have a higher mass loss in the investigated temperature range (room temperature to 1000°C) than the samples hydrated in water (Figure 3A). This indicates a higher percentage of reaction of the sample hydrated in saturated gypsum solution as starting solution as reflected by the increased total heat shown in Figure 2B. The mass loss between 400°C and 450°C represents the dehydration of portlandite, and was therefore used to calculate the portlandite content of the solid phase using Eq. 1 (portlandite contents are given in Figure 3A).
Results show that more portlandite is present in the sample hydrated in saturated gypsum solution as compared to the samples hydrated in water. The mass losses from room temperature to 200°C -that are characteristic for gypsum, ettringite or AFm [alumina, ferric oxide, monosulfate (Taylor, 1997)]- are lower for the samples hydrated for 7 h (0.4%–1.2%) as compared to the samples hydrated for 24 h (2.9%–5.1%). Thereby, the higher mass loss is obtained in the samples hydrated with gypsum solution instead of water. This indicates that either gypsum, ettringite of AFm may have formed when gypsum solution is used. The XRD reflections at 9.8° 2Θ and 20.9° 2Θ (Figure 3B) in the samples hydrated with saturated gypsum solution prove that both ettringite and gypsum have formed.
Additionally, the reflection at 18° 2Θ (portlandite basal plane) is pronounced. These results indicate that the sulfate ions introduced by the saturated gypsum solution lead to the formation of ettringite and gypsum. It is expected that the fast formation of ettringite rapidly decreases the aluminate concentrations in the aqueous phase. As a consequence, the hydration kinetics of [C3S + MK]-pastes is no longer depressed by the aluminate ions released by MK.
The microstructure of the solid phase of [50 mass% C3S+50 mass% MK]-pastes hydrated in water and saturated gypsum solution for 7 h and 24 h was imaged using secondary electrons (SE) in the SEM. Micrographs are presented in Figure 4. SEM-SE images of the solid fraction of [C3S + MK]-pastes hydrated for 7 h with water as starting solution show merely dissolution patterns of C3S (etch-pit formation, see arrows in Figure 4). Foil-like or needle-shaped C-A-S-H and/or C-S-H phases at the surface of C3S have not been formed (Figure 4A). Because the excitation volume where X-rays emerge during EDX analysis is larger than the C-A-S-H or C-S-H particles, a clear differentiation between C-A-S-H and C-S-H is not possible by this method. After 24 h (Figure 4C), the surface of C3S appears coarsened with respect to the smoother surface found after 7 h of hydration. At this stage, some C-A-S-H and/or C-S-H phases are visible at the C3S surface, but also at the MK surface such phases are found.
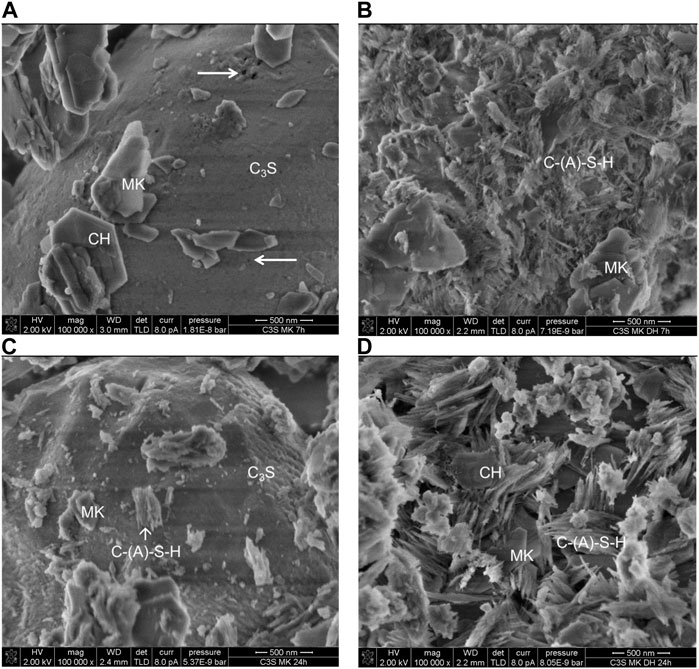
FIGURE 4. SEM-SE images of [C3S + MK] samples hydrated in water (A and C) or saturated gypsum solution (B and D) for 7 h (top row) and 24 h (bottom row). Etch-pits are visualised by arrows.
The hydration in the absence of sulfate is slower as in the presence of sulfate because when [C3S + MK] pastes are hydrated with saturated gypsum solution instead of water (right hand row), the microstructure is dominated by C-A-S-H and/or C-S-H phases at the surface of C3S already after 7 h of hydration (Figure 4B). Some MK particles start to dissolve, and some C-A-S-H and/or C-S-H is formed at the MK surface. The progress of hydration is more advanced as compared to the sample hydrated for 24 h in water. This finding is in accordance with the total heat released (Figure 2B). The examination of the sample hydrated for 24 h in saturated gypsum solution (Figure 4D) reveals that the C3S surface is completely covered by C-A-S-H and/or C-S-H phases. It can be additionally seen that the MK particles are stronger covered by such phases.
The microstructure of [C3S + MK]-pastes hydrated for 24 h in saturated gypsum solution is presented with higher magnification in Figure 5. The micrographs reveal that the C-A-S-H and/or C-S-H phases grow perpendicular to the surfaces of MK-particles without significant changes in the morphology of the MK particles. This indicates that the sources of ions for C-S-H phases are mainly C3S with minor contribution of MK for C-A-S-H, such that the Al/Si ratio of the C-A-S-H is expected to be small. It is therefore possible that C-A-S-H and C-S-H co-exist at this hydration stage. Furthermore, the high-resolution SEM-SE images in Figure 5 reveal that the C-A-S-H and/or C-S-H phases are composed of parallel aligned smaller fibres, i.e., appear as aggregates of smaller fibres. These aggregates intergrow with each other.
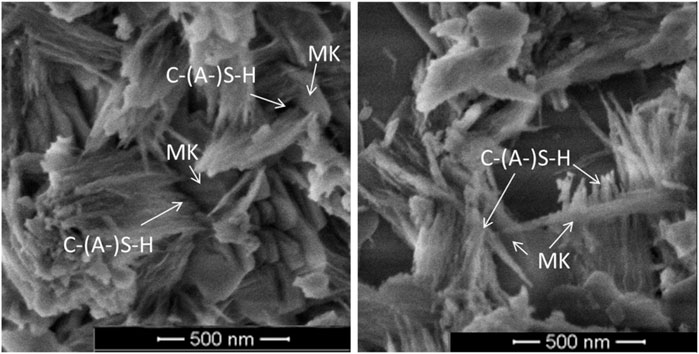
FIGURE 5. SEM-SE images of [C3S + MK] samples hydrated in saturated gypsum solution for 24 h.
The results of the calorimetry, thermal analysis, XRD and SEM investigations prove that MK retards the hydration of C3S in the first hours. At later hydration periods, the hydration is enhanced by the presence of MK. A key role is played by sulfate ions. In the major part of our study, we have investigated the mechanisms of the observed retardation, which is presented in the following.
The aqueous phase composition during hydration was investigated in suspensions containing C3S, MK and [C3S + MK]. The liquid/C3S ratio was kept constant at 50, the MK dosage was varied, and, in case of [C3S + MK]-suspensions, MK was added additionally to the suspension (C3S was not replaced by MK). The starting solutions were saturated portlandite- and saturated portlandite-gypsum-solutions. Figure 6 shows the time-dependent development of calcium, silicate, aluminate and sulfate concentrations as well as the pH of aqueous phase.
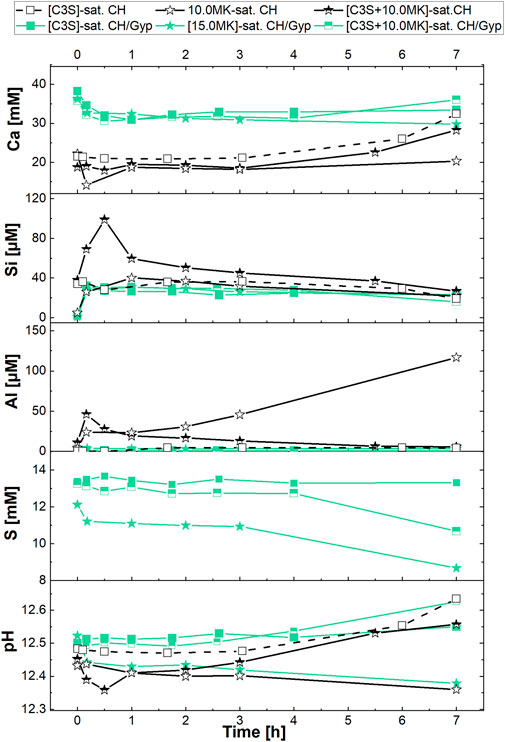
FIGURE 6. Calcium, silicate, aluminate, sulfate concentrations and pH of the aqueous phase during reaction of C3S, MK and [C3S + MK] in filtered solutions saturated with respect to portlandite as well as portlandite + gypsum in the first 7 h of hydration. The l/C3S ratio was 50, the numbers in the legend refer to the MK-dosage in g/L.
In the saturated Ca(OH)2-solution (open symbols in Figure 6), the pH and the calcium ion concentration of the C3S-suspension without MK are constant for 1 h after addition of C3S to the solution. Afterwards, calcium and hydroxide concentration increase because C3S dissolves and C-S-H precipitation consumes less calcium as provided by C3S dissolution (Barret and Bertrandie, 1986). The beginning of C-S-H precipitation corresponds to the decrease of the silicate concentration (Barret and Ménétrier, 1980), which can be deduced from Figure 6. No aluminate and sulfate were found as expected (concentrations are within the detection limit of the method).
The addition of MK to saturated Ca(OH)2-solution (open stars in Figure 6) induces a consumption of calcium until 60 min of hydration and a continuous decrease of pH. The silicate concentration is in the range of the C3S-suspension without MK, the aluminate concentration increases to 24 μmol/L in the first minutes and remains at this value for 1 h. Then we observe a steady increase in aluminate concentration to a value of approx. 117 μmol/L after 7 h of hydration. When both C3S and MK are added to the saturated Ca(OH)2-solution (black-and-white stars in Figure 6), the duration of the plateau of the calcium concentration as well as that of the pH is prolonged. This shows the retarding effect of MK on C3S hydration, and that C-S-H precipitation is slower as the duration of the plateau reflects the formation of C-S-H (Barret and Bertrandie, 1986). Then, both calcium concentration and pH increase due to ongoing C3S hydration, whereby in this [C3S + MK] suspension higher values than the pure C3S suspension are measured after 7 h of hydration.
The silicate concentration of the aqueous phase of the [C3S + MK]-suspension shows a peak at 1 h of hydration with a value of 100 μmol/L, which is 2.5 times higher than in the C3S-suspension. This value is even higher than the sum of the individual contributions of the pure C3S- (28 μmol/L] and MK- (26 μmol/L) suspension to the silicate concentration. The following decrease of the silicate concentration is slower in [C3S + MK] suspensions as compared to the pure C3S-suspension. Additionally, and compared to the pure C3S-suspension, the silicate concentration remains at higher levels when MK is present. Like silicate, we analysed a peak of the aluminate concentration after 1 h of [C3S + MK]-hydration with a value of 46 μmol/L, which is again greater than the sum of the aluminate concentration measured in separate experiments with C3S (0 μmol/L) and MK (24 μmol/L). But different to silicate, the aluminate concentration decreases with hydration time, and after 7 h of hydration, aluminate cannot be detected anymore.
The impact of sulfate on the aqueous phase composition is shown by results gathered in saturated Ca(OH)2-CaSO4-solution (filled symbols in Figure 6). We see that the starting solution (saturated Ca(OH)2-CaSO4-solution) has a higher calcium concentration (filled squares, 38 mM) than the saturated Ca(OH)2-solution (22 mM). Up to 1 h, the calcium ion concentration decreases to values of approx. 31 mM in all investigated suspensions (C3S-, MK- and [C3S + MK]-suspensions).
This decrease was not observed in the experiments with Ca(OH)2-solution as starting solution for the C3S-suspension, but is similar to the observation of the MK- and [C3S + MK]-suspension hydrated in the saturated Ca(OH)2-solution. A slight increase in calcium concentration is measured after 7 h of hydration in the samples where C3S is present. Similar results are gathered for the pH. Thus, the presence of MK in solutions that are saturated with respect to portlandite and gypsum caused no significant change in the calcium ion concentration.
However, as the results in Figure 6 document, sulfate ions strongly impact the silicate and aluminate concentrations. Accordingly, in the C3S-, MK- as well as in the [C3S + MK]-suspension, similar values of silicate and aluminate are analysed, i.e., there is no difference between C3S-, MK- or [C3S + MK] anymore even if C3S or MK hydrates. The sulfate concentrations show no significant variation over the hydration time of 7 h in the C3S-suspension. When MK is added, the sulfate concentration drops from 12 to 11 mmol/L at the beginning and remains constant for 3 h. After 7 h, we observed that the sulfate concentration is reduced to a value of approx. 9 mmol/L. These observations in pure MK-suspensions are also observed in the [C3S + MK]-suspension with lower intensity. Therefore, we can relate the reaction between MK and sulfate ions to the observed effects in the investigated hydration period.
Results in Figure 6 show that the presence of sulfate ions neutralises the effects of MK in MK- as well as [C3S + MK]-suspensions. We can expect that the pH, calcium concentration of the starting solution and also the MK-dosage may impact the magnitude of the observed effects. The following experiments address the influences of these parameters on the aqueous phase composition in detail.
After we demonstrated the effect of sulfate, we want to investigate in the following how pH and calcium ions of the starting solution as well as the MK-dosage influence the hydration of C3S- MK- and [C3S + MK]-suspensions in detail.
The impact of pH and calcium ion concentration of the starting solution on the hydration of MK is shown in Figure 7 for MK-suspensions (without C3S) that were hydrated in NaOH-solution. The already in Figure 6 presented data gathered in Ca(OH)2-solution with the same pH of 12.45 are shown for comparison.
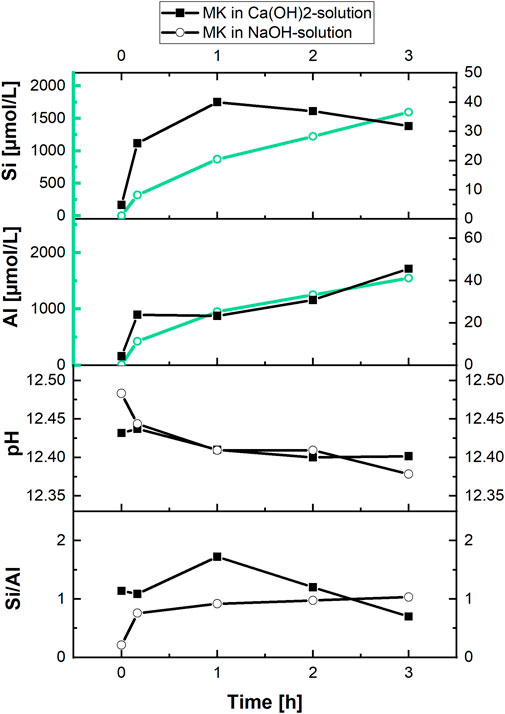
FIGURE 7. Silicate and aluminate concentrations as well as pH and Si/Al of the aqueous phase during reaction of MK in saturated Ca(OH)2—and NaOH-solution (both solutions: pH = 12.45, MK-dosage of 10.0 g/L).
We see that MK dissolves steadily over the reaction time and the measured silicate and aluminate concentrations are approx. 40 times higher in NaOH-solution as in Ca(OH)2-solution at the same pH. Thereby the pH slightly decreases similarly in both suspensions. Although slightly more silicate in relation to aluminate is accumulated in the aqueous phase after 10 min of reaction, the MK-dissolution is congruent in NaOH-solution as shown by the value of the Si/Al ratio of approx. 1.0 in Figure 7.
In Ca(OH)2-solution in contrast, the Si/Al ratio is varied and differs from a value of 1.0 already after 10 min of reaction. Therefore, precipitation reactions occur in Ca(OH)2-solution. The relatively low concentrations of silicate and aluminate in comparison to NaOH-solution as starting solution as well as the consumption of silicate and aluminate during the early reaction of MK in Ca(OH)2-solution underline the impact of calcium ions on the reaction of MK. In particular, an early reaction of MK and interaction of the ions released (Si, Al) with calcium and hydroxide from the starting solution is well documented by the results in Figure 7.
To further elucidate the impact of calcium ions and pH of the starting solution on the reactivity of MK, experiments with semi-saturated Ca(OH)2-solution with C3S, MK and [C3S + MK] were conducted. Results of MK-suspensions hydrated in semi-saturated and saturated Ca(OH)2-solution are presented in Figure 8A for MK-dosages of 5 g/L and 15 g/L (l/s = 200 and 67 respectively).
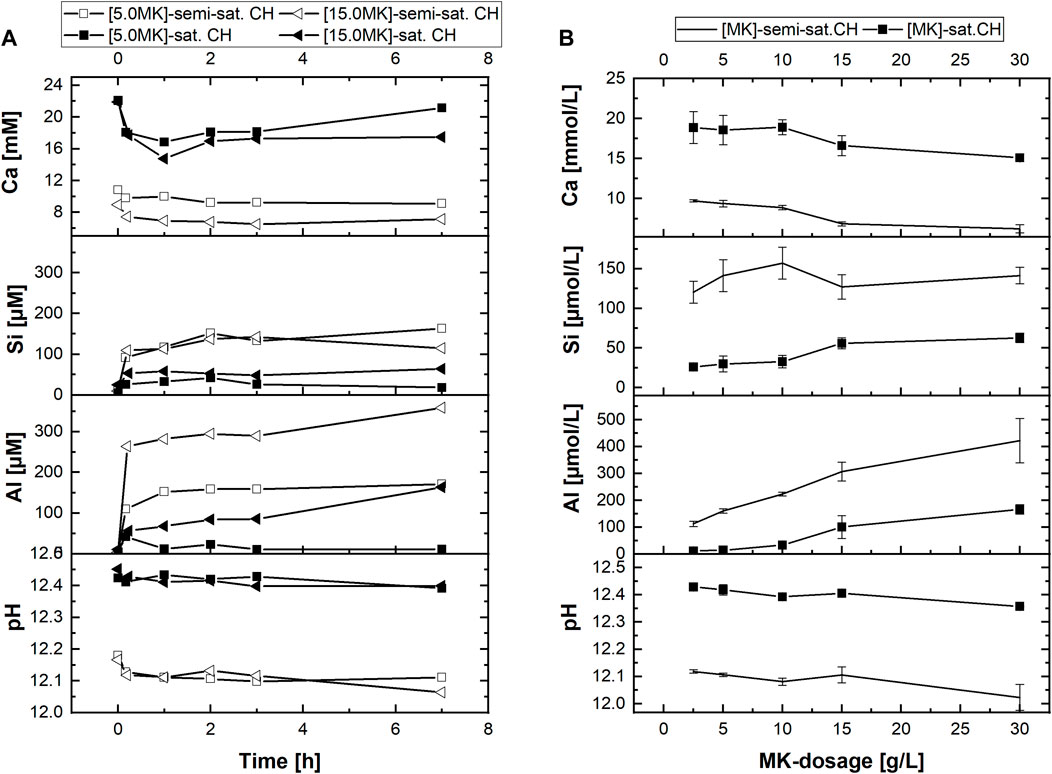
FIGURE 8. Calcium, silicate and aluminate concentrations as well as pH of the aqueous phase during reaction of MK in filtered semi- and saturated Ca(OH)2—solution in dependence of (A) reaction time exemplarily for MK-dosages of 5.0 g/L and 15.0 g/L and (B) MK-dosage given as mean values between 1 h and 7 h of reaction for different MK-dosages.
Within the investigated 7 h of reaction, only a slight decrease of the pH with proceeding hydration is observed in Figure 8A. The calcium concentration drops in both starting solutions (semi-saturated and saturated Ca(OH)2-solution) after 10 min of reaction. Afterwards, the calcium concentration remains stable at this level if semi-saturated Ca(OH)2-solution is used as starting solution. In contrast, in saturated Ca(OH)2-solution and at lower MK-dosages (5 g/L), an increase in calcium concentration with time is observed. This effect indicates that the initially consumed calcium ions are in part released by the MK during later reaction. In both solutions, the variation of calcium concentrations correlates with the MK-dosage.
Compared to the experiments conducted in saturated Ca(OH)2-solution, higher silicate and aluminate concentrations are measured in semi-saturated Ca(OH)2-solutions as provided in Figure 8A. Thereby, the aluminate concentrations are approx. 2 times higher than the silicate concentrations. This shows that MK also dissolves incongruently in semi-saturated solution such as in saturated Ca(OH)2-solutions. The dependency of the aqueous phase composition on the MK-dosage is further evaluated by additional experiments. In Figure 8B, the mean values of the measured concentrations are plotted against the investigated MK-dosages. The data points in Figure 8B correspond to the mean value of the ion concentration between 1 h, 2 h, 3 h and 7 h of reaction.
Results in Figure 8B document that increasing MK-dosages to either semi-saturated or saturated Ca(OH)2-solution leads to slightly decreasing pH. The calcium ion concentration decreases with increasing MK-dosage, whereby this effect is stronger in saturated Ca(OH)2-solution as in semi-saturated Ca(OH)2-solution. The silicate concentration in the aqueous phase increases with increasing dosage of MK (Figure 8B), which is more pronounced with saturated Ca(OH)2-solution as starting solution. Similar trends are observed for the aluminate concentrations. However, the low standard deviation of the mean values shows that aluminate concentrations form a plateau, i.e., the variation between 1 h and 7 h of hydration is low (cf. Figure 8A). The results in Figure 8 prove that the concentration of silicate and aluminate in the aqueous phase increases with decreasing calcium and hydroxide concentration of the starting solution. Additionally, the silicate and aluminate concentrations increase with increasing MK-dosage.
Finally, we investigated if the impact of the calcium and hydroxide concentration of the starting solution that we found in MK-suspensions is also observed when C3S is present in the suspension. For this purpose, the aqueous phase composition of C3S- and [C3S + MK]-suspensions started in semi-saturated Ca(OH)2-solution are analysed and provided in Figure 9 for MK-dosages of 2.5 g/L and 10.0 g/L. The data of the MK-suspension shown in Figure 7 is additionally given for comparison. Results show that the plateau period of the calcium concentration, which is associated with C-S-H formation, is shorter in semi-saturated Ca(OH)2-solution than in saturated Ca(OH)2-solution (Figure 9, 0.5 h respectively 3 h). At the same time the silicate concentration is higher in semi-saturated Ca(OH)2-solution than in saturated Ca(OH)2-solution. Afterwards, the silicate concentration decreases and calcium as well as pH increase. These properties of the aqueous phase are in accordance to earlier findings (Barret and Bertrandie, 1986; Sowoidnich et al., 2019).
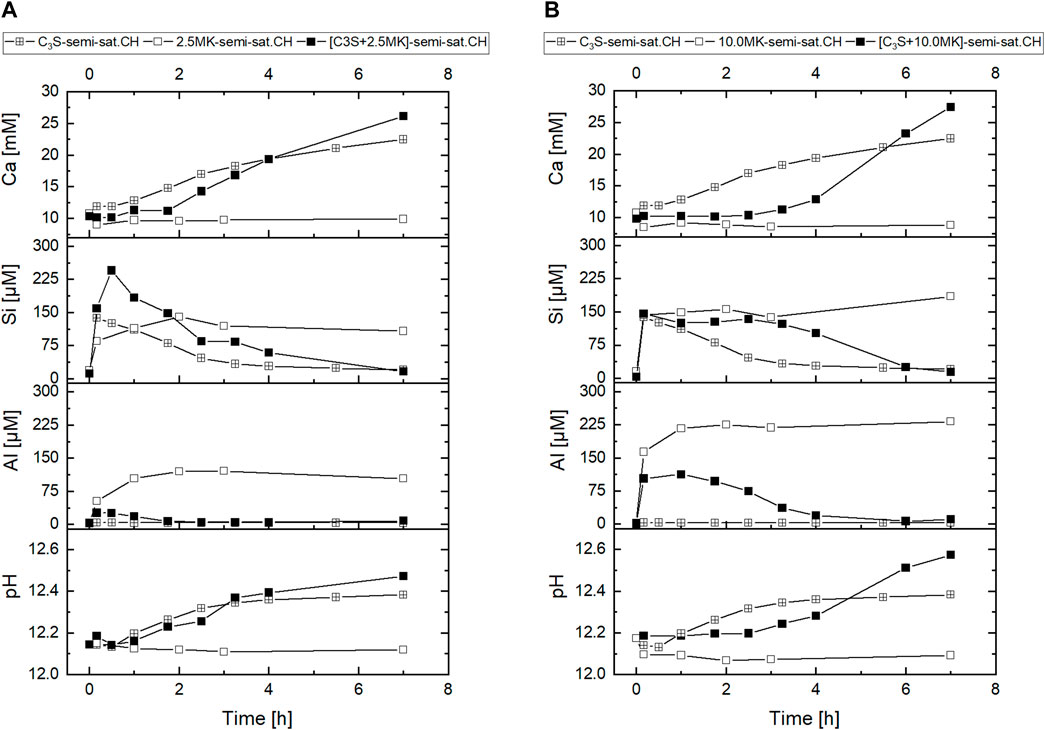
FIGURE 9. Calcium, silicate and aluminate concentrations as well as pH of the aqueous phase during hydration of [C3S + MK] in semi-saturated Ca(OH)2-solution at MK-dosage of 2.5 g/L (A) and 10.0 g/L (B).
The addition of MK to the C3S-suspension prolongs the plateau period of the calcium concentration and the pH from 0.5 h (C3S-suspension) to 1.75 h ([C3S + MK]-suspension started in semi-saturated Ca(OH)2-solution) respectively 2.5 h ([C3S + MK]-suspension started in saturated Ca(OH)2-solution). The silicate concentration shows a peak at 0.5 h ([C3S + MK]-suspension started in semi-saturated Ca(OH)2-solution) respectively a plateau ([C3S + MK]-suspension started in saturated Ca(OH)2-solution) instead of a decrease after the maximum as in the C3S-suspension. In the MK-suspension without C3S, similar silicate concentrations are measured as in [C3S + MK]-suspension with a MK-dosage of 10.0 g/L.
But at a MK-dosage of 2.5 g/L higher silicate concentrations are measured in the [C3S + MK]-suspension that exceed the respective values of the C3S- and MK-suspensions. In the [C3S + MK]-suspensions the silicate concentration decreases after 3 h of hydration but not in the MK-suspensions. In contrast, the aluminate concentration is lower in [C3S + MK]-suspension than in MK-suspension and decreases from the maximum value during hydration whereas in MK-suspension the aluminate concentration remains constant within the investigated period. After 7 h, no aluminate is measured in the aqueous phase of the [C3S + MK]-suspension anymore. Therefore, the results confirm that MK similarly influences the aqueous phase of MK- and [C3S + MK]-suspensions in the early hydration.
The results indicate that the aqueous phase composition of [C3S + MK]-suspensions is influenced by the pH and the calcium concentration of the starting solution, which is previously shown by results gathered in MK-suspension (Figure 8). Although the silicate concentrations reach a high level, the consumption of silicate is slower when aluminate is present in the aqueous phase with a dependency on the calcium ion concentration of the starting solution. In the presence of aluminate, the hydration proceeds at lower rate in the first hours.
The results show that in the presence of calcium ions in the aqueous phase the reaction of MK proceeds via a dissolution-precipitation process, and that the rate of the overall reaction is controlled by the following reaction steps.
1) MK-dissolution induced by hydroxide ions.
In comparison to the reaction in NaOH-solution at the same pH approx. 12 times less silicate is accumulated in the aqueous phase when calcium ions are present in the solution already after 10 min. Later on, approx. 40 times more silicate and aluminate are measured in NaOH. Whereas a formation of alumo-silicate networks (N-A-S-H) is not expected at such relatively low pH (Xu and Van Deventer, 2000; Granizo et al., 2002), short reaction time, Si/Al≈1.0 (congruent dissolution) (Buchwald et al., 2003; Werling et al., 2020; Werling et al., 2022), the results gathered with NaOH-solution mainly reflect the first step of the MK reaction, i.e., pure MK-dissolution. Thereby, the hydroxide ions induce the dissolution of MK (Granizo et al., 2014), and the cations act in the subsequent step (charge balance of the monomers/oligomers of silicate-aluminate units).
2) Formation of C-A-S-H at the MK-surface in the absence of sulfate
If hydroxide would be the only controlling parameter, then identical dissolution should be obtained when calcium ions are the cations instead of sodium. Therefore, the lower concentration of silicate and aluminate ions in the presence of calcium ions in combination with a consumption of calcium ions in the aqueous phase show a precipitation reaction, which follows the initial period of pure dissolution. Similar to C-S-H, low degrees of supersaturation are sufficient for the precipitation of C-A-S-H because of its low solubility (see below).
This is analogue to the observation that the presence of calcium ions in alkali activated binders leads to decreased ion concentrations in the aqueous phase during solubility tests, which was explained by the formation of C-A-S-H (Buchwald et al., 2003). Furthermore, the observation of low ion concentrations in the aqueous phase compared to the hydration in NaOH and low hydration degree may reflect that the C-A-S-H precipitation occurs at the MK-surface. Because if this reaction would occur in distance to MK-surfaces, we would expect an enhanced reaction progress stimulated by the hydroxide ions. Obviously, this is observed for C3S in the presence of MK at later hydration stages, known as the filler effect (Berodier and Scrivener, 2014) and shown in Figure 2. In this case, the filler provides nucleation and growth sites for C-S-H that forms from C3S hydration. Therefore, it is very likely that MK-particles are separated from the aqueous phase by C-A-S-H.
3) Formation of C-S-H and ettringite/AFm in the presence of sulfate
The presence of sulfate in MK-suspensions leads to a significant difference of the aqueous phase composition especially with respect to silicate and aluminate. In this case, identical concentrations are measured as in the aqueous phase of C3S suspensions. That is mainly due to the strong interaction between sulfate and aluminate that form ettringite or AFm as shown for [C3S + MK]-pastes in Figure 3 and as suggested before (Dhoopadahalli et al., 2020). This variation of the aluminate pathway is connected to a faster reaction of C3S as shown in Figures 2, Figure 6.
Following these arguments in favour for the formation of C-A-S-H at the C3S- and MK-surface, the interaction between calcium, silicate, aluminate and hydroxide observed in different starting solutions (semi-saturated and saturated Ca(OH)2-solution) can be explained. Also, the observed impact of the MK-dosage on the ion concentrations (Figure 8) can be understood as it is the result of the sequence of the proposed reaction steps. The increasing silicate and aluminate concentrations in the aqueous phase of MK-suspensions with increasing MK-dosage are most probably the result of the addition of an increasing number of reaction sites at MK-particles for hydroxide ions. This reaction occurs fast within 10 min of the investigated sampling periods (Figure 8). The reaction with calcium ions is subsequent and limits the amount of accumulated ions (Figure 7) with a direct dependency on the calcium concentration of the contiguous solution (Figure 8).
Since the direct detection of C-A-S-H at the MK surface is extremely challenging due to the expected low amounts of C-A-S-H with respect to the bulk MK at which it is formed, the arguments for the formation of C-A-S-H at the MK-surface are strengthened by checking whether the aqueous phase is in equilibrium with well-known phases. For this purpose, the aqueous phase composition is used to calculate the saturation index with respect to calcium-aluminate-hydrate (hydroxy-AFm, Ca4Al2(OH)14(H2O)12) and a tobermorite-type C-S-H [(CaO)1.5(SiO2) (H2O)2.5] as well as strätlingite (Ca2Al2SiO7(H2O)8) and hydrogarnet (Ca3Al2O6(SiO2)0.41(H2O)5.18) as representatives for C-A-S-H phases. Calculations were carried out for [MK]- and [C3S + MK]-suspensions hydrated in semi- and saturated Ca(OH)2-solution at a MK-dosage of 10 g/L. Calculated saturation indices are shown in Figure 10.
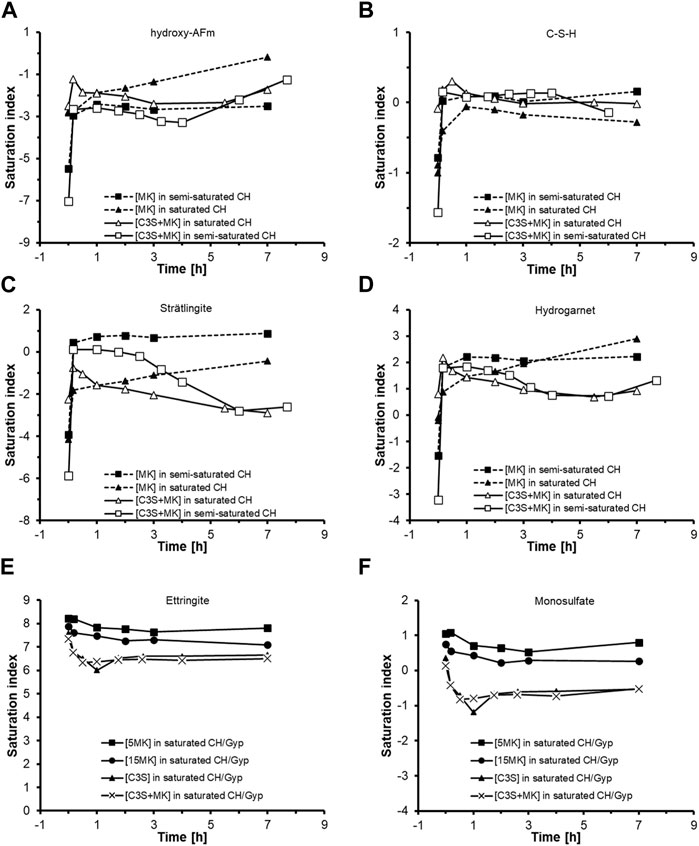
FIGURE 10. Saturation index of (A) hydroxy-AFm (Ca4Al2(OH)14(H2O)12), (B) C-S-H ((CaO)1.5(SiO2) (H2O)2.5), (C) strätlingite (Ca2Al2SiO7(H2O)8) and (D) hydrogarnet (Ca3Al2O6(SiO2)0.41(H2O)5.18) using the aqueous phase composition of suspensions made of MK or [C3S + MK] starting in semi- and saturated Ca(OH)2-solutions at a MK-dosage of 10 g/L. The saturation index of (E) ettringite and (F) monosulfate (AFm) was calculated only for the suspensions hydrated in saturated Ca(OH)2-CaSO4-solutions.
Results in Figure 10A show that the aqueous phase is undersaturated with respect to calcium-aluminate-hydrate during the reactions of MK- and of [C3S + MK]-suspensions started in semi- and saturated Ca(OH)2-solutions. Only after 7 h of reaction the aqueous phase of the MK-suspension reaches equilibrium with respect to hydroxy-AFm. Saturation index for C-S-H shown in Figure 10B indicates that already after few minutes of hydration the aqueous phase of the suspensions is in equilibrium with the considered C-S-H. Only the MK-suspension hydrated in saturated Ca(OH)2-solution lies slightly below the equilibrium conditions.
Strätlingite is only likely to form in the MK-suspension started in semi-saturated Ca(OH)2-solution (up to 7 h) and in the [C3S + MK]-suspension with semi-saturated Ca(OH)2-solution (up to 2-3 h) as shown by saturation values >0 (Figure 10C). In the other samples shown in Figure 10C, the aqueous solution is undersaturated with respect to strätlingite. Thus, it is unlikely that strätlingite has formed in these samples in the early hydration period, which is in accordance with the known instability of strätlingite in solutions that are rich in lime (Okoronkwo and Glasser, 2016). Analogous to the situation for C-S-H presented in Figure 10B, the aqueous phase is supersaturated with respect to hydrogarnet as can be seen in Figure 10D. Thereby, the [C3S + MK] sample hydrated in saturated Ca(OH)2-solution shows lower values of supersaturation as compared to the MK-suspensions.
From the calculations conducted in Figures 10A–D, it can be concluded that the supersaturation of the aqueous phase with respect to the hydrates increases in the sequence: hydroxy-AFm < strätlingite < C-S-H < hydrogarnet. This finding suggests that the formation of a C-A-S-H phase in these experimental conditions is thermodynamically possible. The formation of ettringite and AFm are also possible in the MK-suspensions hydrated in saturated Ca(OH)2-CaSO4-solutions as starting solutions as shown in Figure 10E,F. When C3S is present in these suspensions, the aqueous phase is supersaturated with respect to ettringite but slightly undersaturated with respect to AFm, see Figure 10E,F. The detection of ettringite shown in Figure 3 agrees with the calculated saturation index in Figure 10E,F.
The data is used in the following to define the chemical composition and solubility product of C-A-S-H that is specifically in temporary equilibrium with the aqueous phase according to our proposed reaction mechanism. It should be noted that we use the concept of equilibrium being established by dissolution and precipitation reactions in the limited time period of the early hydration. Later on, the aqueous phase is additionally controlled by other phases. For the examination below, it is assumed that silicate is substituted by aluminate at a ratio of 1/4 in C-A-S-H phases (Andersen et al., 2006; Hong and Glasser, 2002; L'Hôpital et al., 2015; Avet et al., 2019). This equilibrium reaction can be written as:
Eq. (2):
The solubility constant of this equilibrium yields:
Eq. (3):
The logarithm of the solubility constant gives.
Eq. (4):
Rearrangement of Eq. (4) yields:
Eq. (5):
After transformation of ion concentrations into ion activities using the Debye-Hückel approach (Debye and Hückel, 1923), (
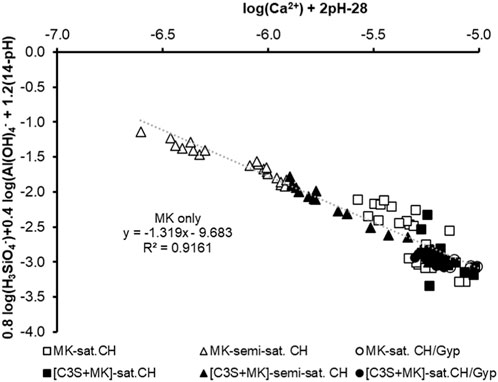
FIGURE 11. Equilibrium-plot of C-A-S-H using the measured ion concentrations of the aqueous phase of MK- and [C3S + MK]-suspensions with saturated (squares) and semi-saturated (triangles) Ca(OH)2-solutions as well as saturated Ca(OH)2-CaSO4-solutions as starting solution. The linear regression is calculated for the MK-data only.
Figure 11 shows that the data between 1 h and 7 h can be used to calculate the composition of C-A-S-H as defined in Eq. (5) with a slope of the linear regression of approx. 1.3, from which a C-A-S-H phase composition of (CaO)1.3(SiO2)0.8(Al2O3)0.2(H2O)2.7 is deduced. The calculated C/S ratio of approx. 1.3 is identical with the one calculated for metastable C-S-H (Sowoidnich et al., 2019). The intercept with the y-axis refers to the solubility product according to the defined equilibrium equation (Eq. 5) in Figure 11 and measures approx.—9.7.
Generally, the data scatter more when saturated Ca(OH)2-solution is used as starting solution and less when semi-saturated Ca(OH)2- or saturated Ca(OH)2-CaSO4-solutions are used as assumed from Figure 6. Although the data of the suspensions with C3S were not included in the regression, the aqueous phase of [C3S + MK]-suspensions shows similarities to the MK-suspensions. The performed calculation of the C-A-S-H properties provides evidence for the formation of C-A-S-H at the MK- and C3S surface based on its temporal equilibrium established by its dissolution and precipitation.
Results of the combined examination of C3S and MK in the absence of sulfate show the known retarding effect of MK on C3S hydration (Figure 2), which can be seen as the cause for the retarded cement hydration (Figure 1). The aqueous phase composition of [C3S + MK]-suspensions shows significant differences, but also similar trends as compared to the results gathered from the C3S- and MK-suspensions in the absence of either MK or C3S, respectively (Figure 6).
In all samples we observed an influence of the calcium ion concentration on the silicate and aluminate ion concentration of the aqueous phase. Also, the described impact of the MK-dosage on the aqueous phase composition is documented in the [C3S + MK]-suspensions. However, in saturated Ca(OH)2-solution as starting solution the silicate ion concentration increases in the first 10 min of hydration more strongly when both C3S and MK are hydrated simultaneously as compared to the case when C3S hydrates alone (Figure 6).
This is especially observed at lower MK-dosages and in semi-saturated Ca(OH)2-solution as starting solution. Then, the higher silicate ion concentrations remain constant for longer periods as in the case of the pure C3S hydration. The drop or decrease of the silicate ion concentration during the pure C3S hydration is caused by the precipitation of C-S-H (Barret and Bertrandie, 1986). Thus, the longer period at which the silicate concentration remains at high level is caused by a hindered nucleation and/or growth of a silicate containing phase especially C-S-H or C-A-S-H. The higher silicate concentration is accompanied by a high aluminate ion concentration. This indicates that an alternative or additional aluminate containing phase is also not formed in large amounts.
In the presence of sulfate, no aluminate is measured in the aqueous phase (Figure 6), which is caused by the formation of ettringite or AFm (Figure 3). From these experimental results we can deduce two conclusions. Firstly, it is very unlikely that the increased silicate and aluminate ion concentrations are the result of hindered dissolution (solubility) of C3S because decreased ion concentration should be measured when dissolution/solubility is reduced. Thus, the aluminate ions released by MK are not disturbing the C3S dissolution, which is in accordance to other findings derived from the addition of Al2(SO4)3 to C3S (Damidot et al., 2007; Tan et al., 2019). Instead, the precipitation reactions of C-A-S-H and C-S-H are strongly delayed. This is in contrast to other findings, where aluminate was seen as the parameter that strongly inhibits the C3S dissolution (Nicoleau et al., 2014; Pustovgar et al., 2017). Therefore, more work on this effect is needed.
Additionally, the increased silicate concentration for longer periods may signal that either C3S dissolution is accelerated and/or C-A-S-H is not a suitable substrate for C-S-H nucleation and growth confirming findings by others (Begarin, 2012; Haas and Nonat, 2015; Pustovgar et al., 2017). This argument is supported by the tests with gypsum solutions (Figure 2), whereby the presence of sulfate ions neutralises the retardation induced by MK. This effect is caused by the formation of ettringite and gypsum, i.e., alternative phases to C-A-S-H (Figure 3). As a consequence, more C-S-H can be formed, which accelerates the hydration as known from C-S-H seeding (John et al., 2018). SEM-micrographs (Figures 4, Figure 5) prove that MK serves as substrate for C-A-S-H. The increased total heat of the C3S pastes in the presence of MK may be seen as the stimulating effect of additionally provided surfaces for C-(A)-S-H, although this effect occurs at later hydration progress. This is significantly different as compared to the effect that calcite shows, i.e., acceleration in the early stages of hydration (Lothenbach et al., 2011; Berodier and Scrivener, 2014; Skibsted and Snellings, 2019; Panesar and Zhang, 2020).
The gathered results can be summarized as follows.
- The time dependent development of pH, calcium, silicate and aluminate ions shows the precipitation of C-A-S-H phases with the composition (CaO)1.3(SiO2)0.8(Al2O3)0.2(H2O)2.7 and a logK = −9.7 within minutes. This is observed in MK-mixtures with and without C3S.
- The early hydration kinetics of C3S and MK is reduced by the formation of this early form of C-A-S-H.
- C-A-S-H is not an efficient substrate for C-S-H nucleation and growth as deduced from the neutralising effect of the retardation by sulfate that binds aluminate in different phases to C-A-S-H as AFt or AFm and thereby accelerates the hydration.
- The formation of C-A-S-H additionally to C-S-H reduces its amount during early hydration. As C-S-H cannot nucleate and grow heterogeneously on C-A-S-H, lower amounts of C-S-H seeds lengthen the induction period as seen by the increased duration at which the silicate and aluminate concentrations remain at high level in [C3S + MK]-suspensions in comparison to the individual material systems.
- The high silicate ion concentrations in the aqueous phase of [C3S + MK]-suspensions, which exceed the values when C3S and MK are suspended in the same starting solutions separately, prove that the dissolution of C3S and/or MK is not hindered. Aluminate ions are therefore not rate limiting for C3S/MK-dissolution.
- The formation of C-A-S-H at the C3S surface can be seen as the cause for the retardation when MK is present, and C-S-H (with low amounts of Al) acts as the trigger for the ongoing hydration.
The original contributions presented in the study are included in the article/supplementary material, further inquiries can be directed to the corresponding author.
TS: Conceptualization, Methodology, Investigation, Data analysis, Writing-Original Draft. HC: Conceptualization, Data analysis, Funding acquisition, Review and Editing. CR: Investigation, Data analysis, Review and Editing. DD: Conceptualization, Data analysis, Review and Editing. H-ML: Conceptualization, Funding acquisition, Review and Editing, Supervision, Project administration.
The authors appreciate the financial support from the Deutsche Forschungsgemeinschaft (DFG) (project number 401097244 (LU 1652/35-1 and CO 194/23-1). The open access publication fees were covered by IMT Nord Europe, which is greatly acknowledged by the authors.
The authors declare that the research was conducted in the absence of any commercial or financial relationships that could be construed as a potential conflict of interest.
The handling editor LV declared a past co-authorship with the author TS.
All claims expressed in this article are solely those of the authors and do not necessarily represent those of their affiliated organizations, or those of the publisher, the editors and the reviewers. Any product that may be evaluated in this article, or claim that may be made by its manufacturer, is not guaranteed or endorsed by the publisher.
Andersen, M. D., Jakobsen, H. J., and Skibsted, J. (2006). A new aluminium-hydrate species in hydrated Portland cements characterized by 27Al and 29Si MAS NMR spectroscopy. Cem. Concr. Res. 36 (1), 3–17. doi:10.1016/j.cemconres.2005.04.010
Andrade Neto, J. d. S., De la Torre, A. G., and Kirchheim, A. P. (2021). Effects of sulfates on the hydration of Portland cement – a review. Constr. Build. Mater. 279, 122428. doi:10.1016/j.conbuildmat.2021.122428
Andrade Neto, J. S., de Matos, P. R., De la Torre, A. G., Campos, C. E., Torres, S. M., Monteiro, P. J., et al. (2022). Hydration and interactions between pure and doped C3S and C3A in the presence of different calcium sulfates. Cem. Concr. Res. 159, 106893. doi:10.1016/j.cemconres.2022.106893
Antoni, M., Rossen, J., Martirena, F., and Scrivener, K. (2012). Cement substitution by a combination of metakaolin and limestone. Cem. Concr. Res. 42 (12), 1579–1589. doi:10.1016/j.cemconres.2012.09.006
Avet, F., Boehm-Courjault, E., and Scrivener, K. (2019). Investigation of C-A-S-H composition, morphology and density in limestone calcined clay cement (LC3). Cem. Concr. Res. 115, 70–79. doi:10.1016/j.cemconres.2018.10.011
Avet, F., Li, X., Ben Haha, M., Bernal, S. A., Bishnoi, S., Cizer, Ö., et al. (2022). Report of RILEM TC 267-TRM phase 2: Optimization and testing of the robustness of the R3 reactivity tests for supplementary cementitious materials. Mater. Struct. 55 (3), 92. doi:10.1617/s11527-022-01928-6
Avet, F., Snellings, R., Alujas Diaz, A., Ben Haha, M., and Scrivener, K. (2016). Development of a new rapid, relevant and reliable (R3) test method to evaluate the pozzolanic reactivity of calcined kaolinitic clays. Cem. Concr. Res. 85, 1–11. doi:10.1016/j.cemconres.2016.02.015
Barret, P., and Bertrandie, D. (1986). Fundamental hydration kinetic features of the major cement constituents: Ca[3]SiO[5] and beta Ca[2]SiO[4]. J. de chimie physique 83 (11-12), 765–775. doi:10.1051/jcp/1986830765
Barret, P., and Ménétrier, D. (1980). Filter dissolution of C3S as a function of the lime concentration in a limited amount of lime water. Cem. Concr. Res. 10 (4), 521–534. doi:10.1016/0008-8846(80)90096-4
Begarin, F. (2012). Etude de parametres endogenes et exogenes au ciment portland ordinaire influencant L'hydratation de sa phase principale: Le silicate tricalcique. Dijon: Universite de Bourgogne, 225.
Begarin, F., Garrault, S., Nonat, A., and Nicoleau, L. (2011). Hydration of alite containing aluminium. Adv. Appl. Ceram. 110 (3), 127–130. doi:10.1179/1743676110y.0000000007
Bernal, I. M. R., Aranda, M. A. G., Santacruz, I., De la Torre, A. G., and Cuesta, A. (2022). Early-age reactivity of calcined kaolinitic clays in LC3 cements: A multitechnique investigation including pair distribution function analysis. J. Sustain. Cement-Based Mater., 1–15. doi:10.1080/21650373.2022.2117248
Berodier, E., and Scrivener, K. (2014). Understanding the filler effect on the nucleation and growth of C-S-H. J. Am. Ceram. Soc. 97 (12), 3764–3773. doi:10.1111/jace.13177
Buchwald, A., Hohmann, M., Posern, K., and Brendler, E. (2009). The suitability of thermally activated illite/smectite clay as raw material for geopolymer binders. Appl. Clay Sci. 46 (3), 300–304. doi:10.1016/j.clay.2009.08.026
Buchwald, A., Kaps, C., and Hohmann, M. (2003). “Alkali-activated binders and pozzolan cement binders - compete binder reaction or two sides of the same story,” in 11th International Congress on the Chemistry of Cement (ICCC) (Durban, South Africa).
Chen, Y., Romero Rodriguez, C., Li, Z., Chen, B., Çopuroğlu, O., and Schlangen, E. (2020). Effect of different grade levels of calcined clays on fresh and hardened properties of ternary-blended cementitious materials for 3D printing. Cem. Concr. Compos. 114, 103708. doi:10.1016/j.cemconcomp.2020.103708
Cook, R., Ma, H., and Kumar, A. (2019). Influence of size-classified and slightly soluble mineral additives on hydration of tricalcium silicate. J. Am. Ceram. Soc. 103 (4), 2764–2779. doi:10.1111/jace.16936
Damidot, D., Bellmann, F., Möser, B., and Sowoidnich, T. (2007). Calculation of the dissolution rate of tricalcium silicate in several electrolyte compositions. Cem. Wapno Beton 12/74 (2), 57–67.
Darweesh, H. H. M. (2004). Limestone as an accelerator and filler in limestone-substituted alumina cement. Ceram. Int. 30 (2), 145–150. doi:10.1016/s0272-8842(03)00073-7
Debye, P., and Hückel, E. (1923). Zur Theorie der Elektrolyte. I. Gefrierpunktserniedrigung und verwandte Erscheinungen. Phys. Z. 24, 185–206.
Dhoopadahalli, G. R., Krishnan, S., and Bishnoi, S. (2020). “Influence of calcium sulphate on hydration of cements containing calcined clay,” in Calcined clays for sustainable concrete (Singapore: Springer Singapore).
Ez-zaki, H., Marangu, J. M., Bellotto, M., Dalconi, M. C., Artioli, G., and Valentini, L. (2021). A fresh view on limestone calcined clay cement (LC3) pastes. Materials 14 (11), 3037. doi:10.3390/ma14113037
Gartner, E. (2012). Are there any practical alternatives to the manufacture of Portland cement clinker? J. Chin. Ceram. Soc. 40 (1), 61–68.
Granizo, M. L., Alonso, S., Blanco-Varela, M. T., and Palomo, A. (2002). Alkaline activation of metakaolin: Effect of calcium hydroxide in the products of reaction. J. Am. Ceram. Soc. 85 (1), 225–231. doi:10.1111/j.1151-2916.2002.tb00070.x
Granizo, N., Palomo, A., and Fernandez-Jiménez, A. (2014). Effect of temperature and alkaline concentration on metakaolin leaching kinetics. Ceram. Int. 40 (7), 8975–8985. Part A. doi:10.1016/j.ceramint.2014.02.071
Gutteridge, W. A., and Dalziel, J. A. (1990). Filler cement: The effect of the secondary component on the hydration of Portland cement. Cem. Concr. Res. 20 (5), 778–782. doi:10.1016/0008-8846(90)90011-l
Haas, J., and Nonat, A. (2015). From C–S–H to C–A–S–H: Experimental study and thermodynamic modelling. Cem. Concr. Res. 68 (0), 124–138. doi:10.1016/j.cemconres.2014.10.020
Hanein, T., Thienel, K. C., Zunino, F., Marsh, A. T. M., Maier, M., Wang, B., et al. (2021). Clay calcination technology: State-of-the-art review by the RILEM TC 282-CCL. Mater. Struct. 55 (1), 3. doi:10.1617/s11527-021-01807-6
He, C., Osbaeck, B., and Makovicky, E. (1995). Pozzolanic reactions of six principal clay minerals: Activation, reactivity assessments and technological effects. Cem. Concr. Res. 25 (8), 1691–1702. doi:10.1016/0008-8846(95)00165-4
Hong, S.-Y., and Glasser, F. P. (2002). Alkali sorption by C-S-H and C-A-S-H gels: Part II. Role of alumina. Cem. Concr. Res. 32 (7), 1101–1111. doi:10.1016/s0008-8846(02)00753-6
John, E., Matschei, T., and Stephan, D. (2018). Nucleation seeding with calcium silicate hydrate – a review. Cem. Concr. Res. 113, 74–85. doi:10.1016/j.cemconres.2018.07.003
Kumar, A., Oey, T., Falzone, G., Huang, J., Bauchy, M., Balonis, M., et al. (2017). The filler effect: The influence of filler content and type on the hydration rate of tricalcium silicate. J. Am. Ceram. Soc. 100 (7), 3316–3328. doi:10.1111/jace.14859
L'Hôpital, E., Lothenbach, B., Le Saout, G., Kulik, D., and Scrivener, K. (2015). Incorporation of aluminium in calcium-silicate-hydrates. Cem. Concr. Res. 75, 91–103. doi:10.1016/j.cemconres.2015.04.007
Lapeyre, J., and Kumar, A. (2018). Influence of pozzolanic additives on hydration mechanisms of tricalcium silicate. J. Am. Ceram. Soc. 101 (8), 3557–3574. doi:10.1111/jace.15518
Lerch, W. (1946). The influence of gypsum on the hydration and properties of Portland cement pastes. Pennsylvania, USA: American Society for Testing Materials.
Lothenbach, B., Scrivener, K., and Hooton, R. D. (2011). Supplementary cementitious materials. Cem. Concr. Res. 41 (12), 1244–1256. doi:10.1016/j.cemconres.2010.12.001
Makar, J. M., Beaudoin, J. J., Trischuk, K., Chan, G. W., and Torres, F. (2012). Effect of n-CaCO 3 and metakaolin on hydrated Portland cement. Adv. Cem. Res. 24 (4), 211–219. doi:10.1680/adcr.11.00010
Menéndez, G., Bonavetti, V., and Irassar, E. F. (2003). Strength development of ternary blended cement with limestone filler and blast-furnace slag. Cem. Concr. Compos. 25 (1), 61–67. doi:10.1016/s0958-9465(01)00056-7
Mounanga, P., Khokhar, M. I. A., El Hachem, R., and Loukili, A. (2011). Improvement of the early-age reactivity of fly ash and blast furnace slag cementitious systems using limestone filler. Mater. Struct. 44 (2), 437–453. doi:10.1617/s11527-010-9637-1
Nancy Beuntner, R. S., Karl-Christian, T., and Thienel, K. C. (2019). Potential of calcined mixed-layer clays as pozzolans in concrete. ACI Mater. J. 116 (4). doi:10.14359/51716677
Nicoleau, L., Schreiner, E., and Nonat, A. (2014). Ion-specific effects influencing the dissolution of tricalcium silicate. Cem. Concr. Res. 59 (0), 118–138. doi:10.1016/j.cemconres.2014.02.006
Okoronkwo, M. U., and Glasser, F. P. (2016). Stability of strätlingite in the CASH system. Mater. Struct. 49 (10), 4305–4318. doi:10.1617/s11527-015-0789-x
Panesar, D. K., and Zhang, R. (2020). Performance comparison of cement replacing materials in concrete: Limestone fillers and supplementary cementing materials – a review. Constr. Build. Mater. 251, 118866. doi:10.1016/j.conbuildmat.2020.118866
Phreeqc, (2021). PHREEQC version 3. http://wwwbrr.cr.usgs.gov/projects/GWC_coupled/phreeqc/
Pomakhina, E., Deneele, D., Gaillot, A. C., Paris, M., and Ouvrard, G. (2012). 29Si solid state NMR investigation of pozzolanic reaction occurring in lime-treated Ca-bentonite. Cem. Concr. Res. 42 (4), 626–632. doi:10.1016/j.cemconres.2012.01.008
Pustovgar, E., Mishra, R. K., Palacios, M., d'Espinose de Lacaillerie, J. B., Matschei, T., Andreev, A. S., et al. (2017). Influence of aluminates on the hydration kinetics of tricalcium silicate. Cem. Concr. Res. 100, 245–262. doi:10.1016/j.cemconres.2017.06.006
Skibsted, J., and Snellings, R. (2019). Reactivity of supplementary cementitious materials (SCMs) in cement blends. Cem. Concr. Res. 124, 105799. doi:10.1016/j.cemconres.2019.105799
Sowoidnich, T., Bellmann, F., Damidot, D., and Ludwig, H.-M. (2019). New insights into tricalcium silicate hydration in paste. J. Am. Ceram. Soc. 102 (5), 2965–2976.
Tan, H., Li, M., Ren, J., Deng, X., Zhang, X., Nie, K., et al. (2019). Effect of aluminum sulfate on the hydration of tricalcium silicate. Constr. Build. Mater. 205, 414–424. doi:10.1016/j.conbuildmat.2019.02.011
Taylor-Lange, S. C., Lamon, E. L., Riding, K. A., and Juenger, M. C. (2015). Calcined kaolinite–bentonite clay blends as supplementary cementitious materials. Appl. Clay Sci. 108, 84–93. doi:10.1016/j.clay.2015.01.025
Tironi, A., Trezza, M. A., Scian, A. N., and Irassar, E. F. (2012). Kaolinitic calcined clays: Factors affecting its performance as pozzolans. Constr. Build. Mater. 28 (1), 276–281. doi:10.1016/j.conbuildmat.2011.08.064
Valentini, L., Dalconi, M. C., Favero, M., Artioli, G., and Ferrari, G. (2015). In-situ XRD measurement and quantitative analysis of hydrating cement: Implications for sulfate incorporation in C–S–H. J. Am. Ceram. Soc. 98 (4), 1259–1264. doi:10.1111/jace.13401
Werling, N., Dehn, F., Krause, F., Steudel, A., Schuhmann, R., and Emmerich, K. (2020). Solubility of precursors and carbonation of waterglass-free geopolymers. Clays Clay Minerals 68 (5), 524–531. doi:10.1007/s42860-020-00096-4
Werling, N., Kaltenbach, J., Weidler, P. G., Schuhmann, R., Dehn, F., and Emmerich, K. (2022). Solubility of calcined kaolinite, montmorillonite, and illite in high molar NaOH and suitability as precursors for geopolymers. Clays Clay Minerals 70 (2), 270–289. doi:10.1007/s42860-022-00185-6
Xu, H., and Van Deventer, J. S. J. (2000). The geopolymerisation of alumino-silicate minerals. Int. J. Mineral Process. 59 (3), 247–266. doi:10.1016/s0301-7516(99)00074-5
Yanguatin, H., Tobón, J., and Ramírez, J. (2017). Reactividad puzolánica de arcillas caoliníticasuna revisión. Rev. Ing. Construccion 32 (2), 13–24. doi:10.4067/s0718-50732017000200002
Zunino, F., Dhandapani, Y., Ben Haha, M., Skibsted, J., Joseph, S., Krishnan, S., et al. (2022). Hydration and mixture design of calcined clay blended cements: Review by the RILEM TC 282-CCL. Mater. Struct. 55 (9), 234. doi:10.1617/s11527-022-02060-1
Zunino, F., and Scrivener, K. (2020). Factors influencing the sulfate balance in pure phase C3S/C3A systems. Cem. Concr. Res. 133, 106085. doi:10.1016/j.cemconres.2020.106085
Keywords: tricalcium silicate, retardation, C-A-S-H, C-S-H, metakaolin (MK)
Citation: Sowoidnich T, Cölfen H, Rößler C, Damidot D and Ludwig H-M (2023) The impact of metakaolin on the hydration of tricalcium silicate: effect of C-A-S-H precipitation. Front. Mater. 10:1159772. doi: 10.3389/fmats.2023.1159772
Received: 06 February 2023; Accepted: 18 April 2023;
Published: 28 April 2023.
Edited by:
Luca Valentini, University of Padua, ItalyReviewed by:
Xuerun Li, BASF, GermanyCopyright © 2023 Sowoidnich, Cölfen, Rößler, Damidot and Ludwig. This is an open-access article distributed under the terms of the Creative Commons Attribution License (CC BY). The use, distribution or reproduction in other forums is permitted, provided the original author(s) and the copyright owner(s) are credited and that the original publication in this journal is cited, in accordance with accepted academic practice. No use, distribution or reproduction is permitted which does not comply with these terms.
*Correspondence: T. Sowoidnich, dGhvbWFzLnNvd29pZG5pY2hAdW5pLXdlaW1hci5kZQ==
Disclaimer: All claims expressed in this article are solely those of the authors and do not necessarily represent those of their affiliated organizations, or those of the publisher, the editors and the reviewers. Any product that may be evaluated in this article or claim that may be made by its manufacturer is not guaranteed or endorsed by the publisher.
Research integrity at Frontiers
Learn more about the work of our research integrity team to safeguard the quality of each article we publish.