
94% of researchers rate our articles as excellent or good
Learn more about the work of our research integrity team to safeguard the quality of each article we publish.
Find out more
ORIGINAL RESEARCH article
Front. Mater., 18 May 2023
Sec. Mechanics of Materials
Volume 10 - 2023 | https://doi.org/10.3389/fmats.2023.1142683
This article is part of the Research TopicInnovators in Mechanics of MaterialsView all 7 articles
 Tao Zhao1,2,3
 Gaojian Hu4*
The relationship between the rock’s elastic modulus and deformation characteristics, affected by joint spacing and ductility, was not determined. This study investigates the size effect of the elastic modulus of rock with parallel joints using numerical simulation and regression analysis. The results showed an exponential relationship between elastic modulus and spacing of parallel joints and a negative exponential relationship between elastic modulus and rock size. The characteristic size of elastic modulus has a power function relationship with the parallel joints spacing, and the characteristic elastic modulus of rock has a power function relationship with the parallel joints spacing. The general and specific forms of these relationships are provided. Establishing these relationships allows for predicting and calculating the elastic modulus of the mine rock mass and serves as a reference for the deformation analysis of the rock.
The elastic modulus E) reflects the rock’s deformation characteristics, which are often related to the stress and existing joints on the rock. The joint changes the mechanical properties and reduces the strength of the rock. At the same time, the ductility and influence of a joint vary with its size. Therefore, it is necessary to investigate the effect of joints on E and determine its variation law with parallel joint spacing (PJS) and size, which is crucial for guiding safe mining and slope treatment analysis.
Elastic modulus represents the rock’s mechanical properties, and its value varies with rock type, material, confining pressure, and pore size. Scholars have conducted studies on this. For example, Wu et al. (2019a) described the relationship between E and confining pressure as a nonlinear function. Zhu et al. (2021) developed an empirical prediction model for defining the relationship between E and confining pressure. Wu et al. (2019b) investigated the impact of confining pressure on the anisotropy index of E based on the REV model. Niu et al. (2019) indicated that the width of the rock bridge correlates positively with Xia et al. (2021), explored the influence of coal seam dip angle, and demonstrated that E decreases as the dip angle rises. Yang et al. (2019a) determined the change rule of E with joint dip angle by investigating the interaction between the joint and tunnel. Jin et al. (2021) analyzed the change of sandstone’s dynamic deformation modulus under different impact velocities and built its empirical evolution model. Yin et al. (2020), Yin et al. (2014) examined coal rock’s dynamic compressive strength and full-field strain fields and derived its regular characteristics. These studies indicated that E is also anisotropic due to the heterogeneity of the rock. Because of the presence of joints, the joint inclination and width of the rock bridge will affect E, making the joint parameter a crucial factor affecting E.
Lin et al. (2020) analyzed the rock failure behavior with double circular hole joints under various joint parameters in the rock bridge length, joint spacing, and joint dip research. Yang et al. (2019b) and Huang et al. (2019) investigated the influence of joint parameters on E and indicated that joint dip has the greatest effect on E, followed by joint length. Chen et al. (2020) discovered that E is affected by the interaction of joints and rock bridges through the study of joint dip and spacing. Cao et al. (2018) reported that joint inclination mainly impacts E. Xiong et al. (2019) proposed a power function to characterize the nonlinear change of E and joint index. These studies demonstrated that joint inclination affects E, followed by joint length. Additionally, the joint spacing will affect E, but this is rarely mentioned.
Due to rock heterogeneity, E will be affected by changes in rock size. Scholars have studied macroscopic rock size, microscopic mineral particles, and height-diameter ratio. In the research on rock size, Yuanwei et al. (2019) analyzed the influence of gravel size on E using RFPA software. Liu et al. (2019a) indicated that multi-scale has the greatest impact on peak strength and E based on acoustic emission research. Wang et al. (2020) discovered that the smaller the initial crack density, the greater E. Dai et al. (2020) discussed the relationship between E and the slenderness ratio for the height-diameter ratio. Ma et al. (2021) explored the effect of the height-diameter ratio of coal petrography from 4:1 to 1:4 on Zhang et al. (2020), and Liu et al. (2019b) investigated the change in height-diameter ratio and concluded that E is positively correlated with height-diameter ratio. In the research of microscopic mineral particles, Han et al. (2019) demonstrated that the E of rocks decreases as particle size grows. Zhang et al. (2019) reported that rock E rises with the mineral ratio. These studies showed that E is affected by the rock size and the initial internal crack and increases with the height-diameter ratio. However, the specific relationship between E and rock size has not yet been determined.
Representative elementary volume (REV) is a critical issue in rock mechanics, which is very important for establishing mechanical models and analysis methods and determining mechanical parameters. Liang et al. (2019) introduced and examined the generalized RVE based on the anisotropy of naturally jointed rock masses. Chong et al. (2020) estimated that the rock mass REV is 10 m. Liang et al. (2013a) proposed a multi-scale rock mass engineering calculation method from the meso and macro levels. Liu et al. (2018) suggested a REV size evaluation method considering rock mass anisotropy. Hu and Ma (2021) determined the relationship between size and characteristic strength. As a mechanical parameter of rock, E also has REV. For example, Cui et al. (2020) suggested a method for determining the REV of the jointed rock mass. Loyola et al. (2021) introduced a new general technology for predicting the REV of E. Rarely do the above studies calculate for joint spacing and quantitatively analyze E.
Consequently, rock E is affected by the size change, whereas their specific relationship is still unclear. The change in joint spacing also affects E, but the impact is rarely discussed. When obtaining the REV of E, the impact of joint spacing is scarcely considered. Hence, by examining sizes and joint spacing, this study establishes the mathematical model of E and rock size and the model of CEM and PJS.
This study uses a numerical simulation of uniaxial compression with a scheme identical to Hu and Ma (2021). It explores the influence of rock size and PJS on the E of rock. The rock size grows from 100 to 1,200 mm in 7 groups. The spacing of parallel joints increases from 10 to 50 mm in 5 groups. The simulation schemes are listed in Table 1 (Hu and Ma, 2021).

TABLE 1. Research programs and working conditions.
2D numerical models are built in this study, such as model drawings with different dimensions of 100 mm, and the model drawings with PJS of 10 are selected as the example model, as depicted in Figure 1.
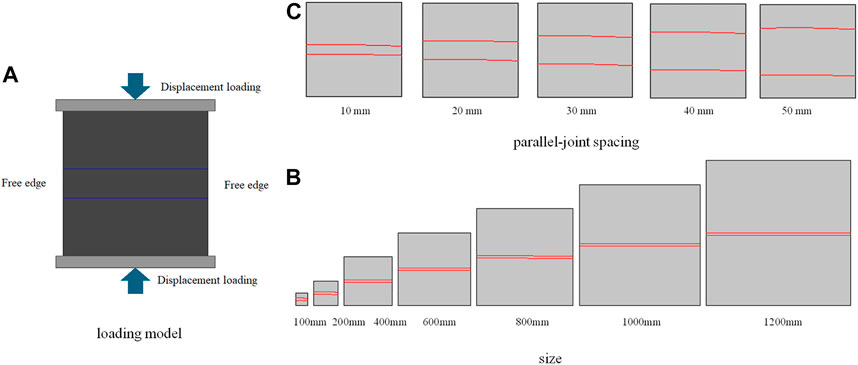
FIGURE 1. Loading model and dimensional models. (A) loading model; (B) size; (C) parallel-joint spacing.
In the loading model, the two model’s sides are free surfaces, and the upper and lower surfaces of the model bear loads. The displacement loading method with a loading increment of 0.01 mm is adopted. Table 2 lists the mechanical parameters used in the model.
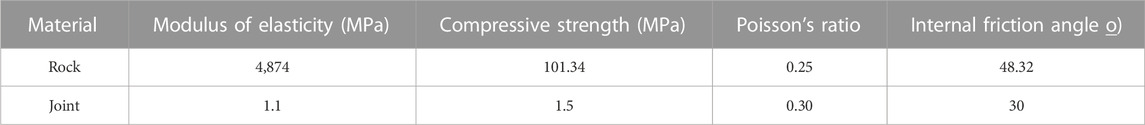
TABLE 2. Mechanical parameters of rock.
This study employs a numerical calculation method to simulate inhomogeneous materials. This approach considers material properties’ inhomogeneity and defect distribution’s randomness. It is assumed that the mechanical properties of the discretized mesoscopic elements follow Weibull distribution, and the relationship between mesoscopic and macroscopic rock mechanical properties is developed. The following describes Weibull statistical distribution function:
where α is the mechanical property parameters of rock element; α0 is the average value of mechanical property parameters of rock element; m is the uniformity coefficient of rock; φ(α) is the statistical distribution density of mechanical properties of rock elements.
The adopted failure criterion is the Mohr-Coulomb yield criterion.
where c is the cohesion; φ is the internal friction angle.
Figure 2 illustrates the stress-strain curves, while Table 3 shows the calculated compressive strength. In the elastic deformation stage of rock, based on the definition of E, its stress and strain become a positive proportional relationship, and the proportional coefficient is called E. Therefore, this research calculates the slope of its elastic deformation stage for each curve in Figure 2, as presented in Table 4.
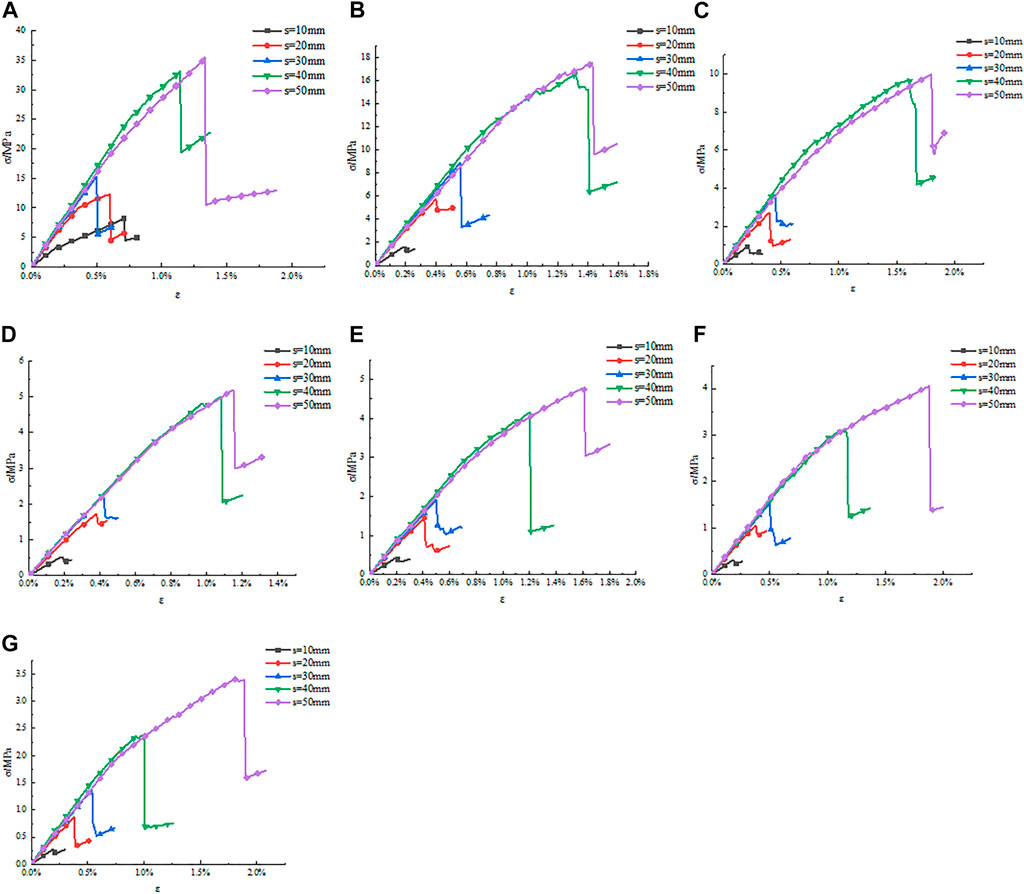
FIGURE 2. Stress-strain curves of rocks with sizes. (A) 100 mm; (B) 200 mm; (C) 400 mm; (D) 600 mm; (E) 800 mm; (F) 1,000 mm; (G) 1,200 mm.
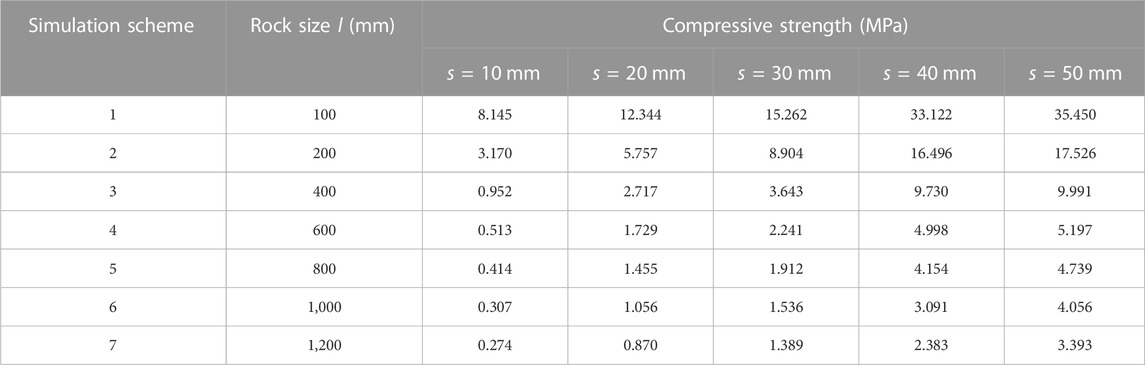
TABLE 3. Uniaxial compressive strength.
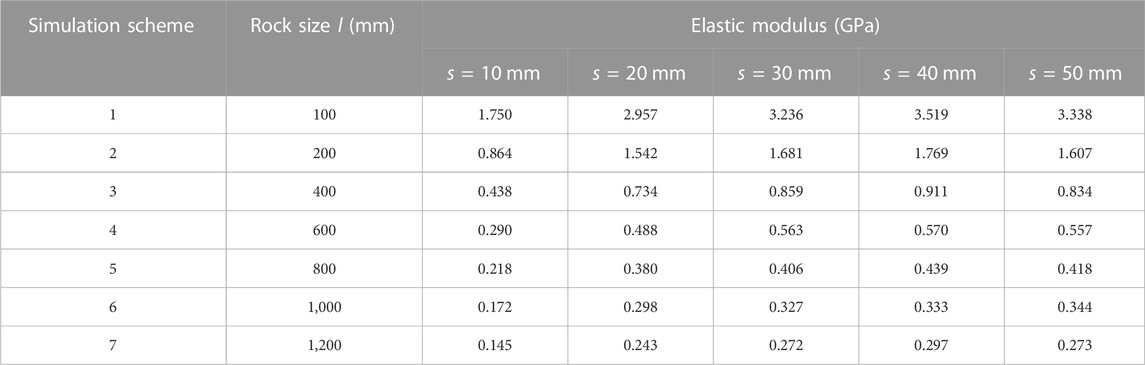
TABLE 4. Elastic modulus.
Figure 2 depicts the stress-strain curves of PJS with 35 working conditions, representing the changes in rock strength and E. It indicates that when the spacing between parallel joints is 10 mm, the strength is 0.274 MPa, and E is 0.145 GPa. As spacing rises, so do the strength and E. When the spacing reaches 50 mm, the strength improves to 3.393 MPa, and E increases to 0.273 GPa. This demonstrates that, as the PJS increases, so does its strength for a specific rock size, and the two are positively correlated. Its E will also gradually increase, and the two are positively correlated.
The impact of size change on E is then analyzed. A column of values with a 50 mm spacing between parallel joints listed in Tables 3, 4 is selected. When the rock size is 100 mm, the compressive strength is 35.45 MPa, and E is 3.338 GPa. With the increase in size, the strength and E decrease. When the size reaches 1,200 mm, the rock strength decreases to 3.393 MPa, and the rock E reduces to 0.273 GPa. This shows that the strength of rocks with specific joint spacing decreases with the rock size, and they are negatively correlated. Its E will also gradually decrease, and they are negatively correlated.
Therefore, E has a size effect, and the spacing of parallel joints in rock will influence its size effect relationship.
The above analysis indicates a relationship between E and PJS, and they are positively correlated. Figure 3 depicts the two variables’ scatter plots and fitting curves to better analyze their positive correlation.
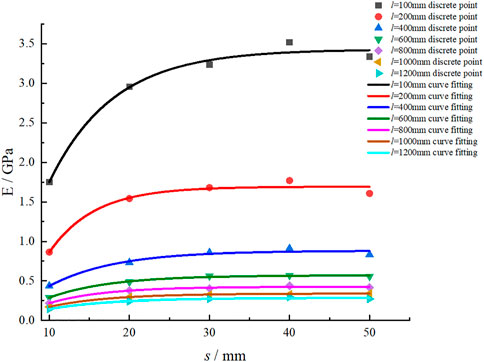
FIGURE 3. Fitting curves of rock E and PJS.
Figure 3 displays the relationship between E and PJS, which are positively correlated. It shows that the larger the rock size, the lower the curve, indicating that the rock size also has some influence on the curve. The relationship of each curve is regressed to analyze this effect better, as revealed in Table 5. The determination coefficients are 0.987, 0.973, 0.971, 0.993, 0.988, 0.998, and 0.975, all greater than 0.97, indicating that the curve fits quite well.
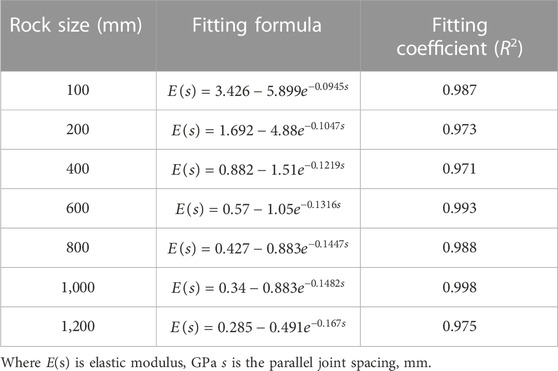
TABLE 5. Fitting relationship.
All of the curves in Table 5 are exponential functions, exhibiting that E and PJS can have an exponential relationship. Therefore, the following relationship is proposed:
where E(s) is elastic modulus, Gpa; s is parallel joint spacing, mm; a, b, and c are parameters.
Eq. 3 contains parameters a, b, and c that must be solved based on the specific rock properties. When the parameters for a specific rock are obtained, the E of the rock with any PJS can be calculated, which is of critical importance. The following describes how to solve the parameters.
Table 5 shows that a, b, and c are related to rock size and will change as rock size varies. Figure 4 regresses their relationships on this basis.
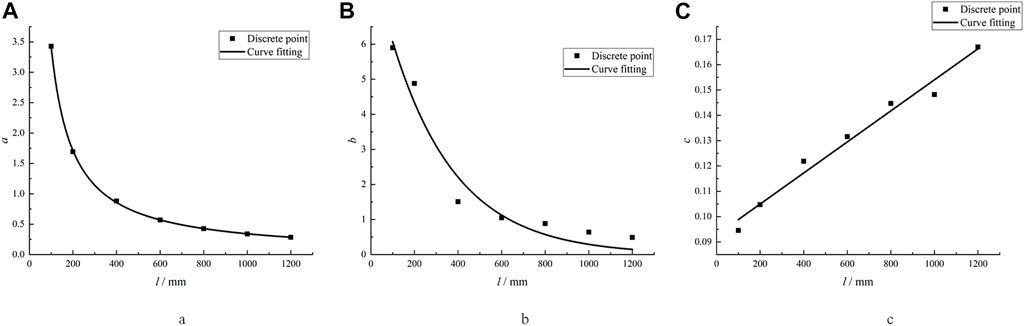
FIGURE 4. Fitting curve of parameters and rock size. (A) a; (B) b; (C) c.
The curve in Figure 4 represents the relationships between parameters a, b, c, and size, where parameter a is a power function of rock size, parameter b is an exponential function of size, and parameter c is a linear relationship of rock size. Therefore, their relationship is as follows:
Eq. 4 through Eq. 6 provide the relationship between parameters and size. Therefore, it can bring these three formulas into Eq. 3 to obtain the following relationship:
Rock size in Eq. 7 is a known quantity, so it defines a method for quantitative analysis of rock E. When a specific rock’s size is known, E under different PJS can be derived using Eq. 7, which is very convenient.
Based on the simulation results, considering the influence of size on E, the corresponding stress-strain curves are depicted in Figure 5.
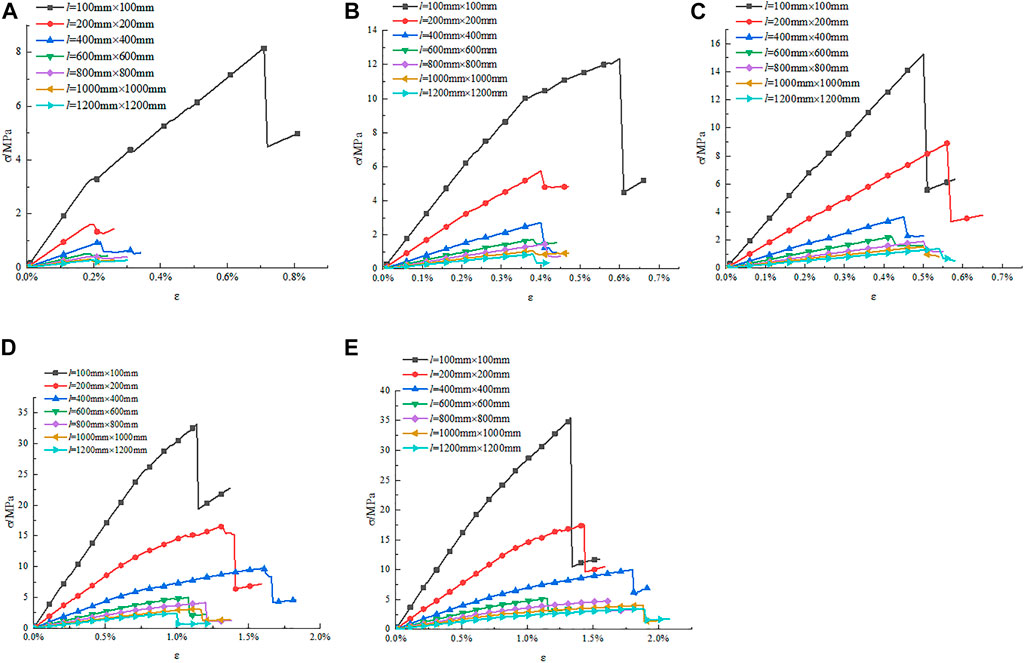
FIGURE 5. Stress-strain curves of different PJS. (A) s = 10 mm; (B) s = 20 mm; (C) s = 30 mm; (D) s = 40 mm; (E) s = 50 mm.
This study focuses on the effect of size on rock strength, and E. Figure 5B reveals that when the rock size is 100 mm, the strength is 12.344 MPa, and E is 2.957 GPa. As the size increase, the strength and E gradually decrease. When the size reaches 1,200 mm, the strength falls to 0.87 MPa, and E decreases to 0.243 GPa. This shows that the strength and E decrease with the size increase and have a negative correlation.
Figure 5 shows that E and rock size are negatively correlated. Figure 6 illustrates their scatter plots and fitting curves to better analyze the negative correlation between them.

FIGURE 6. Fitting curves of E and size.
Figure 6 represents the negative correlation between E and size, and E decreases as size increases. When the distance between parallel joints is larger, the curve is lower, indicating that the distance between parallel joints also has a significant impact on the curve. To better analyze this phenomenon, the relationship of each curve is regressed, as shown in Table 6. The determination coefficients are 0.992, 0.995, 0.992, 0.992, and 0.990, all greater than 0.99, indicating that the curve fitting is satisfactory.
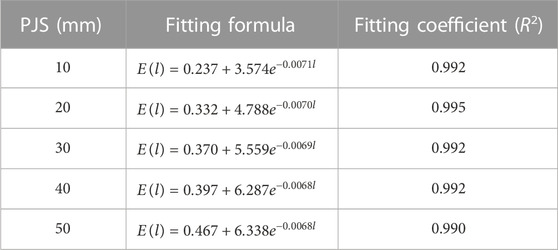
TABLE 6. Fitting relationship.
The curves in Table 6 are all negative exponential, indicating a negative exponential relationship between E and size. Therefore, the following relationship is proposed:
where E(l) is the rock’s elastic modulus when the size is l, Gpa; d, f, and g are parameters.
Eq. 8 also contains the parameters d, f, and g that must be solved based on the PJS in rock. When the parameters are solved for a rock with a specific PJS, this formula can calculate E for any size, which is significant. The following describes how to solve the parameters.
The curve shape in Table 6 indicates that parameters d, f, and g are related to the PJS and will change with it; therefore, Figure 7 exhibits their relationship curves.
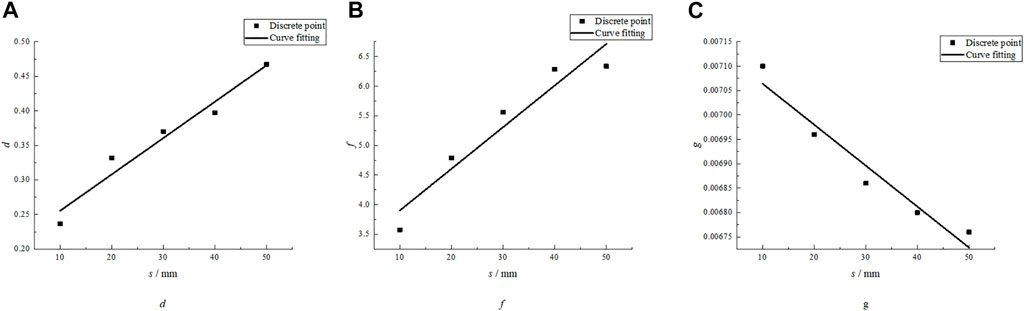
FIGURE 7. Fitting curve of parameters. (A) d; (B) f; (C) g.
The curve in Figure 7 represents the relationship between d, f, g, and PJS, which are linear. Therefore, the following relationship is obtained:
Eq. 9 through (11) provide the relationship between d, f, g, and the PJS. Therefore, it can bring these three formulas into Eq. 6 to obtain a special relationship:
The distance between parallel joints in Eq. 12 is a known quantity, so it defines a method for quantitative analysis of rock E and size. For a rock with a specific parallel joint, E can be calculated through this relationship when the size changes.
With increasing size, E tends to decrease and become more stable. The size used to characterize the stable value is known as the characteristic size of elastic modulus (CSEM). In general, it is not easy to directly evaluate the CSEM. Liang et al. (2013b) proposed an idea for solving the CSEM, which can be obtained by derivating both sides of the curve in Eq. 8:
where γ is the absolute value of the acceptable slope.
Eq. 15 is the CSEM solution formula. The fitting parameters g and f are introduced into Eq. 15, and the relationship between CSEM and PJS is shown in Table 7. Figure 8 depicts their fitting curves based on Table 7.
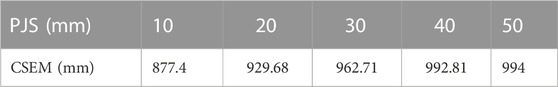
TABLE 7. Relationship between CSEM and PJS.
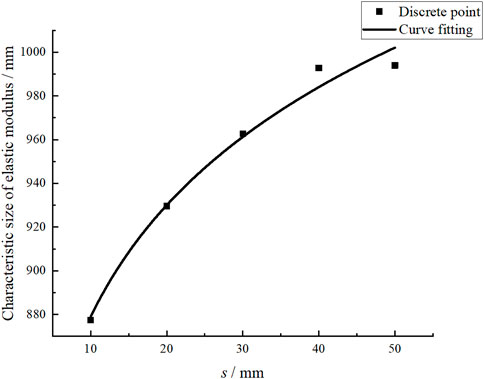
FIGURE 8. Fitting curve of CSEM and PJS.
Figure 8 shows that the CSEM increase with PJS and are positively correlated. In order to better analyze their relationship, their relationship curve is fitted as follows:
where A(s) is the CSEM, units: mm.
Eq. 16 demonstrates that the CSEM and PJS have a power function relationship. For a specific site rock, the PJS on it can be measured. Therefore, the CSEM can be solved using this relationship, which has significant engineering application value.
The E value obtained from the characteristic size is called the characteristic elastic modulus (CEM). This characteristic size value is introduced in Eq. 8, and the CEM values of different PJS are listed in Table 8. The curve between CEM and PJS is depicted in Figure 9.
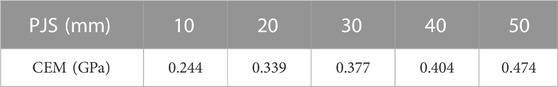
TABLE 8. Relationship between CEM and PJS.
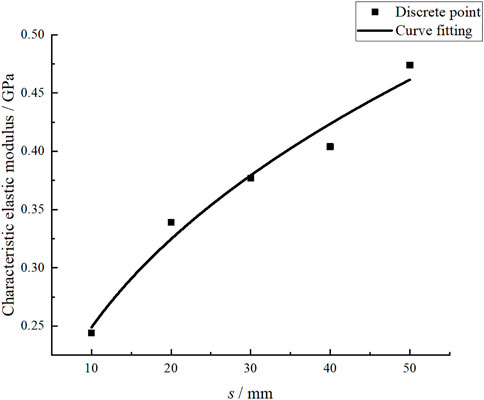
FIGURE 9. Fitting curve of CEM and PJS.
Figure 9 shows that the CEM increases with PJS and is positively correlated. In order to better analyze their relationship, the following fitting function is proposed:
Eq. 17 highlights that the relationship between CEM and PJS is a power function. For a specific site rock, when the PJS on it is measured, the CEM can be calculated through this relationship, which simplifies the solution of CEM.
In order to verify the results’ accuracy, this study verifies the accuracy of Eq. 6. Song (Xiaokang, 2021) indicated that the change in E with model size under uniaxial compression is as listed in Table 9. Figure 10 a) depicts the relationship curves. E decreases with the increase of size, and they have a negative exponential relationship.
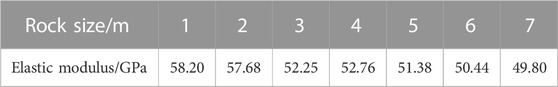
TABLE 9. Elastic modulus (Cui et al., 2020).
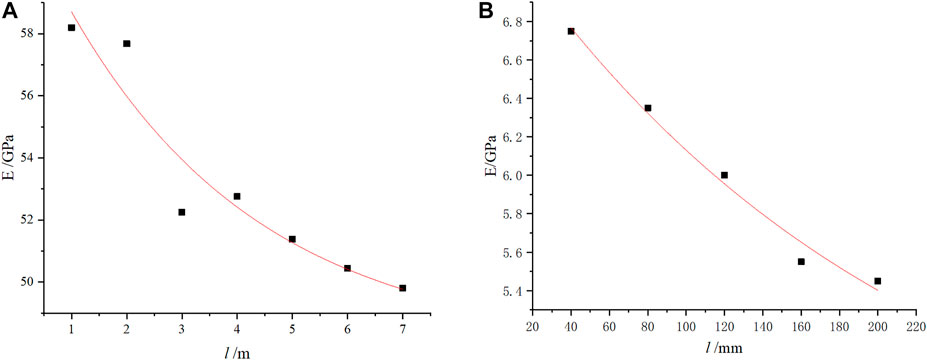
FIGURE 10. Relationship between the elastic modulus and size.
Na (2020) obtained the E and size fitting curve using the laboratory compression test shown in Figure 10B. The curve forms of Figures 10A, B indicate negative exponential relation that are governed using the following regression models:
Wei (2021) found that E decreases exponentially with size, and their expressions is as follows:
Eqs 18–20 are negative exponential forms that are consistent with Eq. 8 proposed in this paper. Therefore, the results obtained in this paper are consistent with the experimental conclusions of other scholars, which shows that the relations proposed in this paper are applicable to the solution of E.
The paper mainly establishes the following four relationships.
1) Relationship between E and PJS.
This paper proposes a relationship between E and PJS and optimizes its parameters by considering the size change. In existing research, scholars mainly focused on the influence degree (Yang et al., 2019b) (Huang et al., 2019), the influence effect (Chen et al., 2020), and the nonlinear change (Xiong et al., 2019) of the joint parameters. However, they rarely considered the size influence, obtained a relationship for E, or discussed the influence of PJS.
2) Relationship between E and size.
This paper introduces a general relation between E and size by analyzing the change in rock sizes. In the existing research, scholars mainly focused on the changes in the height-diameter ratio (Zhang et al., 2020), mineral particles (Zhang et al., 2019), and rock size (Wang et al., 2020). However, these articles rarely considered the influence of the PJS and rarely acquired the specific relations between E and size.
On the other hand, this paper verifies the relationship between E and size by combining the simulation and laboratory results in the literature (Na, 2020; Wei, 2021), hence, ensuring the accuracy and applicability of the relationship.
3) Relationship between CSEM, CEM, and PJS.
Two models were developed based on the correlation between E and size to govern the relationship between CSEM, CEM, and PJS, where no scholar has researched these two relationships.
The four relationships obtained in this paper reveal the size effect of E with PJS, which has an essential engineering and application value.
However, there are still shortcomings in the article. The occurrence of joints in rocks can be arbitrary, and parallel joints are only a particular case. The number of joints is often multiple. Therefore, in the follow-up work, the authors will continue exploring the influence of joint angle and number on the size effect of elastic modulus.
This study investigates the size effect of E and analyzes the stress-strain curves with different PJS and sizes. Based on the aforementioned statements and simulations, the following conclusions can be drawn.
(1) E exponentially rises with the increase in PJS. The relationship is as follows:
The article obtained a special intercorrelation:
(2) E exponentially decreases with the increase in rock size. The size effect relationship of E is obtained as follows:
This article developed a new correlation between E and the rock size:
(3) The CSEM increases with the rise in PJS, following a power function pattern. This paper proposed the following relationship:
(4) The CEM increases with the increase in PJS. This correlation follows a power function trend which is governed by the following proposed equation:
The original contributions presented in the study are included in the article/supplementary material, further inquiries can be directed to the corresponding author.
TZ: Data curation, Investigation, Methodology, Writing and original draft preparation. GH: Conceptualization, Investigation, Funding acquisition. All authors listed have made a substantial, direct, and intellectual contribution to the work and approved it for publication.
This work was supported by the Key Laboratory of Rock Mechanics and Geohazards of Zhejiang Province project number ZGRMG-2019-07.
The authors declare that the research was conducted in the absence of any commercial or financial relationships that could be construed as a potential conflict of interest.
All claims expressed in this article are solely those of the authors and do not necessarily represent those of their affiliated organizations, or those of the publisher, the editors and the reviewers. Any product that may be evaluated in this article, or claim that may be made by its manufacturer, is not guaranteed or endorsed by the publisher.
Cao, R. H., Cao, P., Lin, H., Ma, G. W., Fan, X., and Xiong, X. G. (2018). Mechanical behavior of an opening in a jointed rock-like specimen under uniaxial loading: Experimental studies and particle mechanics approach. Arch. Civ. Mech. Eng. 18, 198–214. doi:10.1016/j.acme.2017.06.010
Chen, X., Feng, Z., and Cheng, C. (2020). Numerical study on anisotropic influence of joint spacing on mechanical behavior of rock mass models under uniaxial compression. Energies 13, 6698. doi:10.3390/en13246698
Chong, Z., Yao, Q., Li, X., and Shivakumar, K. (2020). Acoustic emission investigation on scale effect and anisotropy of jointed rock mass by the discrete element method. Arabian J Geosci 13, 324–332. doi:10.1007/s12517-020-05303-z
Cui, Z., Chen, P. Z., and Sheng, Q. (2020). Estimation of REV for Danba schist based on 3D synthetic rock mass technique. IOP Conf. Ser. Earth Environ. Sci. 570, 1–14.
Dai, B., Zhao, X., Zhang, S., Kang, Q., and Zhu, Z. (2020). Mechanical behavior and energy evolution of sandstone considering slenderness ratio effect. Adv. Civ. Eng. 1-13, 1–13. doi:10.1155/2020/8881416
Han, Z., Zhang, L., and Zhou, J. (2019). Effect of mineral particle size heterogeneity on mechanical properties in PFC∼(2D) simulation. J. Eng. Geo 27, 706–716.
Hu, G., and Ma, G. (2021). Size effect of parallel-joint spacing on uniaxial compressive strength of rock. PLOS One 16, 02572455–e257316. doi:10.1371/journal.pone.0257245
Huang, C., Yang, W., Duan, K., Fang, L., Wang, L., and Bo, C. (2019). Mechanical behaviors of the brittle rock-like specimens with multi-non-persistent joints under uniaxial compression. Constr. Build. Mater 220, 426–443. doi:10.1016/j.conbuildmat.2019.05.159
Jin, J., Yang, Y., Liao, Z., Yu, X., and Zhong, Y. (2021). Effect of dynamic loads and geo-stresses on response characteristics of rocks. Chin. J Rock Mech Eng 40, 1990–2002.
Liang, Z., Wu, N., Li, Y., Li, H., and Li, W. (2019). Numerical study on anisotropy of the representative elementary volume of strength and deformability of jointed rock masses. Rock Mech Rock Eng 52, 4387–4402. doi:10.1007/s00603-019-01859-9
Liang, Z., Zhang, Y., and Tang, S. (2013). Size effect of rock masses and associated representative element properties. Chin. J Rock Mech Eng 32, 1157–1166.
Liang, Z., Zhang, Y., Tang, S., Li, L., and Tang, C. (2013). Size effect of rock mass and associated representative element properties. Chin. J. Rock Mech. Eng. 32, 1157–1166.
Lin, Q., Cao, P., Meng, J., Cao, R., and Zhao, Z. (2020). Strength and failure characteristics of jointed rock mass with double circular holes under uniaxial compression: Insights from discrete element method modelling. Theor. Appl. Fract. Mech. 109, 102692. doi:10.1016/j.tafmec.2020.102692
Liu, W. R., Liu, J. K., and Zhu, C. (2019). Multi-scale effect of acoustic emission characteristics of 3D rock damage. Arab. J. Geosci. 12, 668–680. doi:10.1007/s12517-019-4864-4
Liu, W., Yuan, W., Yan, Y., and Wang, X. (2019). Analysis of acoustic emission characteristics and damage constitutive model of coal-rock combined body based on particle flow code. Symmetry 11, 1040. doi:10.3390/sym11081040
Liu, Y., Wang, Q., Chen, J., Song, S., Zhan, J., and Han, X. (2018). Determination of geometrical REVs based on volumetric fracture intensity and statistical tests. Appl. Sci. 8, 800–818. doi:10.3390/app8050800
Loyola, A. C., Pereira, J. M., and Cordão Neto, M. (2021). General statistics-based methodology for the determination of the geometrical and mechanical representative elementary volumes of fractured media. Rock Mech. Rock Eng. 54, 1841–1861. doi:10.1007/s00603-021-02374-6
Ma, Q., Tan, Y. L., Liu, X. S., Zhao, Z. H., and Fan, D. Y. (2021). Mechanical and energy characteristics of coal–rock composite sample with different height ratios: A numerical study based on particle flow code. Environ. Earth Sci. 80, 309. doi:10.1007/s12665-021-09453-5
Na, W. (2020). Study on the scale effect and anisotropy of mechanical properties of jointed rock mass. China: Dalian University of Technology.
Niu, S. J., Zhang, D. Y., Ge, S. S., and Yang, D. F. (2019). Numerical simulation of particle flow in mechanical properties of fractured sandstone. J. Henan Polytech. Univ. Nat. Sci. 38, 129–135.
Wang, X., Yuan, W., Yan, Y., and Zhang, X. (2020). Scale effect of mechanical properties of jointed rock mass: A numerical study based on particle flow code. Geomechanics Eng. 21, 259–268.
Wei, C. (2021). DEM simulation analysis of size effect of jointed rock mass and its multi-scale calculation method. China: Shandong University.
Wu, N., Liang, Z. Z., Li, Y. C., Li, H., Li, W. R., and Zhang, M. L. (2019). Stress-dependent anisotropy index of strength and deformability of jointed rock mass: Insights from a numerical study. Bull. Eng. Geol. Environ. 78, 5905–5917. doi:10.1007/s10064-019-01483-5
Wu, X., Jiang, Y., Guan, Z., and Gong, B. (2019). Influence of confining pressure-dependent Young's modulus on the convergence of underground excavation. Tunn. Undergr. Space Techno 83, 135–144. doi:10.1016/j.tust.2018.09.030
Xia, Z. G., Liu, S., Bian, Z., Song, J., Feng, F., and Jiang, N. (2021). Mechanical properties and damage characteristics of coal-rock combination with different dip angles. KSCE J. Civ. Eng. 25, 1687–1699. doi:10.1007/s12205-021-1366-1
Xiaokang, S. (2021). Research on structure effect and size effect of mechanical parameters of fractured rock mass. China: Taiyuan University of Technology.
Xiong, L. X., Chen, H. J., Li, T. B., and Zhang, Y. (2019). Uniaxial compressive study on mechanical properties of rock mass considering joint spacing and connectivity rate. Arab. J. Geosci. 12, 642–653. doi:10.1007/s12517-019-4803-4
Yang, S. Q., Yin, P. F., Zhang, Y. C., Chen, M., Zhou, X. P., Jing, H. W., et al. (2019). Failure behavior and crack evolution mechanism of a non-persistent jointed rock mass containing a circular hole. Int. J. Rock Mech. Min. 114, 101–121. doi:10.1016/j.ijrmms.2018.12.017
Yang, W., Li, G., Ranjith, P. G., and Fang, L. (2019). An experimental study of mechanical behavior of brittle rock-like specimens with multi-non-persistent joints under uniaxial compression and damage analysis. Int. J. Damage Mech. 28, 1490–1522. doi:10.1177/1056789519832651
Yin, Z., Chen, W., Hong, H., Chang, J., Zhao, G., Chen, Z., et al. (2020). Dynamic compressive test of gas-containing coal using a modified split hopkinson pressure bar system. Rock Mech. Rock Eng. 53 (2), 815–829. doi:10.1007/s00603-019-01955-w
Yin, Z. Q., Ma, H. F., Hu, Z. X., and Zou, Y. (2014). Effect of static - dynamic coupling loading on fracture toughness and failure characteristics in marble. J. Eng. Sci. Technol. Rev. 7 (2), 169–174. doi:10.25103/jestr.072.25
Yuanwei, S., Yongchao, H., Guowei, P., Yanli, W., Shuxin, D., Yuanfang, C., et al. (2019). Investigation on the effect of gravel on the fracture of sand conglomerate based on RFPA. J. Petrochem. Univ. 32, 71–75.
Zhang, H., Zhang, X., and Zhou, H. (2020). Research on acoustic emission characteristics and constitutive model of rock damage evolution with different sizes. Adv. Civ. Eng. 2020, 1–8. doi:10.1155/2020/6660595
Zhang, S., Zhang, D., Zhao, Q., Chi, M., Zhang, W., and Yu, W. (2019). DEM investigation of the influence of minerals on crack patterns and mechanical properties of red mudstone. Processes 7, 162. doi:10.3390/pr7030162
Keywords: elastic modulus, characteristic elastic modulus, regression analysis, size effect, parallel joint spacing
Citation: Zhao T and Hu G (2023) Study on the size effect of elastic modulus of rock considering the joint spacing. Front. Mater. 10:1142683. doi: 10.3389/fmats.2023.1142683
Received: 12 January 2023; Accepted: 21 April 2023;
Published: 18 May 2023.
Edited by:
A. M. Fattahi, Islamic Azad University of Tabriz, IranReviewed by:
Zhiqiang Yin, Anhui University of Science and Technology, ChinaCopyright © 2023 Zhao and Hu. This is an open-access article distributed under the terms of the Creative Commons Attribution License (CC BY). The use, distribution or reproduction in other forums is permitted, provided the original author(s) and the copyright owner(s) are credited and that the original publication in this journal is cited, in accordance with accepted academic practice. No use, distribution or reproduction is permitted which does not comply with these terms.
*Correspondence: Gaojian Hu, aHVnYW9qaWFuOEAxNjMuY29t
Disclaimer: All claims expressed in this article are solely those of the authors and do not necessarily represent those of their affiliated organizations, or those of the publisher, the editors and the reviewers. Any product that may be evaluated in this article or claim that may be made by its manufacturer is not guaranteed or endorsed by the publisher.
Research integrity at Frontiers
Learn more about the work of our research integrity team to safeguard the quality of each article we publish.