 Zhipeng Xing1,2
 Yufeng Li
- 1Institute for Advanced Materials and Technology, University of Science and Technology Beijing, Beijing, China
- 2CETC Information Science Academy, Beijing, China
- 3Shanghai Aerospace Equipments Manufacturer Co., Ltd., Shanghai, China
- 4State Key Laboratory of Mechanical Transmission, Chongqing University, Chongqing, China
Introduction: Resource environment load data are important for analyzing and improving the environmental performance, which are affected by the process condition of metal material machining processes. However, the environmental performance assessment in previous research focused on the results under the specific process conditions. The resource environment load data need to be re-collected when the process conditions are changed for a credible assessment, which is time- consuming and tedious.
Methods: This paper proposed a process condition- oriented prediction method of resource environment load data with limited samples. The significance of process condition elements on the resource environment load data was analyzed, and then the resource environment load was predicted according to the similarity between the process condition to be predicted and the existing process conditions.
Results and Dicussion: The results show that the average prediction accuracy of this method exceeds 90%, and further the accuracy for predicting the environmental performances using the predicted data is more than 93% which would help process designers to choose the better process condition for machining the metal materials.
1 Introduction
The manufacturing industry is the important pillar of world’s economic development. Simultaneously, metal machining process also results in significant resource and energy depletion, accompanied the generation of a large amount of environmental waste in the form of solids, liquid, gas and airborne particulates (Du et al., 2020; He Y. et al., 2022). International Energy Agency (IEA) had reported that it is responsible for approximately 30% of global final energy consumption and over 20% of global CO2 emissions (Agency, 2008). Consequently, to address on the environmental issues, environmental performances are evaluated based on the life cycle assessment (LCA) methodology which has been widely applied in the metal machining process to guide enterprises toward Green Manufacturing. The accuracy of the environmental performance results directly depends on the resource environment load data in life cycle inventory (LCI) which is the second of four phases of the LCA methodology regulated by the ISO 14040 and ISO 14044 series of international technical standards (Ferrari et al., 2021). Therefore, it has become a crucial concern to obtain the reliable resource environment load data.
Resource environment load data in LCI for evaluating the environmental performances of metal machining process can be divided into primary data (when the data are obtained directly at the production sites and associated to the related process units) and secondary data (when the data come from databases, literature, estimates) (Ferrari et al., 2021). Some researchers have evaluated the environmental performances based on the secondary data. Bekker et al. evaluated the environmental performances of computer numerical control (CNC) milling according to the resource environment load data entries in SimaPro software (Bekker and Verlinden, 2018). He et al. investigated the environmental performances of an automotive fuel-line clip produced with recycled polyamide 12 from the selective laser sintering process in comparison to the conventional polyamide 66 counterpart, based on commercial LCA databases (He D. et al., 2022). Soares et al. conducted a comparative environment performance assessment between hobbing 20MnCr5 with minimum quantity lubrication and flood lubrication based on the data obtained from database provided by GaBi (Soares et al., 2022). Vukelic et al. monitored the negative environment impact of cutting processes through midpoint and endpoint assessment based on Ecoinvent database (Vukelic et al., 2020). In the above research, the environmental performances were predicted with the secondary data which mainly depend on material and process types (Narita et al., 2008). Once the material and process types are determined, the resource environment load data would be predicted to be the constant value. However, during the metal machining process, the resource environment load data are associated with the specific process conditions (Liu et al., 2022), which not only relate to the process type and material type, but also depend on process parameters, equipment, etc., (Khettabi et al., 2007; de Souza Zanuto et al., 2019; Wang et al., 2021). The change of process conditions will lead to the change of resource environment load. For example, the disc mechanism consumes 478% more energy than the two-cylinder mechanism on average to grind the single 2-m-long timber beams made of three wood species: ash, pine and spruce. (Warguła et al., 2022). Therefore, the secondary data without considering specific process conditions is unsuitable for accurate environmental impact assessment for the actual metal machining process (Dai et al., 2022).
Employing the reliable primary data obtained directly at production or experiment sites is critical for obtaining credible assessment results (Kalverkamp et al., 2020). Some researchers focused on the environmental performances considering the primary data. Afzal et al. had analyzed the environmental performances of three different welding processes based on the resource environment load data collected on site for welding 1 m long and 2.5 thick AISI 304 stainless steel sheets under given experimental conditions (Afzal et al., 2021). Pittner et al. conducted an environmental impact assessment using the resource environment load data obtained from experiments for different fusion welding processes of the shear test specimens and automotive cap profile under specified parameter settings, and the results showed that laser beam welding brings about up to 60% reduced environmental performances for both cases in comparison to the resistance spot welding (Pittner and Rethmeier, 2022). Khanna et al. presented the comparison of dry and cryogenic LCO2 machining based on the collected data on the consumption of electricity and LCO2 for milling a slot with 1,000 mm. And the results show that considering all impact categories, more than 95% higher impacts have been generated in the case of LCO2 condition in comparison with dry machining (Khanna et al., 2022). Shah et al. evaluated the environment performance for drilling the Inconel 718 using cryogenic cutting fluids based on the collected primary data in each cutting test, and the representative impact category results at three different cutting speeds between the two cryogenic environments were obtained (Shah et al., 2021). However, these studies performed the environmental performance assessment using the primary data and these data are directly obtained under the given process conditions. Further, the resource environment load data in LCI is changeable in different process conditions. When the process condition change, new resource environment load data are required to assess the environmental impact of the metal machining process. Using the above methods, the resource environment load data needs to be re-collected when the process conditions are changed for a credible assessment, which is time-consuming and tedious. Therefore, the motivation for this research was to investigate the resource environment load data prediction under the new process condition for evaluating the environmental performances and further promoting the efficient improvement of metal machining process conditions.
Therefore, the major aim and novelty of this research is to effectively predict the resource environment load under changeable process condition and accurately evaluate the environmental performance. In this method, the process condition is introduced to comprehensively describe the process type, materials, processing mode, equipment, process parameters and other information during the metal machining process. And then, the resource environment load database is constructed based on the concept of process condition to store the collected data. Moreover, a process condition similarity matching method based on weighted Euclidean distance is proposed for predicting the resource environment load data of new process conditions with limited sample data. Finally, a case study was conducted to validate the proposed method. The predicted data can be used for assessing the environment performance under the new process condition for machining the metal materials.
2 Materials and methods
2.1 Resource environment load database construction
The actual production processes are complex and diverse, the process conditions are not identical in different processes. For example, in the cutting process, the type of material and processing method may be the same, while process parameter and equipment are different. However, different process conditions such as Equipment, Processing Modes, Material Types, Process Parameters, etc., may lead to different energy requirement, processing time, etc., These differences would further result in the changes of resource environment load data. Taking the same product as an example, the energy consumption and emissions generated by a small lathe and a large CNC lathe are different, while other process conditions are the same. Therefore, it is necessary to define and store the process conditions corresponding to the current resource environment load. The concept of process condition is used to comprehensively describe process conditions including information related to material, process parameters, processing mode, processing method, equipment and condition description. Table 1 shows the elements of the machining process condition and its explanation in detail as an example.
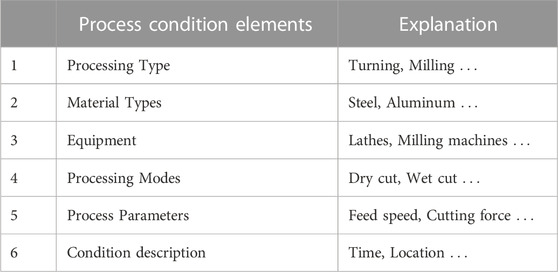
TABLE 1. Process condition elements of machining process and the explanations.
As shown in Table 1, the processing methods include milling, turning, etc., The processing materials include steel, aluminum, etc., The processing equipment may use lathes, milling machines, etc., The processing modes include wet cutting, dry cutting, etc., while the processing parameters in the processing process include Feed speed, Cutting force, etc., and the description of the current processing location and time.
Further, the ultimate purpose of the resource environment load in LCI is to evaluate the environmental problems caused by actual production, and reduce the degree which harm to the human body and the environment, and further to provide scientific and accurate evidences for process designers. Based on process condition description, the resource environment load can be analyzed in detail. The resource environment load usually includes the input of resources, energy and environmental output. Resource and energy input include the amount of process objects, the amount of auxiliary materials, and energy consumption; Environmental outputs include air pollution, water pollution, solid waste, and occupational health. The resource environment load is shown in Figure 1.
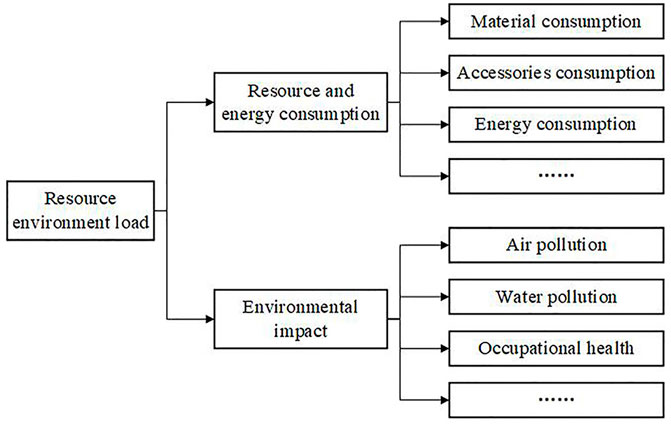
FIGURE 1. Resource environment load.
Specifically, the resource environment load under a process condition is mainly represented by the input and output model (IPO). For example, in the machining process, resource inputs include raw materials, energy inputs (mainly refer to electrical energy), and the output mainly includes finished workpieces, and some environmental pollutants (such as waste liquid, Gaseous waste, occupational hazards and so on). The above information is presented using the IPO diagram, as shown in Figure 2.
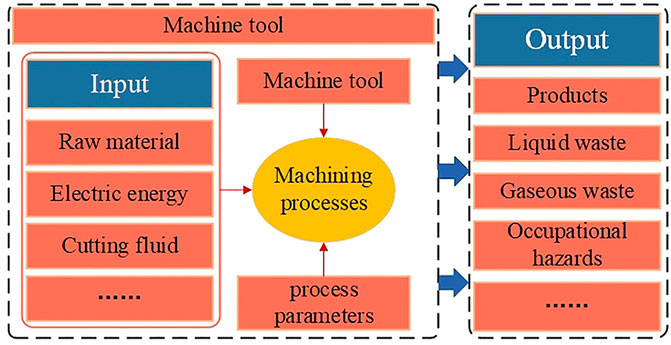
FIGURE 2. IPO model of the machining processes.
The type of resource environment load in the target condition can be clarified through the IPO diagram. When evaluating the environmental performances, the resource environment load data can be selected according to the demand for analyzing and assessing the resource environment load in the target condition. For example, if the purpose of studying resource environment load is to reduce human body damage, the main research resource environmental load indicators are occupational health, air pollution, etc., The selection of resource environment load indicators should follow a few principles.
• Systematic principle: the selection of indicators must be reasonable in hierarchy, which can comprehensively characterize the process environmental problems.
• The principle of quantification: the selection of indicators needs to consider the quantification of resource environment load, and the purpose of assessing environmental problems in actual process conditions can be achieved through monitoring and collecting the basic data of resource environment load.
• The principle of operability: During the selection of resource environment load indicators, it is necessary to take into account the operability to facilitate the evaluation of environmental indicators.
• The principle of independence: the indicators should avoid the intercorrelation. If they are related to each other, it will lead to unreasonable selection of indicators, which will increase the basic data collection workload of resource environment load, and ultimately affect the accuracy of resource environment load evaluation results.
Further, in order to ensure the accuracy of the environmental performances results, primary data at the production site are usually the basis of the evaluation. According to the input and output information described in the IPO diagram, the corresponding data are collected by sensors equipment such as power meters (measuring energy consumption), dust sensors (measuring the dust or oil mist, noise sensors, gas testers, etc.,). However, the resource environment load data collected by the sensor are difficult to structure in the actual process. Therefore, there is an urgent need to build a resource environment load database to manage resource environment load data.
In order to solve the above problems, this paper adopts B/S architecture to achieve WEB-based data access, and decouples the development of the front and back ends. The front-end page adopts Html, Css and JavaScript development, and the progressive development framework Vue is selected to simplify the development process. The Vue framework abstracts the state and behavior of the view based on the MVVM model. The back-end mainly uses the Springboot development framework, and the data storage uses MySQL and MogoDB for data persistence. Implement user-oriented data sharing services and applications, and support dynamic data update and structured management. The database development technology system is shown in Figure 3.
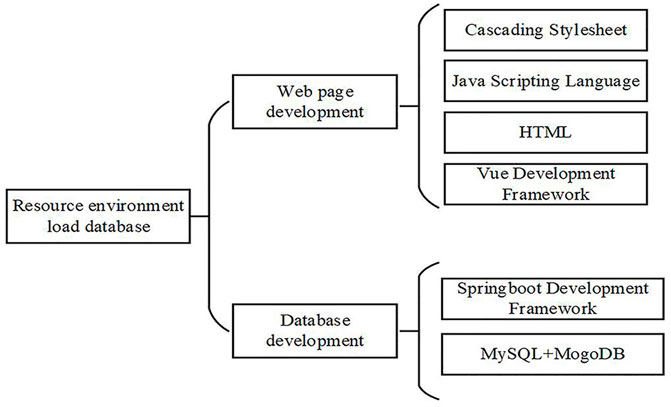
FIGURE 3. Database development technology system.
2.2 Resource environment load prediction method
2.2.1 Prediction method framework
Considering the similarity of resource environment load data in homogeneous process conditions, this paper evaluates the resource environment load corresponding to the target condition by matching the existing data. Based on this, a framework of evaluating the resource environment load for process conditions is constructed and shown in Figure 4.
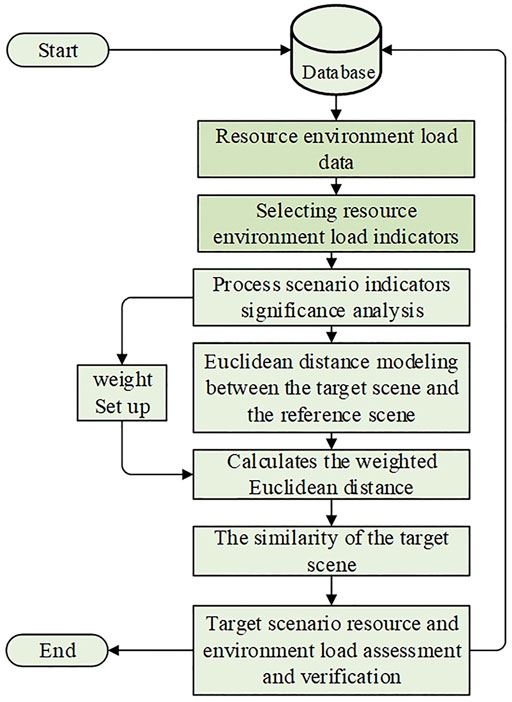
FIGURE 4. The framework of resource environment load prediction.
The resource environment load prediction method for process condition flow is as follows: Firstly, select the data from the resource environment database and environmental indicators. Secondly, analyze the significance of each resource environment load indicators according to the data. Thirdly, according to the significance of the resource environment load indicator, set the relative weight of each indicator. Fourthly, the weighted Euclidean distance and similarity are calculated between the target condition and the reference condition according to the resource environment load indicators and the corresponding weights. Fifthly, select the resource environment load data corresponding to the process condition with the greatest similarity as the evaluation value of the new process condition. And then, verify the evaluation values and giving an explanation. Finally, store reasonable evaluation results.
2.2.2 Significance analysis of process condition
Different process condition elements have different impacts on resource environment load. Therefore, significance analysis is used to explore the significant impact of process condition elements on resource environment load. Assume that there is correlation between resource environment load
That is
In general, if there is no linear relationship between
It can be seen from
In this model, if the hypothesis
Where F is the statistic that tests hypothesis
2.2.3 Process condition similarity matching based on weighted euclidean distance
Euclidean distance method can reflect the absolute difference of different sample characteristics, which mostly used to analyze the difference in the size of dimension values (Terrados-Cristos et al., 2021). In a multidimensional data spatial structure, Euclidean distance is a method for measuring the spatial distance of two vectors. The magnitude of the Euclidean distance reflects the degree of similarity between the two vectors, i.e. the smaller the value, the smaller the difference between the two vectors (Ji and Ni, 2022).
First of all, the coordinates of the p-dimensional vector (i.e., the vector composed of process condition factors) of the reference condition M and the target condition N as follows:
According to the concept of Euclidean distance, the distance
However, in the traditional Euclidean distance method, all variables in the similarity matching model are treated equally and consistently. In fact, the similarity between the corresponding elements should be fully considered. For example, in the machining process, the cutting speed has a greater impact on noise and significantly less on carbon emissions. Therefore, it is more practical to consider the weight based on the significance of each variable.
Assuming that there are q resource environment load indicators corresponding to process conditions M and N, which are represented by
where
where
It can be seen from the formula 10 that under the condition of sample determination, the calculation result of the Euclidean distance is proportional to the corresponding weight. However, giving weights to individual variables characterizes the subjectivity of the decision maker to the variables, but the completely subjective Euclidean distance calculation lacks the professionalism and credibility in the field. Therefore, objective weights need to be given to individual variables.
Taking the analysis result as the objective basis for determining the weight of each variable, if the range
According to the results of similarity calculation, the data of resource environment load corresponding to the process condition with maximum similarity is used as the evaluation value of the new process condition. With the continuous enrichment and expansion of the process condition library, the accuracy of matching results can be further improved.
3 Results
3.1 Resource environment load data collection
Aluminum alloy materials are widely used metal material in the manufacturing industry, and it is of great significance to conduct environmental performance assessment during machining process. Therefore, in order to verify the accuracy and effectiveness of proposed method, an experiment which use VCML850 to mill aluminum alloy Al6061 on a CNC machine tool was conducted.
Due to the equipment is generally selected according to the process type, the resource environment load data is collected considering the process parameters, processing methods and other factors when processing aluminum alloy Al6061. Therefore, according to the systematic principle, quantitative principle, independence principle and operability principle of resource environment load data, noise, dust and carbon emission are selected as the resource environment load data in this case study. During the experimental, milling speed Vc, feed speed f, milling depth ap, milling width ae, two types of cutting condition (CC), dry cut and wet cut (represented by 1 and 2, respectively), were selected as the process condition elements. The resource environment load data under the different process conditions are shown in Table 2.
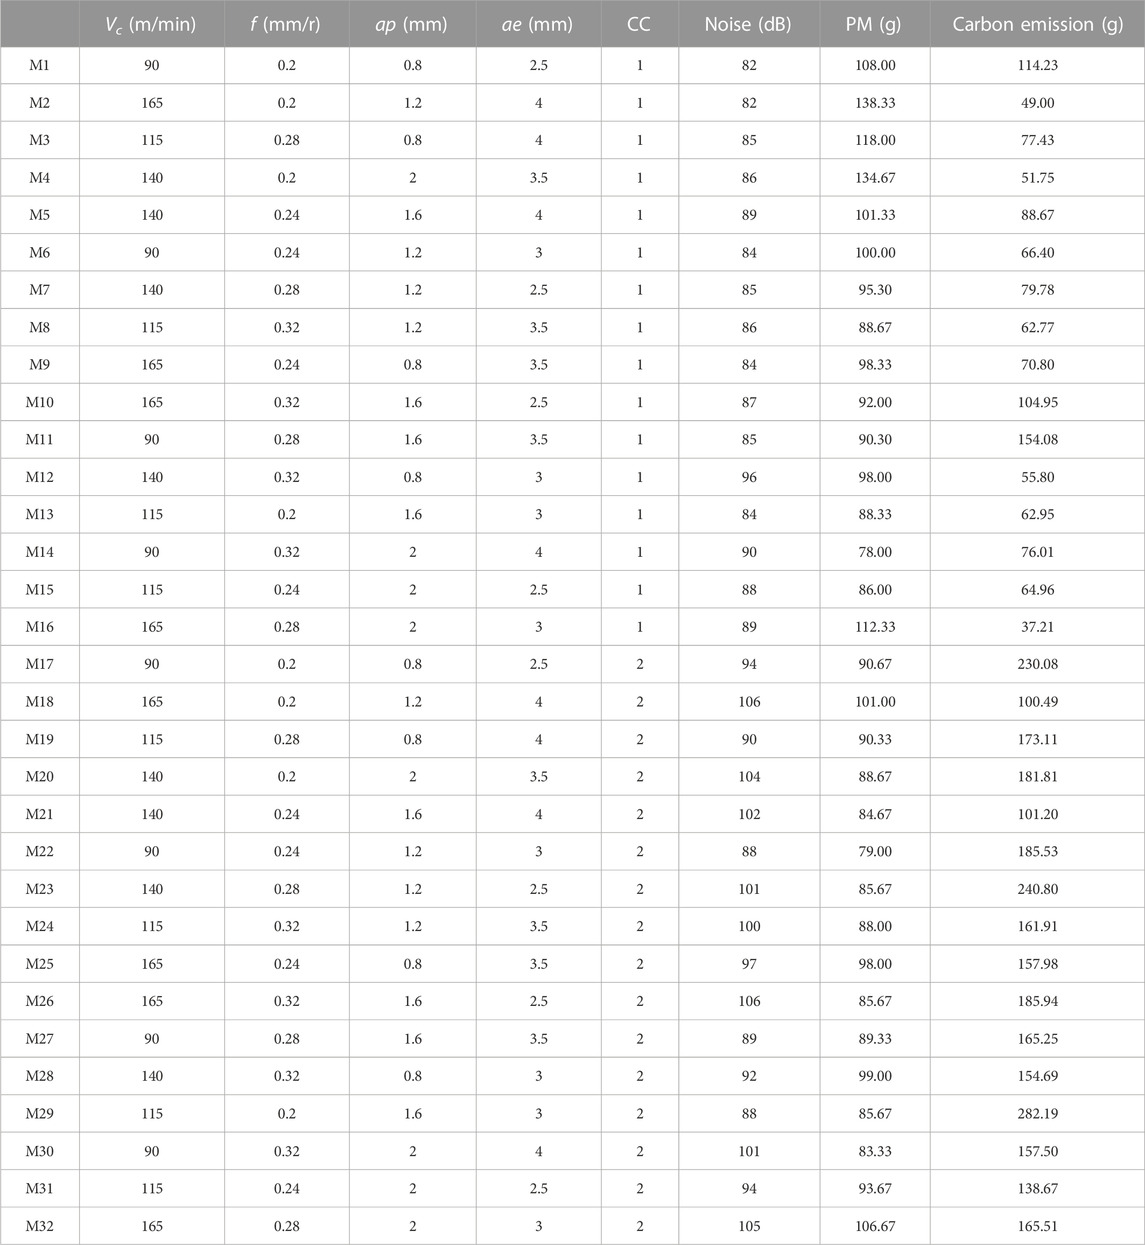
TABLE 2. Resource environment load data with different process conditions.
Further, the resource environment load database interface is shown in Figure 5. The data can be stored in the database after transmitting to the data processing analysis system. The role of the database is mainly to realize the management of the basic data of the resource environment load by using a graphical user interface, which can be more intuitive to manage the data. When it is necessary to evaluate the resource environment load of the actual process condition or optimize the process condition, the database can provide a reference base data inventory.
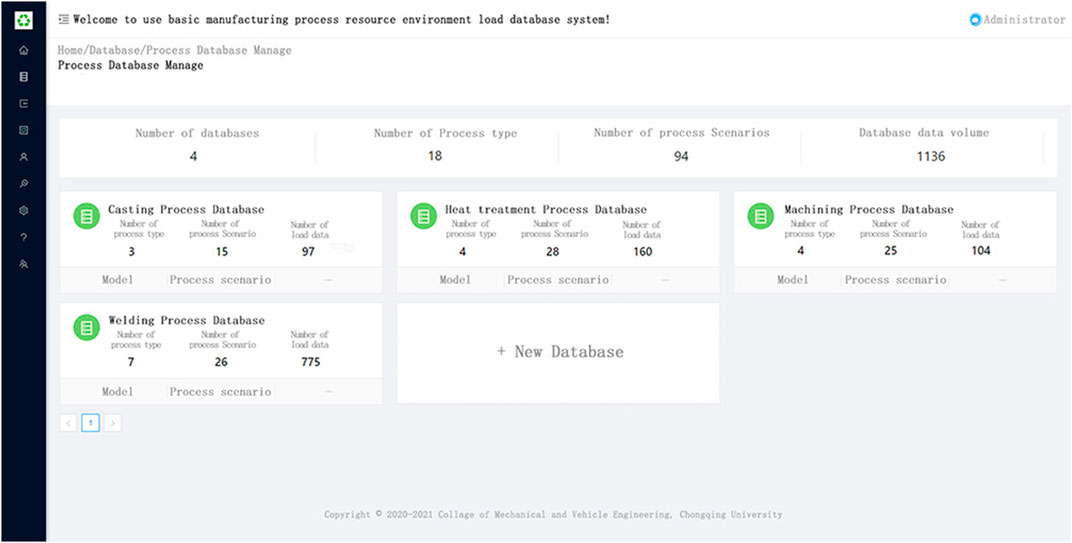
FIGURE 5. Resource environment load database interface.
3.2 Resource environment load prediction results
3.2.1 Significance analysis results
According to the framework in Section 2.2, it is first necessary to analyze the significance of the elements on the resource environment load in the process condition. Milling Al6061 process condition data is analyzed for significance and extreme range analysis, and the results are collated as shown in Table 3. Through the analysis of the range value, it can be seen that the influence of process condition elements on the carbon emission is shown as follows: CC > ae > Vc > ap > f for carbon emission; For noise, CC > Vc > ap > f > ae; With regard to PM, Vc > f > CC > ap > ae. Therefore, the reasonable process condition must be taken seriously to reduce the resource environment load.
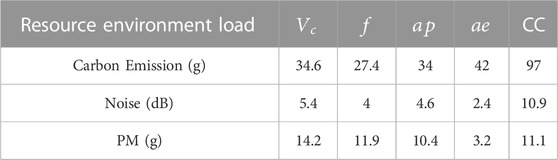
TABLE 3. The range analysis results of resource environment load corresponding to Al6061 process condition.
According to the formula 12, the significance of variable
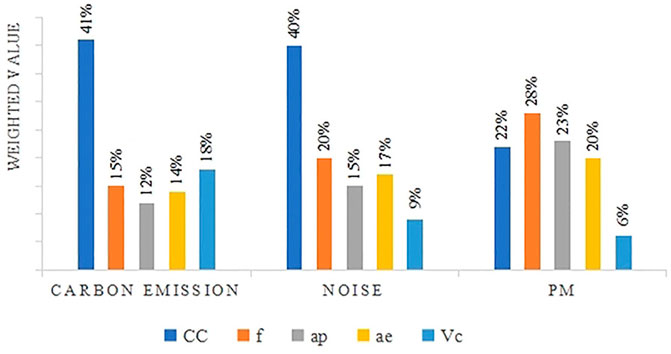
FIGURE 6. The weight set of process condition factors for Al6061.
3.2.2 Process condition similarity calculation results
Process condition similarity calculation is the premise and core of resource environment load prediction. Before calculating similarity, it is necessary to determine the raw data of the reference condition, and standardize the raw data according to the formula 11. Taking the reference condition sample M1 shown in Table 2 as an example, the information can be expressed as M1 = (90, 0.2, 0.8, 2.5, 1).
With Al6061 as the processing material, the set of process condition N1 = (130, 0.26, 1.4, 3.25, 1), were selected as object process condition. The resource environment data under different process conditions stored in database are selected. Then, the weighted Euclidean distance results are used to represent the similarity between the object process condition to be predicted and the reference process conditions. The matching result is shown in Table 4. According to the matching results, the reference process conditions with the greatest similarity to the condition N1 is M6 when predicting the carbon emission. The reference process conditions with the greatest similarity for noise and PM are both M5.
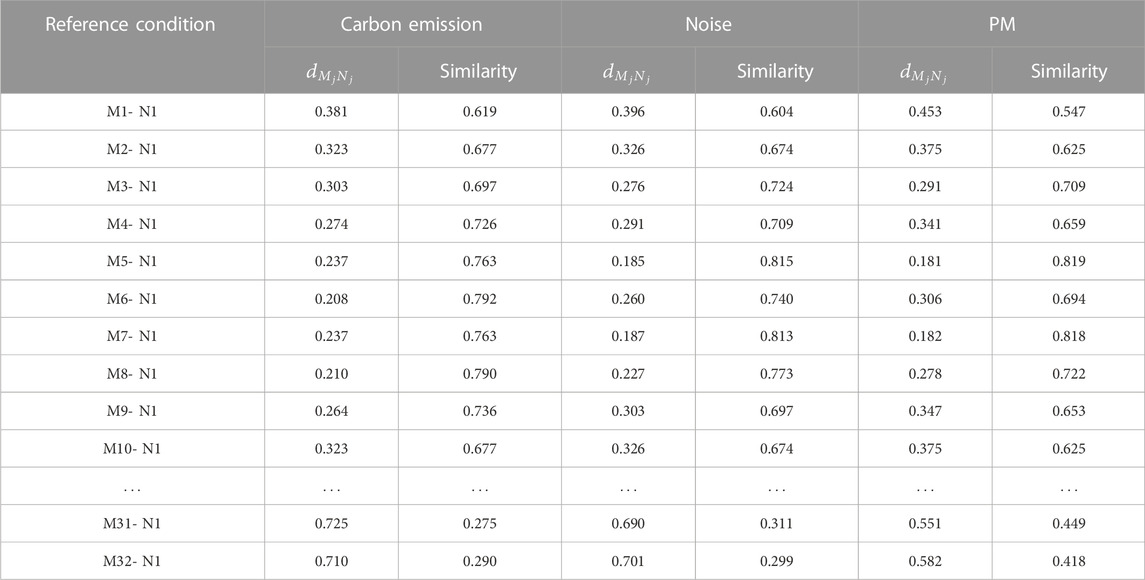
TABLE 4. The matching results corresponding to N1.
In order to demonstrate the accuracy of the proposed prediction method, the prediction values of each indicator are compared to the experimental values as shown in Table 5. The prediction accuracy of carbon emissions, noise, and PM for N1 are 92.5%, 91.5%, and 88.1% respectively. Besides, the Ecoinvent database was taken as reference to estimate the resource environmental data for N1. The result showed that the carbon emission is 46.3 g. Accordingly, the accuracy of the proposed method for predicting the carbon emission is more than the one of Ecoinvent database. However, Ecoinvent database lacks the noise and PM data which results in that these two types of resource environment load cannot be predicted. Therefore, the proposed prediction method has the higher accuracy for predicting the resource environment load and more types can be analyzed, comparing to the Ecoinvent database.
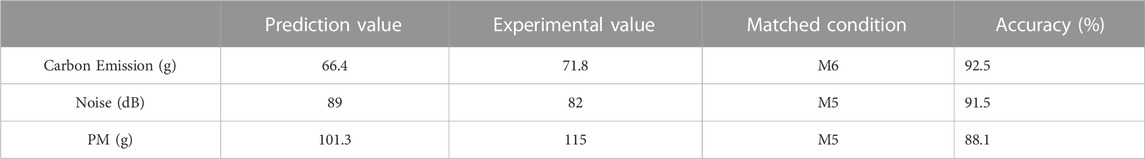
TABLE 5. Prediction accuracy for N1.
4 Discussion
4.1 Robust of the prediction method
In order to prove the robust of the proposed prediction method, another two sets of process conditions N2 = (150, 0.3, 1.8, 3.75, 1), and N3 = (130, 0.26, 1.4, 3.25, 2) were selected as object process conditions to test the effectiveness of the method. The weighted Euclidean distance results are used to represent the similarity between three process conditions to be predicted and the reference process conditions. The calculation results are shown in Tables 6, 7.
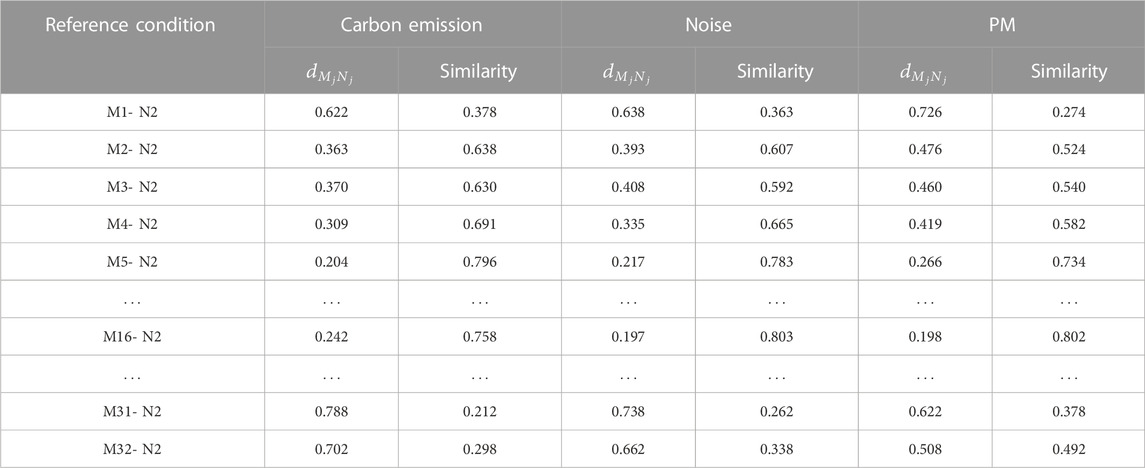
TABLE 6. The matching results corresponding to N2.
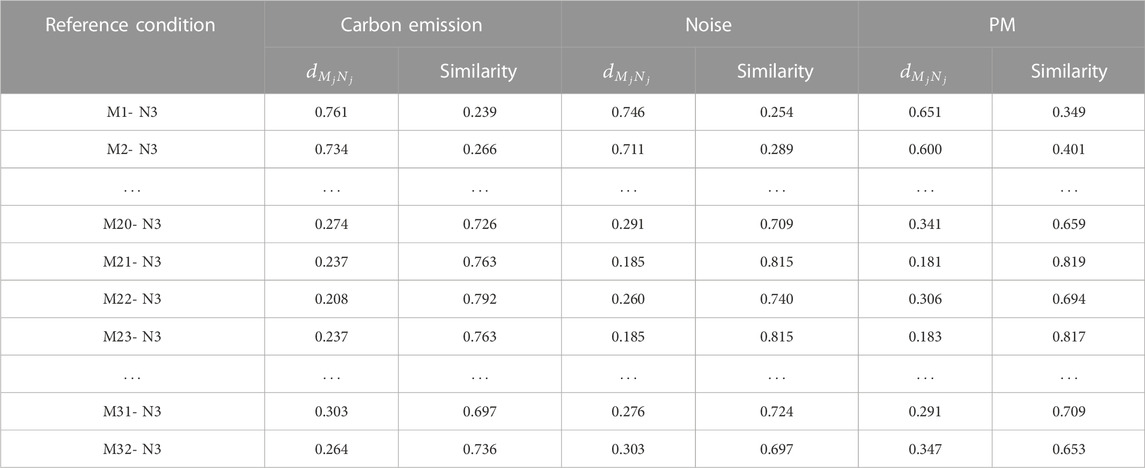
TABLE 7. The matching results corresponding to N3.
According to the matching results in Tables 6, 7, the reference process conditions with the greatest similarity to the conditions N2 and N3 are M5 and M22, respectively when predicting the carbon emission. When predicting noise, the reference process conditions with the greatest similarity with the conditions N2 and N3 are M16 and M21 respectively. When predicting PM, the reference process conditions with the greatest similarity with the conditions N2 and N3 are M16 and M21, respectively. The similarity matching results of the process conditions to be predicted, along with predicted and experimental values of their resource environment loads are shown in Table 8.
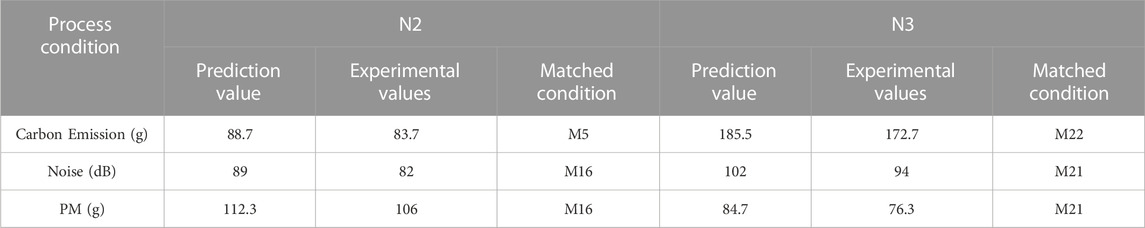
TABLE 8. The resource environment load evaluation results for N2 and N3.
After experimental verification, Table 9 shows the accuracy verification results of the prediction method. The average prediction accuracy of carbon emissions, noise, and PM was 93%, 91.5%, and 90.4% respectively, all exceeding 90%. It can be seen that the proposed prediction method is efficient and robust for predicting the resource environmental data of different process condition.
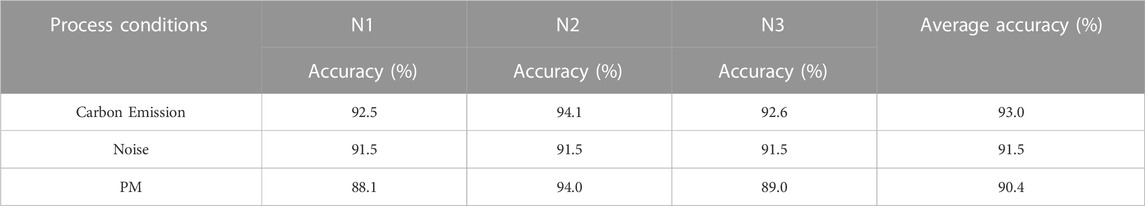
TABLE 9. The accuracy verification results of prediction method.
4.2 Environmental impact analysis with the predicted resource environmental data
According to the existing resource environment load data obtained for the new process conditions, the environmental performances of the new process conditions are assessed by using the LCA methodology, which is a widely used method of conducting environmental impact assessments of products or processes standardized in ISO14040 and ISO14044 (International Organization for Standardization, 2006; La Rosa et al., 2018). Accordingly, the environmental performances are evaluated by prediction data and experimental data, and the normalized results of six environmental impact categories are shown in Table 10.

TABLE 10. Environmental performances of N1,N2,N3.
Table 11 illustrates the results of total environment performance assessment using resource environment load predict data and actual data respectively for process conditions N1, N2 and N3. It could be seen that the total environmental impact assessment result using the prediction value is close to the assessment result using the actual value. The accuracy of the total environmental impact assessment results using the prediction values for the three scenarios N1, N2 and N3 are 93.81%, 93.39% and 93.53% respectively. The results show that the method has a high accuracy and the data which predicted by similarity matching can be used to conduct environmental impact assessment.
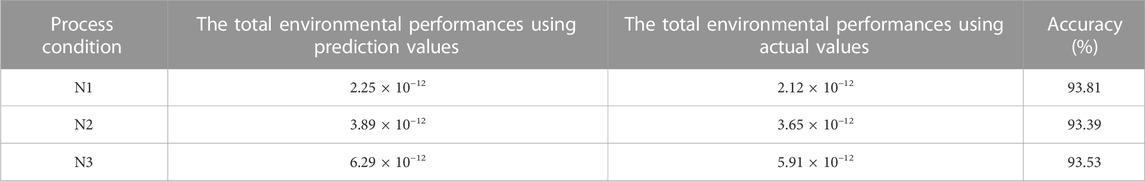
TABLE 11. The accuracy of total environmental impact using resource environment loading prediction data and actual data.
Based on the data in Table 10 and Figure 7 shows the comparison of the percentage of various environment impact categories. Taking the process condition N1 as an example, it is seen that the evaluated percentage for each environment impact category is almost equal to the actual one, as shown in the Figures 7A, 7D. The maximum environment impact category under process condition N1 is HTP, which accounts for about 75.6% of the total environmental impact. About 7.7% of the total environmental impact is consumed by the ADP fossil, which is the secondary maximum impact category. The impact of the GW and AP cannot be ignored due to environment performance of about 7.4% and 6.3% respectively, while the environment performance for the FAETP is the lowest. The process condition N2, N3 can be analyzed in the same way.
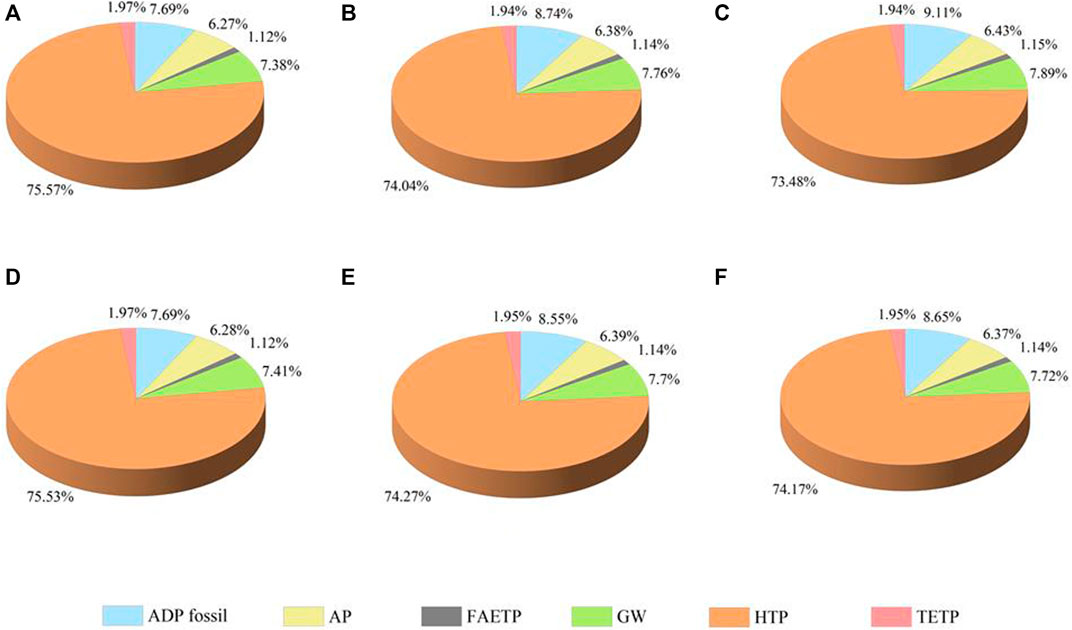
FIGURE 7. Comparison of assessment results for various environment impact categories using the prediction and actual values under different process conditions. (A), (B) and (C) represent the environmental performances results of N1, N2 and N3 using the prediction data, respectively (D), (E), (F) represent the environmental performances results of N1, N2 and N3 using the actual data, respectively.
Figure 8 shows sensitivity analysis of environment impact categories under different process conditions using the data in Table 10. It can be drawn that the change proportion of environmental impact category under different process conditions presents the similar results. As can be seen from Figure 8A, the maximal variation indicates that the ADP Fossil is most sensitive to the change of conditions from N1 to N2. Moreover, the same conclusion is obtained corresponding to the change of conditions from N2 to N3. However, the influence of the change of conditions from N3 to N1 on several environment impact categories are similar. These analyses can provide guidance for adjusting process conditions to improve certain environment performance.
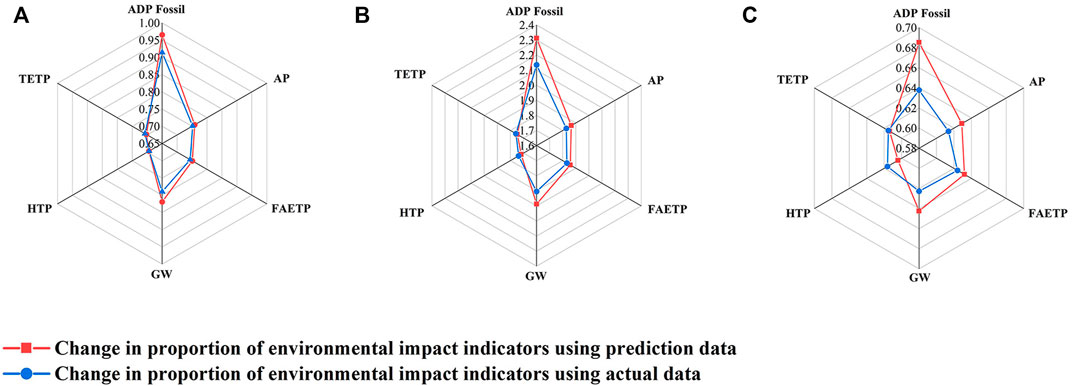
FIGURE 8. Sensitivity analysis of environment impact categories under different process conditions: (A). Change of environment impact category of process condition N2 relative to N1. (B). Change of environment impact category of process condition N3 relative to N1. (C). Change of environment impact category of process condition N2 relative to N3.
5 Conclusion
Resource environment load data are very important for predicting environmental performances of the metal machining process. In this paper, a method based on process condition is proposed to predict the resource environment load data. In the proposed method, the process condition is introduced to comprehensively describe the process type, materials, processing mode, equipment, process parameters and other information of the metal machining process. A resource environment load database based on process condition is developed to store the collected data. After that, a process condition-oriented resource environment load prediction method is proposed, which uses the weighted Euclidean distance method for evaluating the resource environment load data. The results shows that the proposed method is effectively applied to predict the resource environment load under changeable process condition, providing basic data for analyzing and optimizing process condition. In addition, for the evaluated results of environmental performances of the metal material machining process, the accuracy for predicting total environmental performances using the predicted data is more than 93%. Considering the three different process conditions, it can be seen that the largest total environmental performances using the prediction values is under the N3 which agrees with the experimental values. The method is efficient and practical to evaluate the environment performances of different process conditions to help process designers make robust decisions in choosing a better process condition for machining the metal materials. Further, the future work may focus on the influence of quantities of the data sets on the prediction results and the comparison with different data-driven methods.
Data availability statement
The original contributions presented in the study are included in the article/Supplementary Material, further inquiries can be directed to the corresponding author.
Author contributions
Writing—original draft, ZX and HD; Writing—review and editing, YL and HD; methodology and investigation, JX, ZX, and JZ; conceptualization, project administration, supervision, ZX and YL All authors have read and agreed to the published version of the manuscript.
Funding
This research is supported by the Science Fund for Distinguished Young Scholars of Chongqing (Grant No. cstc2020jcyj-jqX0011).
Conflict of interest
HD was employed by Shanghai Aerospace Equipments Manufacturer Co., Ltd.
The remaining authors declare that the research was conducted in the absence of any commercial or financial relationships that could be construed as a potential conflict of interest.
Publisher’s note
All claims expressed in this article are solely those of the authors and do not necessarily represent those of their affiliated organizations, or those of the publisher, the editors and the reviewers. Any product that may be evaluated in this article, or claim that may be made by its manufacturer, is not guaranteed or endorsed by the publisher.
References
Afzal, A. A., Shaukat, M. M., Yilbas, B. S., Akhtar, S. S., and Al-Badour, F. (2021). Life cycle assessment (LCA) of welded of AISI 304 stainless steel using laser beam welding (LBW), friction stir welding (FSW) and gas tungsten arc welding (GTAW), Lasers in Engineering, 48. 33–42 .
Bekker, A. C., and Verlinden, J. C. (2018). Life cycle assessment of wire+ arc additive manufacturing compared to green sand casting and CNC milling in stainless steel. Journal of Cleaner Production 177, 438–447. doi:10.1016/j.jclepro.2017.12.148
Dai, T., Jordaan, S. M., and Wemhoff, A. P. (2022). Gaussian process regression as a replicable, streamlined approach to inventory and uncertainty analysis in life cycle assessment. Environmental Science and Technology 56 (6), 3821–3829. doi:10.1021/acs.est.1c04252
de Souza Zanuto, R., Hassui, A., Lima, F., and Dornfeld, D. A. (2019). Environmental impacts-based milling process planning using a life cycle assessment tool. Journal of Cleaner Production 206, 349–355. doi:10.1016/j.jclepro.2018.09.207
Du, F., He, L., Huang, H., Zhou, T., and Wu, J. (2020). Analysis and multi-objective optimization for reducing energy consumption and improving surface quality during dry machining of 304 stainless steel. Materials 13 (21), 4693. doi:10.3390/ma13214693
Ferrari, A. M., Volpi, L., Settembre-Blundo, D., and García-Muiña, F. E. (2021). Dynamic life cycle assessment (LCA) integrating life cycle inventory (LCI) and Enterprise resource planning (ERP) in an industry 4.0 environment. Journal of Cleaner Production 286, 125314. doi:10.1016/j.jclepro.2020.125314
He, D., Kim, H. C., De Kleine, R., Soo, V. K., Kiziltas, A., Compston, P., et al. (2022a). Life cycle energy and greenhouse gas emissions implications of polyamide 12 recycling from selective laser sintering for an injection-molded automotive component. Journal of Industrial Ecology 26, 1378–1388. doi:10.1111/jiec.13277
He, Y., Zhang, J., Wang, X., Li, Y., Tian, X., and Wang, Y. (2022b). A process scenario oriented Life Cycle Assessment framework for machining processes. Procedia CIRP 105, 332–338. doi:10.1016/j.procir.2022.02.055
International Organization for Standardization (2006). Environmental management: Life cycle assessment; principles and framework. Geneva, Switzerland: ISO.
Ji, W., and Ni, W. (2022). A dynamic control method of population size based on euclidean distance. Journal of Electrical Systems and Information Technology 44 (6), 2195–2206. doi:10.11999/JEIT210322
Kalverkamp, M., Helmers, E., and Pehlken, A. (2020). Impacts of life cycle inventory databases on life cycle assessments: A review by means of a drivetrain case study. Journal of Cleaner Production 269, 121329. doi:10.1016/j.jclepro.2020.121329
Khanna, N., Rodríguez, A., Shah, P., Pereira, O., Rubio-Mateos, A., de Lacalle, L. N. L., et al. (2022). Comparison of dry and liquid carbon dioxide cutting conditions based on machining performance and life cycle assessment for end milling GFRP. The International Journal of Advanced Manufacturing Technology 122 (2), 821–833. doi:10.1007/s00170-022-09843-4
Khettabi, R., Songmene, V., and Masounave, J. (2007). Effect of tool lead angle and chip formation mode on dust emission in dry cutting. Journal of Materials Processing Technology 194 (1-3), 100–109. doi:10.1016/j.jmatprotec.2007.04.005
La Rosa, A. D., Blanco, I., Banatao, D. R., Pastine, S. J., Björklund, A., and Cicala, G. (2018). Innovative chemical process for recycling thermosets cured with Recyclamines® by converting bio-epoxy composites in reusable thermoplastic—An LCA study. Materials 11 (3), 353. doi:10.3390/ma11030353
Liu, Y., Huang, H., Li, L., Wang, Y., Jiang, W., Zhang, C., et al. (2022). Predicting model of resource and environmental burdens for supporting the inventory analysis in welding. The International Journal of Advanced Manufacturing Technology 121, 1945–1955. doi:10.1007/s00170-022-09415-6
Narita, H., Desmira, N., and Fujimoto, H. (2008). “Environmental burden analysis for machining operation using LCA method,” in Manufacturing systems and technologies for the new frontier (London, UK: Springer), 65–68.
Pittner, A., and Rethmeier, M. (2022). Life cycle assessment of fusion welding processes—a case study of resistance spot welding versus laser beam welding. Advanced Engineering Materials 24, 2101343. doi:10.1002/adem.202101343
Shah, P., Bhat, P., and Khanna, N. (2021). Life cycle assessment of drilling Inconel 718 using cryogenic cutting fluids while considering sustainability parameters. Sustainable Energy Technologies and Assessments 43, 100950. doi:10.1016/j.seta.2020.100950
Soares, L. A. P., Firmino, A. S., de Oliveira, J. A., Silva, D. A. L., Saavedra, Y. M. B., and da Silva Moris, V. A. (2022). Comparative LCA of automotive gear hobbing processes with flood lubrication and MQL. International Journal of Advanced Manufacturing Technology 119 (1), 1071–1090. doi:10.1007/s00170-021-08331-5
Terrados-Cristos, M., Ortega-Fernández, F., Alonso-Iglesias, G., Díaz-Piloneta, M., and Fernández-Iglesias, A. (2021). Corrosion prediction of weathered galvanised structures using machine learning techniques. Materials 14 (14), 3906. doi:10.3390/ma14143906
Vukelic, D., Simunovic, K., Simunovic, G., Saric, T., Kanovic, Z., Budak, I., et al. (2020). Evaluation of an environment-friendly turning process of Inconel 601 in dry conditions. Journal of cleaner production 266, 121919. doi:10.1016/j.jclepro.2020.121919
Wang, Y., Murga, A., Long, Z., Yoo, S. J., and Ito, K. (2021). Experimental study of oil mist characteristics generated from minimum quantity lubrication and flood cooling. Energy and Built Environment 2 (1), 45–55. doi:10.1016/j.enbenv.2020.05.005
Warguła, Ł., Kukla, M., Wieczorek, B., and Krawiec, P. (2022). Energy consumption of the wood size reduction processes with employment of a low-power machines with various cutting mechanisms. Renewable Energy 181, 630–639. doi:10.1016/j.renene.2021.09.039
Keywords: environment performance, process condition, resource environment load, similarity matching, machining
Citation: Xing Z, Dai H, Xiong J, Zhang J and Li Y (2023) Resource environment load prediction method for metal material machining based on process condition similarity matching. Front. Mater. 10:1129850. doi: 10.3389/fmats.2023.1129850
Received: 22 December 2022; Accepted: 20 January 2023;
Published: 01 February 2023.
Edited by:
Chen Wang, Tsinghua University, ChinaReviewed by:
Peixun Fan, Tsinghua University, ChinaKe Bi, Beijing University of Posts and Telecommunications (BUPT), China
Kuan Lu, Northwestern Polytechnical University, China
Chuanzhen Huang, Yanshan University, China
Copyright © 2023 Xing, Dai, Xiong, Zhang and Li. This is an open-access article distributed under the terms of the Creative Commons Attribution License (CC BY). The use, distribution or reproduction in other forums is permitted, provided the original author(s) and the copyright owner(s) are credited and that the original publication in this journal is cited, in accordance with accepted academic practice. No use, distribution or reproduction is permitted which does not comply with these terms.
*Correspondence: Yufeng Li, bGl5dWZlbmdjcXVAY3F1LmVkdS5jbg==