 Amr El-said
 Ahmed Awad
 Taha A. El-Sayed
 Yasin Onuralp Özkılıç
 A. Deifalla
 Maged Tawfik
- 1Department of Civil Engineering, The Higher Institute of Engineering, El Shrouk, Cairo, Egypt
- 2Faculty of Engineering, October University for Modern Sciences and Arts, Giza, Egypt
- 3Department of Structural Engineering, Shoubra Faculty of Engineering -Benha University, Cairo, Egypt
- 4Necmettin Erbakan University, Faculty of Engineering, Department of Civil Engineering, Konya, Turkey
- 5Structural Engineering and Construction Management Department, Future University in Engineering, Cairo, Egypt
Fiber-reinforced polymer (FRP)-reinforced concrete (RC) elements fail under one-way shear in a devastating and complicated manner with no adequate warning. In recent decades, there has been pioneering research in this area; however, there is no agreement among researchers regarding mechanically-based models. Thus, in this current study, a plasticity-based model is developed for FRP-RC elements under shear. A selected model was firstly assessed for its accuracy, consistency, and safety against an extensive experimental database. Secondly, a plasticity-based model (i.e., crack shear sliding model) was adapted, refined, and proposed for FRP-RC elements under one-way shear. The two proposed models were found to be reliable and more accurate with respect to selected existing methods. Modeling of FRP’s axial rigidity is more consistent only under Young’s modulus with respect to the experimental database. Several concluding remarks on the selected existing models are outlined and discussed to assist the future development of these models and design codes.
1 Introduction
The dilemma of shear of reinforced concrete (RC)
Since the 1950s, developing a mechanical model with a physical basis for the shear strength of steel-RC elements has been an ongoing area of investigation, with several models developed. The first were empirically based on simplified ones (Zsutty, 1968), which included the basic variables of concrete compressive strength, flexure reinforcement ratio, and element depth and width. Those variables were considered significant for shear strength by many researchers (Leonhardt et al., 1964). Later, the size effect was investigated and considered in those models (Hedman et al., 1978; Bazant and Kim, 1984; Ghannoum, 1998). Thereafter, researchers have considered the following variables: effect of the maximum nominal aggregate size (Bentz, 2005), fracture energy (Bazant and Planas, 1998), and element shear slenderness (Zsutty, 1968). These empirical models have included effective variables based on the results of experimental investigation; however, little attention has been directed to modeling the actual shear mechanism and behavior. Recently, research has aimed at achieving a more profound comprehension of shear behavior (Vecchio and Collins, 1986; Muttoni and Fernández Ruiz, 2008; Tung and Tue, 2016). With technological advances in experimental measurements and numerical analysis, a more refined grasp can be gained of the contribution of each shear mechanism. Therefore, several mechanical models have been developed (Huber et al., 2016; Cavagnis, 2017; Cladera et al., 2017). There are a handful of these in the literature for steel-RC elements under one-way shear, including but not limited to a compression chord model (Zink, 1999; Zararis and Papadakis, 2001). A compression field assumes that the governing mechanism is the aggregate interlock (Vecchio and Collins, 1986; Bentz et al., 2006). The critical shear displacement method (CSDM) (Yang, 2014; Yang et al., 2017) assumes that the delamination crack, which is at the level of flexural reinforcements, is the main trigger for shear failure developing, thus signifying the aggregate interlock effect. A fracture mechanics-based model accounts for residual concrete tensile stress after concrete cracking (Bazant and Kim, 1984; Ghannoum, 1998). The crack sliding shear model (CSSM) is based on a plasticity solution (i.e., upper and lower bound limit analysis theorem) (Fisker and Hagsten, 2016). CSSM thus accounts for the effect of concrete cracking and applies the tensile stress criterion to the flexural cracks’ tips, which connect with a shear crack (Tue et al., 2014). Critical shear crack theory (CSCT) includes several shear mechanisms: residual tensile stress in the shear crack, aggregate interlock, and dowel action in one united failure criterion (Muttoni and Fernández Ruiz, 2019). The multi-action model (MAM) is based on several shear mechanisms, including but not limited to the compression chord. Reineck's model includes all shear mechanisms, especially, the compression zone direct shear mechanism in a kinematically consistent manner (Reineck, 1991). This model is based on the equilibrium between both internal and the external stresses due to shear acting upon cracked concrete teeth. The most recent model is shear crack propagation theory (SCPT), which predicts crack propagation and stresses in uncracked concrete, different shear mechanisms, and stresses at the tip of the crack over the loading history (Classen, 2020). However, SCPT is more of a tool for targeting the mechanical bases of one-way shear in steel-RC elements, to be implemented for developing design models.
Previous experimental studies have shown that the shear behavior of concrete elements can be clarified into four categories based on the shear span-to-depth ratio: 1) short elements (i.e., a/d < 1); 2) deep elements (i.e., 1< a/d <2.5); 3) flexure shear dominated elements (i.e., 2.5< a/d <5.0); 4) flexure dominated elements (i.e., 5.0 < a/d). In both short and deep elements, the behavior is dominated by the arch action, while the flexure and shear element is not.
This current study developed a physically based model for FRP-RC slender elements under one-way shear. The work is part of extensive research that aims to investigate the strength of reinforced concrete elements under shear, punching shear, and torsion (Deifalla and Ghobarah, 2010a; Deifalla and Ghobarah, 2010b; Deifalla et al., 2013; Deifalla et al., 2014; Deifalla and Ghobarah, 2014; Deifalla, 2015; Deifalla et al., 2015; Hassan and Deifalla, 2015; Elmeligy et al., 2017; Deifalla, 2020b; Deifalla, 2020c; Deifalla, 2021a; Ali et al., 2021; Deifalla, 2021b; Deifalla, 2021d; Ebid and Deifalla, 2021; Alkhatib and Deifalla, 2022; Deifalla, 2022; Deifalla and Salem, 2022; Salem and Deifalla, 2022). Many of these include the shear strength of FRP-reinforced concrete elements (Ali et al., 2021; Ebid and Deifalla, 2021). Ali et al. (2021) assessed the available design codes and provided a regression model. Ebid and Deifalla (2021) developed a machine learning model. The current study aims to develop a mechanical model based on the concept of plasticity. The CSSM applies to special cases of one-way shear and punching shear and was thus selected for this study. The original CSSM did not address the shear strength of FRP-RC beams and is only applicable to steel-RC beams. Thus, extending it, based on the experimental database, to FRP-RC beams is a significant refinement. A comprehensive literature review for experimental testing of elements under one-way shear was conducted. The CSSM was refined (RCSSM) to model behavior, and a new mechanical model is proposed for FRP-RC slender elements under one-way shear. A few models were selected from the literature to compare to the developed model; however, a comprehensive assessment of existing shear models for FRP-RC slender elements is not within the scope of this study. The RCSSM was used to compute the element’s strength and compare it with existing models in the literature. Concluding remarks are outlined and discussed.
2 Experimental database
The present study adopts the most comprehensive database for FRP-RC beams available, consisting of 420 specimens tested in 57 studies (Ali et al., 2021; Ebid and Deifalla, 2021). Further details of the database are available in previous studies (Ali et al., 2021; Ebid and Deifalla, 2021). All these experimental tests utilized FRP as the flexure reinforcement. All elements were four-point static loading, which failed in shear. Shear strengthening and retrofitting using FRP is out of the scope for this study. Table 1 show the frequency distribution of the mechanical and geometrical parameters of the test specimens while the details of all data are available in the supplementary file at the end of the paper. Figure 1 shows the frequency of the values used for the effective depth (d), the compressive strength of concrete (
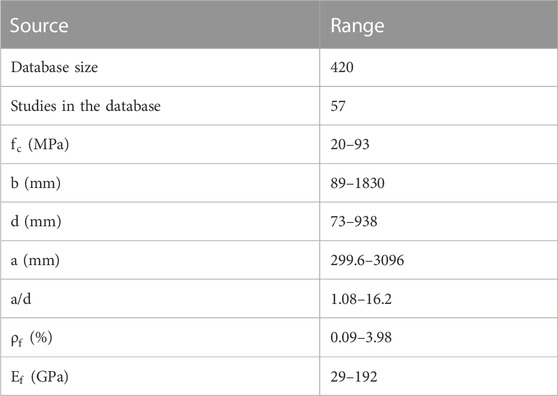
TABLE 1. Database of parameters for slender FRP-RC elements under shear.
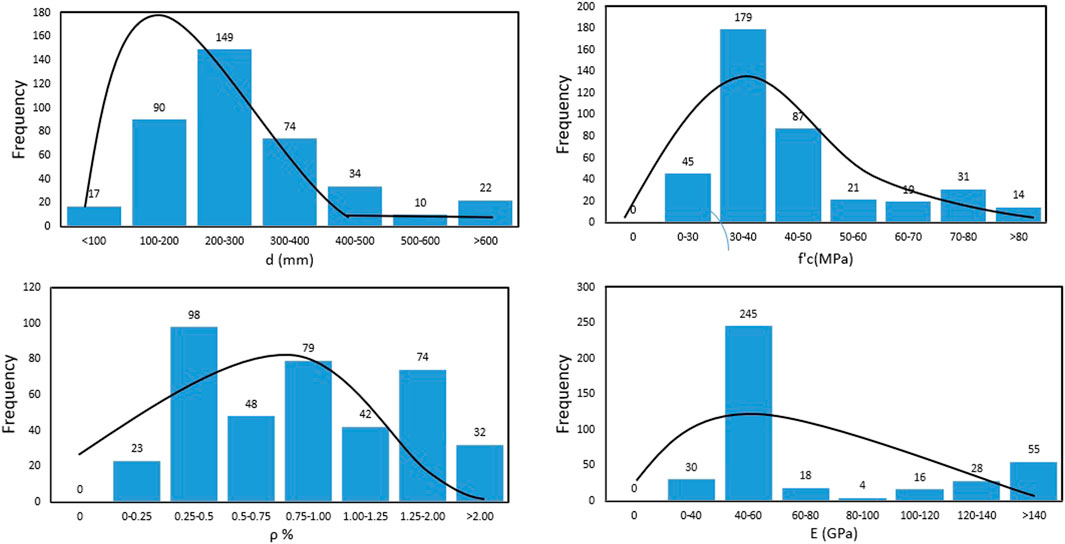
FIGURE 1. Database frequency distribution.
3 Assessment of selected models
Several methods have been developed over the last four decades for FRP-RC beams. The well-known design guide for FRP (ACI) (ACI-440.1R-15, 2015) is based on Tureyen and Frosh’s model (Tureyen et al., 2006). In addition, a few mechanical models were found in the literature that address the shear of slender FRP-reinforced concrete elements. These are based on the following well-known shear models: 1) the M model (Mari et al., 2014), which is based on the compression chord model; 2) the DN model (Dhahir and Nadir, 2018), which is based on the compression field model; 3) the B model (Baghi et al., 2018), which is based on the modified compression field theory (MCFT) (Bentz et al., 2010). The details of these models are out of the scope of this study, and any further details about the application and derivation of these models can be found in the original manuscript (ACI-440.1R-15, 2015; Tureyen et al., 2006; Mari et al., 2014; Dhahir and Nadir, 2018; Baghi et al., 2018; Bentz et al., 2010). Table 2 shows the five methods selected: ACI, M, DN, and B.
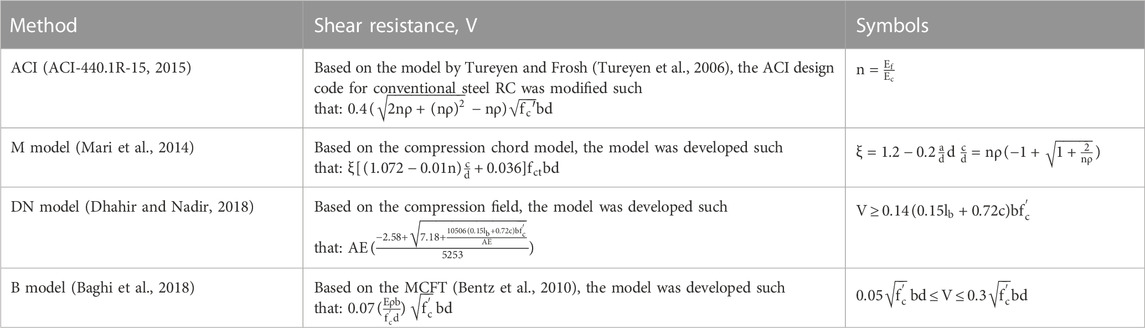
TABLE 2. Summary of selected model and design codes.
3.1 Overall
Figure 2 shows measurements against calculated strength using the ACI, M, DN, and B methods, and the ideal 45-degree line as well as the best-fit-line and the
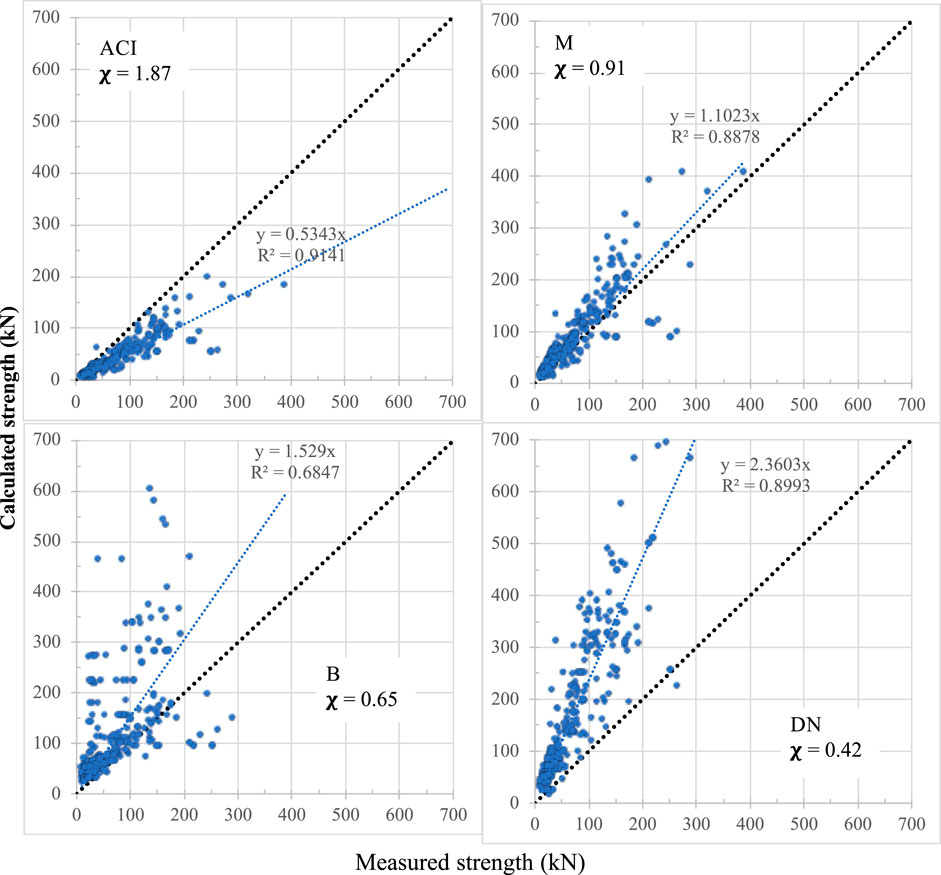
FIGURE 2. Calculated versus measured strength for existing selected models.
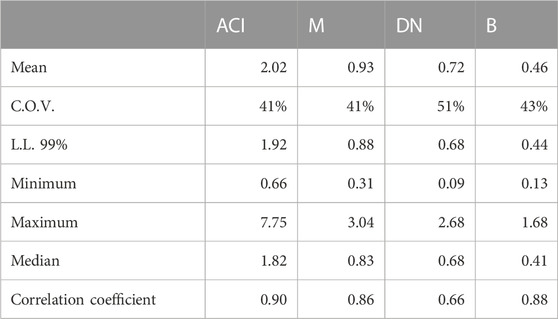
TABLE 3. Statistical measures for SR.
3.2 Against size
Table 4 shows the coefficient of correlation between measured and calculated strengths for selected methods against element size. The correlation coefficient between size and calculated SR for ACI, M, DN, and B was 0.04, 0.28, 0.82, and 0.02, respectively. Thus, the calculated SR for all models, excepting DN, is weakly correlated to size compared to the DN model. In addition, Figure 3 shows the calculated SR for the ACI, M, DN, and B models against size and best-fit-line for each model. The best-fit-line slope for the calculated SR for the ACI, M, DN, and B models against size are 2.0E-4, 6.0E-4, 18E-4, and 0.3E-4, respectively. In all models, safety increases with increased concrete compressive strength. DN is less consistent with size than other models and needs further investigation into its size effect.
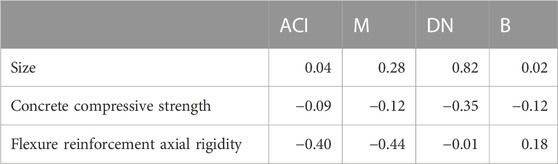
TABLE 4. Correlation coefficient between various methods and variables.
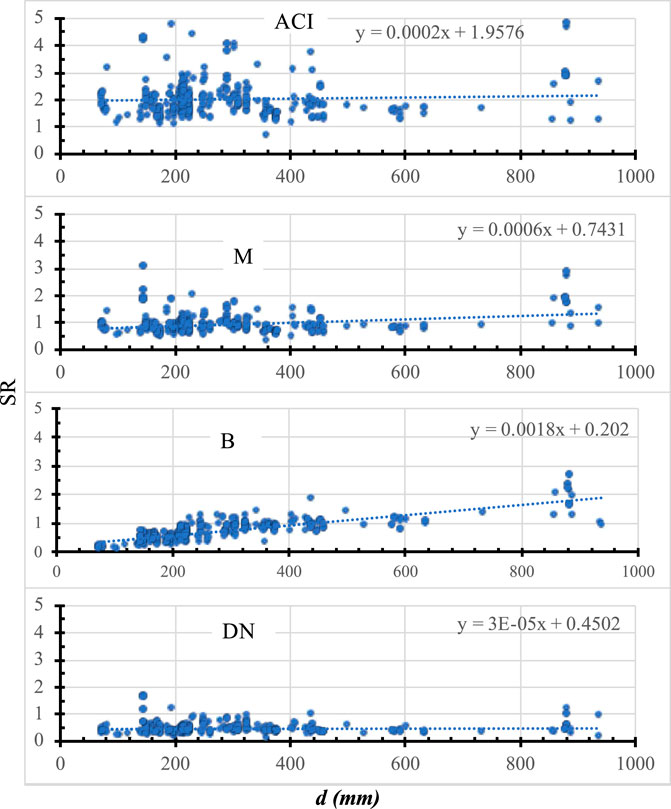
FIGURE 3. SR calculated using selected model versus size.
3.3 Against concrete compressive strength
From Table 4, the correlation coefficient between concrete compressive strength and calculated SR for ACI, M, DN, and B was −0.09, −0.12, −0.35, and −0.12, respectively. Thus, the calculated SR for all models except DN is weakly correlated with concrete compressive strength. In addition, Figure 4 shows the calculated SR for the ACI, M, DN, and B models against concrete compressive strength as well as the best-fit-line for each model. The best-fit-line slope for the calculated SR for the ACI, M, DN, and B models against concrete compressive strength is -47E-4, -28E-4, -81E-4, and -15E-4, respectively. For all models, safety decreases with increased concrete compressive strength. DN is less consistent with concrete compressive strength than other models, and needs further investigation into its concrete compressive strength.
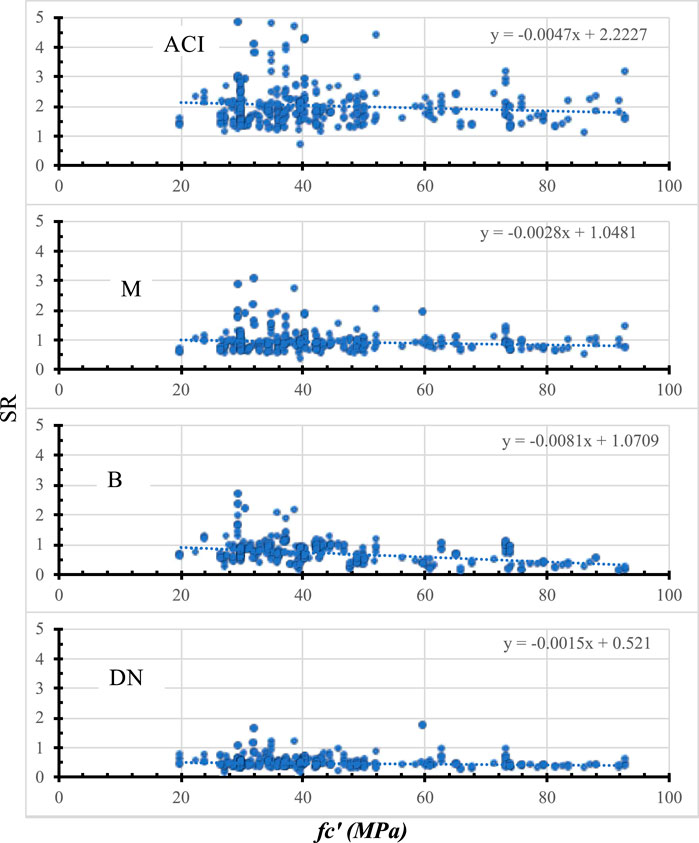
FIGURE 4. SR calculated using selected model versus concrete compressive strength.
3.4 Against flexure reinforcement axial rigidity
From Table 4, the correlation coefficient between flexure reinforcement axial rigidity and calculated SR for ACI, M, DN, and B was −0.40, −0.44, −0.01, and 0.18, respectively. Thus, the calculated SR for the DN and B methods is weakly correlated compared to the ACI and M models; they thus need further investigation into flexure reinforcement axial rigidity. In addition, Figure 5 shows the calculated SR for the ACI, M, DN, and B models against flexure reinforcement axial rigidity as well as the best-fit-line for each model. The best-fit-line slope for the calculated SR for the ACI, M, DN, and B models against flexure reinforcement axial rigidity is −0.69, −0.35, −0.006, and 0.07, respectively. For all models except B, safety decreases with increased flexure reinforcement axial rigidity. This could be because existing models underestimate the dowel action component of lower values for flexure reinforcement axial rigidity. The ACI is less consistent with flexure reinforcement axial rigidity than other models and needs further investigation into its flexure reinforcement axial rigidity.
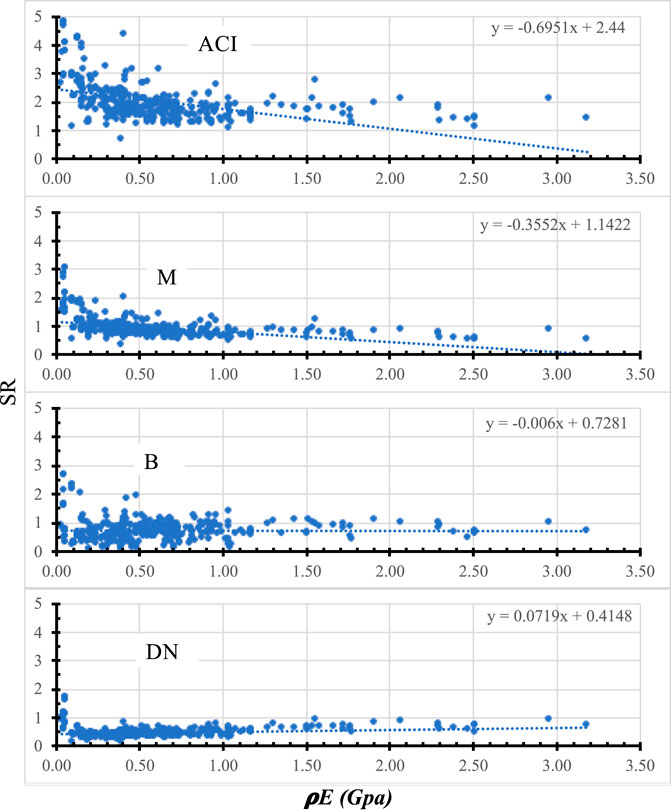
FIGURE 5. SR calculated using selected model versus flexure reinforcement axial rigidity.
4 Refinement of CSSM (RCSSM)
In this study, the CSSM was selected as it is based on plasticity and can be used for both shear and punching shear.
4.1 Background of the crack shear sliding model (CSSM)
This section will briefly outline the original CSSM for one-way shear of concrete elements without stirrups. The CSSM is based on plasticity, where lower and upper boundary solutions for beams under shear are developed. Consider a four-point loading on rectangular beams without stirrups.
4.1.1 Upper bound plasticity solution
An upper bound solution assumes that the beam is divided into two regions with a straight yield-line having an inclination angle β with the beam longitudinal axis, as shown in Figure 6 (Nielsen and Bræstrup, 1975). The middle region (I) is assumed to move vertically using a simple displacement field, while the outer region (II) is assumed to not move. Thus, the work equation is such that:
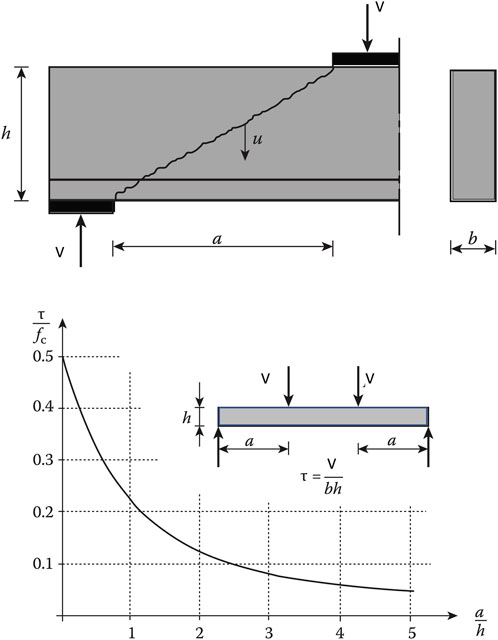
FIGURE 6. Upper bound solution of four-point loading beam.
which represents the energy dissipation in the concrete, while the longitudinal reinforcements have negligible energy dissipation:
Finding the minimum
4.1.2 Lower bound plasticity solution
For the case of a four-point bending concrete beam, Figure 7 shows a schematic that can be used to develop a lower bound solution. Shear is transferred via a single strut in what is called an “arch mechanism”, where axial compression acts on region ABDE. The forces from the reinforcement to the arch are transferred through regions AEF and BCD; consequently, both regions are subjected to biaxial stresses. An anchor plate is used to transfer the anchoring force to the concrete, while the stress is taken as fc. Thus, the measure of the angle subtended by BDE is π/2, while the maximum shear resistance corresponds to the maximum BC, which is obtained at maximum CD. Since a circle having BE as diameter is the locus of point D, the maximum CD = h/2, where BC is such that:
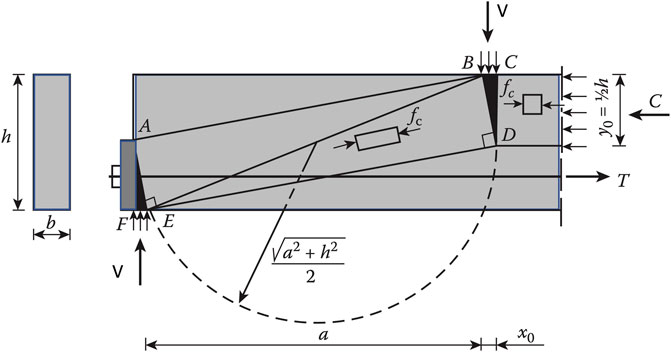
FIGURE 7. Lower bound solution for beam without stirrups.
while the maximum shear capacity is such that:
which can be written in a form like the upper bound solution such that:
which is identical to an upper bound solution. This is, therefore, a unique plastic solution for shear resistance.
4.1.3 Crack sliding model
Figure 8 shows a cracking pattern, starting vertically at the maximum moment cross-section and is then followed by diagonal cracks due to shear. The first crack is usually vertical and close to the point load, starting at the beam bottom soffit; the next one is a diagonal crack directed towards the point load. The load required to initiate diagonal cracks increases with closeness to the support: the cracking load curve. On the other hand, the load resistance for crack sliding decreases with closeness to the support: the shear capacity curve. Therefore, the decrease in the shear span value decreases the angle of inclination of the yield-line and increases the load resistance. The yield-line is defined as the intersection of both the shear capacity and the cracking load. This method predicts much lower shear capacity with respect to the original plastic solution. The yield-line is named the “critical diagonal crack”, where the shear capacity is less than the cracking load. The CSCT is based on the observation that yield lines are formed as a transformation from the critical diagonal crack (Muttoni, 1990). This observation was confirmed by measuring the relative displacement along the critical diagonal crack. Initially, the relative displacement along the critical diagonal crack is perpendicular to the crack, while another component of the displacement is formed parallel to the critical diagonal crack. This indicates that the yield line is a transformation of the critical diagonal crack. The cracking moment and the shear capacity of a diagonal crack can be simplified by using an equivalent plastic distribution for the normal stress; the bending moment resistance of concrete element can be calculated as shown in Figure 11. Thus, the cracking moment for concrete is such that:
where
FIGURE 8. Cracking of beams without stirrups.
where the depth is in mm. Thus, the concrete tensile stress is such that:
For a concrete element with inclined cracks shown in Figure 9, assuming a straight-line from point A to point B, a statically equivalent uniform tensile stress (
where x is the critical diagonal crack horizontal component.
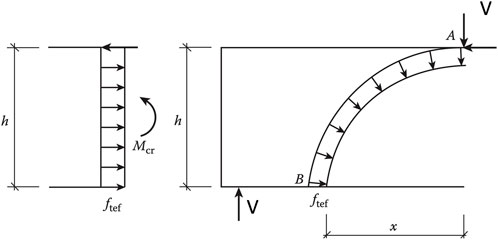
FIGURE 9. Stress distribution across diagonal crack.
Shear resistance is reached due to the failure along the two diagonal yield-lines and the upper face of the reinforcements in tension, which can be calculated if the yield-line could be simplified into a straight line, as shown in Figure 10. In addition, an over-RC element can be assumed; thus, the relative horizontal displacement along the yield-lines and the tensile failure at the reinforcement are negligible.
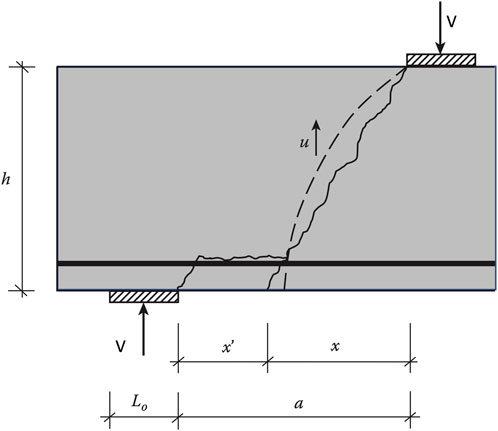
FIGURE 10. Shear failure of a concrete beam with four-point bending loading.
Hence, replacing a with x = a − x′ in the upper bound plasticity solution, shear resistance (V) may be calculated such that:
The cracking load (
where
In addition, the calculated shear strength is compared with the measured ones; thus, a softening factor
where
where
4.2 Model refinement
Based on the observed FRP-RC elements’ behavior, the FRP-RC beams’ different from the steel RC elements is the variable Young’s modulus for FRP, or it is different in the axial rigidity of FRP reinforcements (Hassan and Deifalla, 2015; Ali et al., 2021; Ebid and Deifalla, 2021). Thus, two refined models are proposed—RCSSM-1 and RCSSM-2—where the effect of Young’s modulus and FRP axial rigidity, respectively, are included.
4.2.1 First model
In this model, Young’s modulus was included in the CSSM using multivariable non-linear regression (RCSSM-1); thus, the shear resistance is such that:
where
4.2.2 Second model
In this model, the flexure re/inforcement axial rigidity was included in the CSSM using multivariable non-linear regression (RCSSM-2); thus, the shear resistance is such that:
where
5 Assessment of the RCSSM
The developed model was assessed by comparing its performance to that of the selected models with respect to the overall performance of the selected parameter.
5.1 Overall
Figure 11 shows the measured strength against the calculated strength using the CSSM, RCSSM-1, and RCSSM-2 methods, respectively, as well as the ideal 45-degree line, and the best-fit-line and the
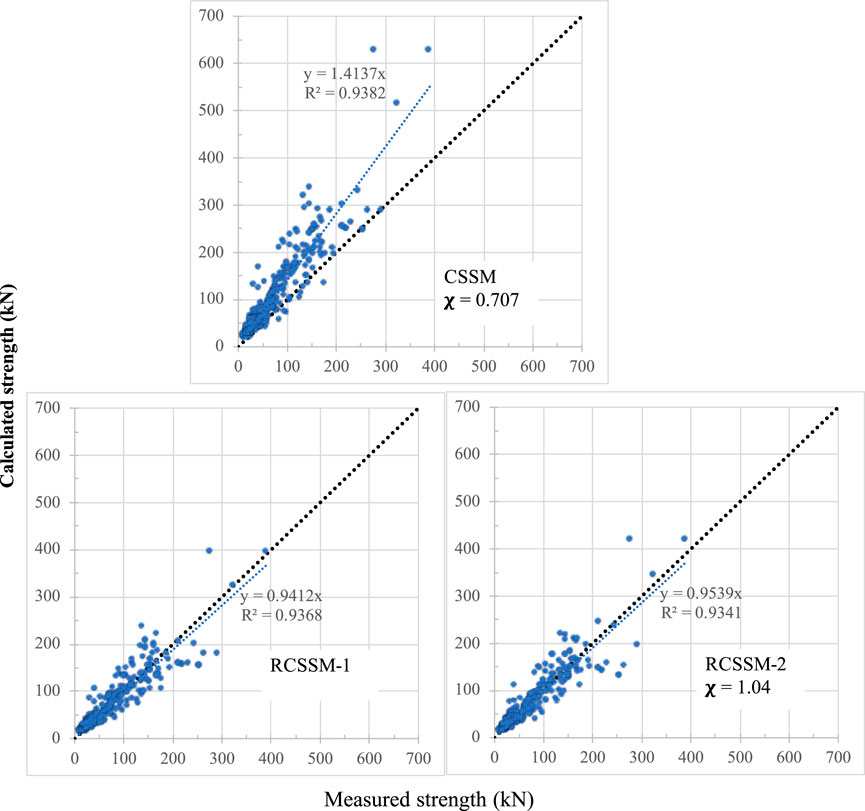
FIGURE 11. Calculated versus measured strength of proposed models.
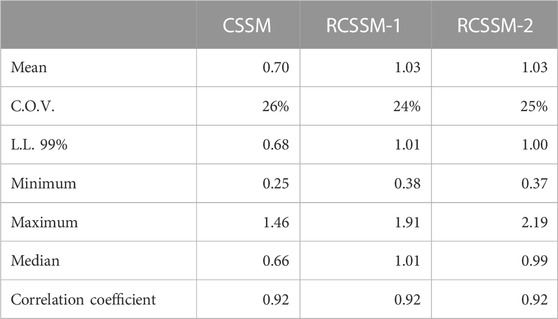
TABLE 5. Statistical measures for calculated SR for proposed models.
5.2 Against size
Table 6 shows the coefficient of correlation between measured strength and that calculated using various methods against size. The correlation coefficient between size and calculated SR for ACI, M, DN, B, CSSM, RCSSM-1, and RCSSM-2 is 0.04, 0.28, 0.82, 0.02, 0.13, 0.19, and 0.24, respectively. Thus, the calculated SR for the proposed models is weakly correlated to size. In addition, Figure 12 shows the calculated SR for ACI, M, DN, and B models against the size as well as the best-fit-line for each model. The best-fit-line slope for the calculated SR for ACI, M, DN, B, CSSM, RCSSM-1, and RCSSM-2 against size is 2.0E-4, 6.0E-4, 18E-4, 0.3E-4, 1E-4, 2E-4, and 3E-4. For all proposed models, safety increases with increased concrete compressive strength. The proposed models are consistent in size compared to other models.
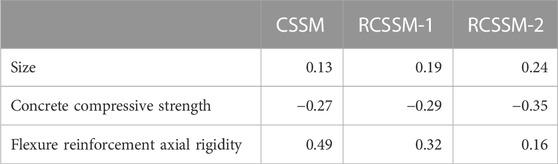
TABLE 6. Correlation coefficient between proposed models and variables.
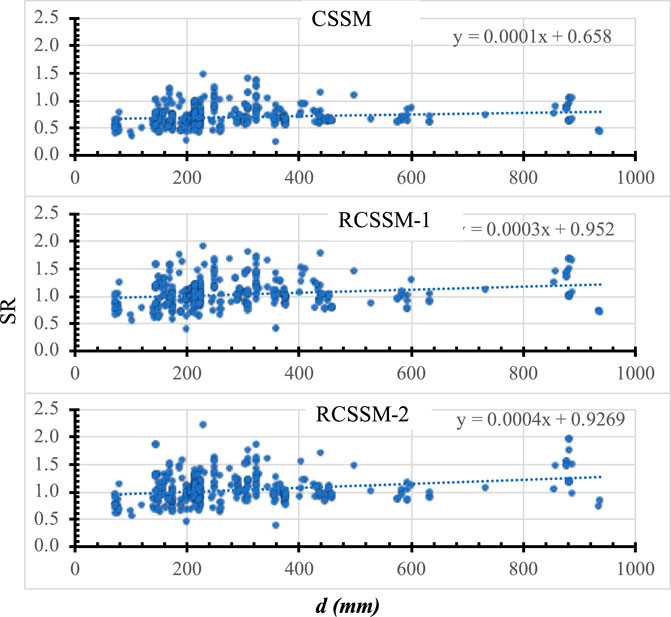
FIGURE 12. SR calculated using proposed models versus size.
5.3 Against concrete compressive strength
Table 6 shows the coefficient of correlation between measured and calculated strength for the selected methods against concrete compressive strength. The correlation coefficient between concrete compressive strength and calculated SR for CSSM, RCSSM-1, and RCSSM-2 is −0.27, −0.29, and −0.35, respectively. Thus, the calculated SR for the proposed models is moderately correlated to concrete compressive strength. In addition, Figure 13 shows the calculated SR for CSSM, RCSSM-1, and RCSSM-2 against concrete compressive strength as well as the best-fit-line for each model. The best-fit-line slope for the calculated SR for CSSM, RCSSM-1, and RCSSM-2 against concrete compressive strength is 31E-4, 45E-4, and 56E-4. For proposed models, safety increases with increased concrete compressive strength—consistent with concrete compressive strength compared to other models.
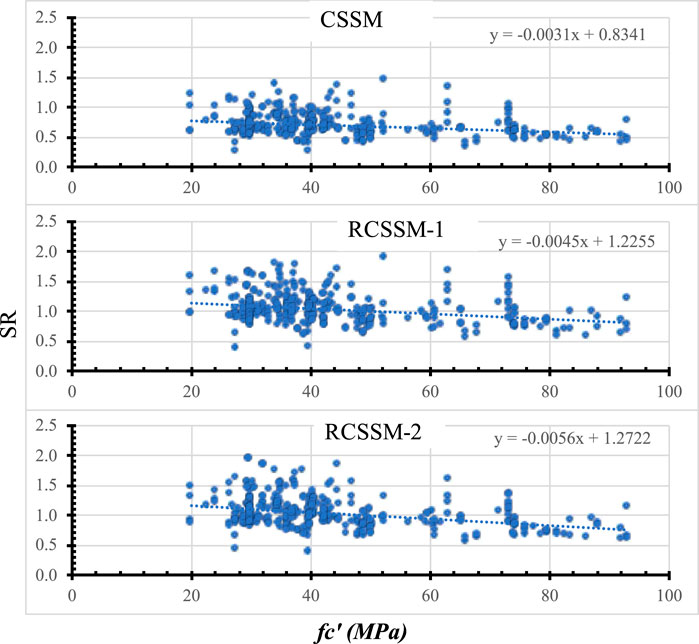
FIGURE 13. SR calculated using proposed models versus concrete compressive strength.
5.4 Against flexure reinforcement axial rigidity
Table 6 shows the coefficient of correlation between measured and calculated strength for the selected methods against flexure reinforcement axial rigidity. The correlation coefficient between flexure reinforcement axial rigidity and calculated SR for ACI, M, DN, B, CSSM, RCSSM-1, and RCSSM-2 is 0.40, 0.40, −0.01, 0.18, 0.49, 0.32, and 0.16, respectively. Thus, the calculated SR for RCSSM-2 is more weakly correlated to the flexure reinforcement axial rigidity than RCSSM-1 and CSSM. In addition, Figure 14 shows the calculated SR for CSSM, RCSSM-1, and RCSSM-2 models the flexure reinforcement axial rigidity as well as the best-fit-line for each model. The best-fit-line slope for the calculated SR for ACI, M, DN, B, CSSM, RCSSM-1, and RCSSM-2 against flexure reinforcement axial rigidity is −0.69, −0.35, −0.006, 0.07, 0.19, 0.16, and 0.08. For all proposed models, safety increases with increased flexure reinforcement axial rigidity. RCSSM-1 is more consistent with flexure reinforcement axial rigidity than RCSSM-1 and CSSM.
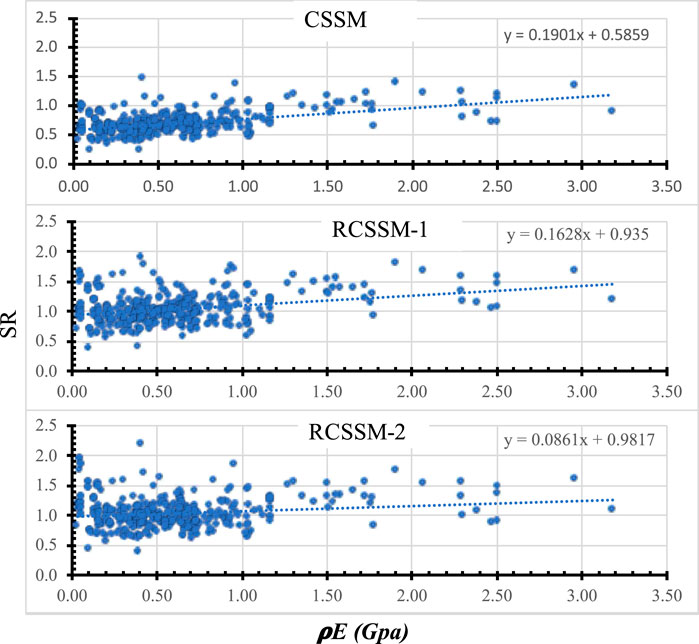
FIGURE 14. SR calculated using proposed models versus flexure reinforcement axial rigidity.
6 Conclusion
This study selected five methods and evaluated them with respect to an intensive experimental database; it concluded that:
- ACI is overly conservative, while the B model is the least conservative.
- The DN model is less consistent than other models with respect to the size effect and concrete compressive strength.
- The ACI and M models are less consistent with respect to flexure reinforcement axial rigidity than other models.
In addition, the critical shear sliding model was adapted and further refined to include the effect of Young’s modulus to fit the experimentally observed strength. The concluding remarks are:
- Adding the effect of Young’s modulus improved the strength predictions with respect to those measured. However, the proposed model was not consistent with flexure reinforcement axial rigidity.
- Adding the effect of flexural reinforcement axial rigidity improved the strength and consistency with respect to flexural reinforcement axial rigidity.
Data availability statement
The original contributions presented in the study are included in the article/Supplementary Material; further inquiries can be directed to the corresponding authors.
Author contributions
Conceptualization, AE-s, TE-S, and AD; methodology, MT, YO, and TE-S; software, MT; validation, AD; formal analysis, AA and YO; investigation, AD and MT; resources, TE-S and AE-s; data curation, AE-s; writing—original draft preparation, AA, TE-S, and AD; writing—review and editing, AE-s, AA, TE-S, YO, AD, and MT; visualization, AD; supervision, AE-s and AD; funding acquisition, AA. All authors have read and agreed to the published version of the manuscript.
Conflict of interest
The authors declare that the research was conducted in the absence of any commercial or financial relationships that could be construed as potential conflicts of interest.
Publisher’s note
All claims expressed in this article are solely those of the authors and do not necessarily represent those of their affiliated organizations, or those of the publisher, the editors, and the reviewers. Any product that may be evaluated in this article, or claim that may be made by its manufacturer, is not guaranteed or endorsed by the publisher.
References
ACI-440.1R-15 (2015). Guide for the design and construction of concrete reinforced with FRP bars, A report by ACI committee 440 Farmington Hills. American Concrete Institute.
Ali, A., Hamady, M., Chalioris, C. E., and Deifalla, A. (2021). Evaluating the shear design equations of FRP-reinforced concrete beams without shear reinforcement. Eng. Struct. 235, 112017. doi:10.1016/j.engstruct.2021.112017
Alkhatib, S., and Deifalla, A. (2022). Punching shear strength of FRP-reinforced concrete slabs without shear reinforcements: A reliability assessment. Polymers 14, 1743. doi:10.3390/polym14091743
Baghi, H., Barros, J. A., Kaszubska, M., and Kotynia, R. (2018). Shear behavior of concrete beams reinforced exclusively with longitudinal glass fiber reinforced polymer bars: Analytical model. Struct. Concr. 19 (1), 162–173. doi:10.1002/suco.201700175
Bazant, Z. P., and Kim, J.-K. (1984). Size effect in shear failure of longitudinally reinforced beams. ACI J. 81, 456–468.
Bazant, Z. P., and Planas, J. (1998). Fracture and size effect in concrete and other quasibrittle materials. Boca Raton, FL, USA: CRC Press. ISBN 0-849-8284-X.
Bentz, E. C., Massam, L., and Collins, M. P. (2010). Shear strength of large concrete members with FRP reinforcement. J. Compos. Constr. 14, 637–646. doi:10.1061/(asce)cc.1943-5614.0000108
Bentz, E. C. (2005). Empirical modeling of reinforced concrete shear strength size effect for members without. Stirrups. ACI Struct. J. 102, 232–241.
Bentz, E. C., Vecchio, F. J., and Collins, M. P. (2006). Simplified Modified Compression Field Theory for calculating shear strength of reinforced concrete members. ACI Struct. J. 103, 614–624. doi:10.14359/16438
Cavagnis, F. (2017). Shear in reinforced concrete without transverse reinforcement: From refined experimental measurements to mechanical models. Ph.D. Thesis. Lausanne, Switzerland: Ecole Polytechnique Fédérale de Lausanne.
Cladera, A., Marí, A., Bairán, J.-M., Oller, E., and Ribas, C. (2017). One-way shear design method based on a multi-action model: A compromise between simplicity and accuracy. Concr. Int. 40, 46.
Classen, M. (2020). Shear Crack Propagation Theory (SCPT)–The mechanical solution to the riddle of shear in RC members without shear reinforcement. Eng. Struct. 210, 110207. doi:10.1016/j.engstruct.2020.110207
Deifalla, A. (2021b). A mechanical model for concrete slabs subjected to combined punching shear and in-plane tensile forces. Eng. Struct. 231 (231), 111787. doi:10.1016/j.engstruct.2020.111787
Deifalla, A. (2021d). A strength and deformation model for prestressed lightweight concrete slabs under two-way shear. Adv. Struct. Eng. 24, 3144–3155. doi:10.1177/13694332211020408
Deifalla, A. (2021a). Refining the torsion design of fibered concrete beams reinforced with FRP using multi-variable non-linear regression analysis for experimental results. Eng. Struct. 224, 111394. doi:10.1016/j.engstruct.2020.111394
Deifalla, A. (2020b). Strength and ductility of lightweight reinforced concrete slabs under punching shear. Structures 27 (2020), 2329–2345. doi:10.1016/j.istruc.2020.08.002
Deifalla, A. (2020c). Torsion design of lightweight concrete beams without or with fibers: A comparative study and a refined cracking torque formula. Structures 28, 786–802. doi:10.1016/j.istruc.2020.09.004
Deifalla, A., Awad, A., and El-Garhy, M. (2013). Effectiveness of externally bonded CFRP strips for strengthening flanged beams under torsion: An experimental study. Eng. Struct. 56, 2065–2075. doi:10.1016/j.engstruct.2013.08.027
Deifalla, A., and Ghobarah, A. (2014). Behavior and analysis of inverted T-shaped RC beams under shear and torsion. Eng. Struct. 62, 57–70. doi:10.1016/j.engstruct.2014.02.011
Deifalla, A., and Ghobarah, A. (2010). Full torsional behavior of RC beams wrapped with FRP: Analytical model. Compos. Constr. 14 (3), 289–300. ASCE, May/June 2010. doi:10.1061/(asce)cc.1943-5614.0000085
Deifalla, A., and Ghobarah, A. (2010). Strengthening RC T-beams subjected to combined torsion and shear using FRP fabrics – experimental study. Compos. Constr. 14 (3), 301–311. ASCE, May/June 2010. doi:10.1061/(asce)cc.1943-5614.0000091
Deifalla, A., Hamed, M., Saleh, A., and Ali, T. (2014). Exploring GFRP bars as reinforcement for rectangular and L-shaped beams subjected to significant torsion: An experimental study. Eng. Struct. 59, 776–786. doi:10.1016/j.engstruct.2013.11.027
Deifalla, A., Khali, M. S., and Abdelrahman, A. (2015). Simplified model for the torsional strength of concrete beams with GFRP stirrups. Compos. Constr. ASCE 19 (1), 04014032. doi:10.1061/(ASCE)CC.19435614.0000498
Deifalla, A. (2022). Punching shear strength and deformation for FRP-reinforced concrete slabs without shear reinforcements. Case Stud. Constr. Mater. 16, e00925. doi:10.1016/j.cscm.2022.e00925
Deifalla, A., and Salem, N. M. (2022). A machine learning model for torsion strength of externally bonded FRP-reinforced concrete beams. Polymers 14, 1824. doi:10.3390/polym14091824
Deifalla, A. (2015). Torsional behavior of rectangular and flanged concrete beams with FRP reinforcements. J. Struct. Eng. 141, 04015068. ASCE. doi:10.1061/(ASCE)ST.1943-541X.0001322
Dhahir, M. K., and Nadir, W. (2018). A compression field-based model to assess the shear strength of concrete beams reinforced with longitudinal FRP bars. Constr. Build. Mater. 191, 736–751. doi:10.1016/j.conbuildmat.2018.10.036
Ebid, A., and Deifalla, A. (2021). Prediction of shear strength of FRP reinforced beams with and without stirrups using (GP) technique. Ain Shams Eng. J. 12 (3), 2493–2510. doi:10.1016/j.asej.2021.02.006
Elmeligy, O., El-Nemr, A. M., and Deifalla, A. (2017). “Reevaluating the modified shear provision of CAN/CSA S806-12 for concrete beams reinforced with FRP stirrups,” in AEI conference 2017 (OKLAHOMA CITY). ASCE. doi:10.1061/9780784480502.027
Fisker, J., and Hagsten, L. G. (2016). Mechanical model for the shear capacity of R/C beams without stirrups: A proposal based on limit analysis. Eng. Struct. 115, 220–231. doi:10.1016/j.engstruct.2016.02.035
Ghannoum, W. M. (1998). Size effect on shear strength of reinforced concrete beams. Master’s Thesis. Montréal, QC Canada: Mc Gill University.
Hassan, M. M., and Deifalla, A. (2015). Evaluating the new CAN/CSA-S806-12 torsion provisions for concrete beams with FRP reinforcements. Mater. Struct. 49, 2715–2729. doi:10.1617/s11527-015-0680-9
Hedman, O., and Losberg, A. (1978). “Design of concrete structures with regard to shear forces,” in Shear and torsion: Explanatory and viewpoint papers on model code chapters 11 and 12 prepared by members of CEB commission V. Editors P. E. Regan, and H. P. J. Taylor (Lausanne, Switzerland: International Federation for Structural Concrete), 184–209.
Huber, P., Huber, T., and Kollegger, J. (2016). Investigation of the shear behavior of RC beams on the basis of measured crack kinematics. Eng. Struct. 113, 41–58. doi:10.1016/j.engstruct.2016.01.025
Leonhardt, F., Walther, R., and Dilger, W. (1964). Schubversuche an Durchlauftragern (Zweifeldrige Stahlbetonbalken mit und ohne Schubbewehrung): DAfStb-Heft 163. Berlin, Germany: Ernst and Sohn.
Mari, A., Cladera, A., Oller, E., and Bairan, J. (2014). Shear design of FRP reinforced concrete beams without transverse reinforcement. Compos. Part B Eng. 57, 228–241. doi:10.1016/j.compositesb.2013.10.005
Muttoni, A. (1990). Die Anwendbarkeit der Plasticitatstheorie in der Bemessung von Stahlbeton, ETH Zurich, Institut Fur Baustatik und Konstruktion, 176. Bericht Nr.
Muttoni, A., and Fernández Ruiz, M. (2019). From experimental evidence to mechanical modeling and design expressions: The Critical Shear Crack Theory for shear design. Struct. Concr. 111, 1464–1480. doi:10.1002/suco.201900193
Muttoni, A., and Fernández Ruiz, M. (2008). Shear strength of members without transverse reinforcement as function of critical shear crack width. ACI Struct. J. 105, 163–172.
Nielsen, M. P., and Bræstrup, M. W. (1975). Plastic shear strength of reinforced concrete beams. Bygningsstat. Medd. 46 (3), 61–99.
Reineck, K.-H. (1991). Ultimate sheer force of structural concrete members without transverse reinforcement derived from a mechanical model. ACI Struct. J. 88, 592–602.
Salem, N. M., and Deifalla, A. (2022). Evaluation of the strength of slab-column connections with FRPs using machine learning algorithms. Polymers 14, 1517. doi:10.3390/polym14081517
Tue, N. V., Theiler, W., and Tung, N. D. (2014). Schubverhalten von Biegebauteilen ohne Querkraftbewehrung. Bet. Stahlbetonbau 109, 666–677. doi:10.1002/best.201400058
Tung, N. D., and Tue, N. V. (2016). A new approach to shear design of slender reinforced concrete members without transverse reinforcement. Eng. Struct. 107, 180–194. doi:10.1016/j.engstruct.2015.04.015
Tureyen, A. K., Wolf, T. S., and Frosch, R. J. (2006). Shear strength of reinforced concrete T-beams without transverse reinforcement. ACI Struct. J. 103, 656–663. doi:10.14359/16917
Vecchio, F. J., and Collins, M. P. (1986). The modified compression-field theory for reinforced concrete elements subjected to shear. ACI Struct. J. 83, 219–231. doi:10.14359/10416
Yang, Y. (2014). Shear behaviour of reinforced concrete members without shear reinforcement: A new look at an old problem. Ph.D. Thesis. Delft, Netherlands: Delft University of Technology.
Yang, Y., Walraven, J., and Uijl, J. d. (2017). Shear behavior of reinforced concrete beams without transverse reinforcement based on critical shear displacement. J. Struct. Eng. 143, 1–13. doi:10.1061/(ASCE)ST.1943-541X.0001608
Zararis, P. D., and Papadakis, G. C. (2001). Diagonal shear failure and size effect in RC beams without web reinforcement. J. Struct. Eng. 127, 733–742. doi:10.1061/(asce)0733-9445(2001)127:7(733)
Zink, M. (1999). Zum Biegeschubversagen Schlanker Bauteile aus Hochleistungsbeton Mit und Ohne Vorspannung. Ph.D. Thesis. Leipzig, Germany: Universitat Leipzig.
Keywords: one-way shear, FRP, crack sliding model, plasticity, slender
Citation: El-said A, Awad A, El-Sayed TA, Özkılıç YO, Deifalla A and Tawfik M (2023) Crack sliding model for non-shear FRP-reinforced slender concrete elements under shear. Front. Mater. 10:1126806. doi: 10.3389/fmats.2023.1126806
Received: 18 December 2022; Accepted: 28 February 2023;
Published: 20 March 2023.
Edited by:
Zhiqiang Dong, Southeast University, ChinaReviewed by:
Jun-Jie Zeng, Guangdong University of Technology, ChinaDaxu Zhang, Shanghai Jiao Tong University, China
Copyright © 2023 El-said, Awad, El-Sayed, Özkılıç, Deifalla and Tawfik. This is an open-access article distributed under the terms of the Creative Commons Attribution License (CC BY). The use, distribution or reproduction in other forums is permitted, provided the original author(s) and the copyright owner(s) are credited and that the original publication in this journal is cited, in accordance with accepted academic practice. No use, distribution or reproduction is permitted which does not comply with these terms.
*Correspondence: Taha A. El-Sayed, dGFoYS5pYnJhaGltQGZlbmcuYnUuZWR1LmVn; A. Deifalla, YWhtZWQuZGVpZmFsbGFAZnVlLmVkdS5lZw==