 Xi Peng
 Kunpeng Wang4
- 1College of Civil Engineering and Architecture, Zhejiang University, Hangzhou, China
- 2School of Civil and Transportation Engineering, Ningbo University of Technology, Ningbo, China
- 3School of Highway, Chang’an University, Xi’an, Shaanxi, China
- 4CCCC Highway Bridge National Engineering Research Center Co., Ltd., Beijing, China
- 5Ningbo Roaby Technology Industrial Group Co., Ltd., Ningbo, China
Vehicle load is an important factor for the fatigue damage of the orthotropic steel decks. The traffic vehicles for port highway in China are mainly multi-axle container trucks, which show different characteristics from conventional highways. Based on the multi-period traffic flow data collected by weight-in-motion system of a bridge over the sea in Zhejiang, China, this study has investigated the traffic load characteristics of the port highway bridge. Eight typical vehicles of fatigue load spectrum are classified according to the number of axles and wheelbase. The distribution characteristics of the gross vehicle weight (GVW) and axle weights of typical vehicles are analyzed by lane. Depended on the equivalent fatigue damage principle, the vehicle load spectrum for fatigue evaluation of the port highway bridges is established. The results show that the average proportion of the trucks (weighing greater than 3 tons) in the total traffic flow is 73.2%, and trucks with more than four-axle accounted for 89.0%. Heavy vehicles are mainly concentrated on the outer lanes, and the probability of vehicles driving in the heavy lane increases with the increase of gross vehicle weight. The maximum equivalent gross vehicle weight is 62.5 tons, which appeared in V7 in the exiting island direction. The simplified fatigue vehicle model in the heavy lane for Chinese port highway bridges is proposed, based on the six-axle vehicle which contributed the most fatigue damage. The proposed fatigue load model can better represent the actual traffic load level of port highway bridges in China.
1 Introduction
Fatigue cracking of orthotropic steel decks appears in more and more bridges at home and abroad under long-term work, which has become one of the key problems affecting the safety and durability of steel bridges. The traffic flow of highway bridge in China is increasing day by day, and truck overloading exists objectively at the same time. For the port highway bridge, the fatigue problem is more prominent because the main vehicles are multi-axle container trucks. Therefore, it is of practical significance to study the fatigue vehicle load spectrum of port highway bridges in China. The fatigue stress of orthotropic steel decks is generally controlled by fatigue load model recommended by the code. The fatigue damage of orthotropic steel decks caused by axle weights and wheelbases of different vehicles is different. The analysis of the deformation and stress of the bridge based on the measured traffic flow information can truly reflect the current performance of the bridge (Peng and Yang, 2021; Yang and Peng, 2021; Peng and Yang, 2023).
The fatigue load of orthotropic steel decks should be subdivided into axle weights and wheelbases level, which can be divided into three forms: fatigue vehicle load spectrum, axle weights spectrum and standard fatigue vehicle model. In 1978, Schilling and Klippstein, (1978) proposed to use the triaxial fatigue vehicle model with heavy 222 kN for bridge anti-fatigue design. Raju et al. (1990) improved the fatigue load model, put forward the concept of equivalent lane moment, and applied it to the calculation of equivalent stress, which greatly improved the calculation accuracy of the fatigue model. Laman and Nowak, (1996) according to the equivalent principle of fatigue damage, the three-axle fatigue vehicle model is recommended to simulate the 2-axle∼9-axle freight vehicle, and the four-axle fatigue vehicle model is used to simulate the 10-axle and 11-axle freight vehicle, which further improves the calculation accuracy and applicable scope of the fatigue load model. On the basis of their predecessors, Chotickai and Bowman, (2006) improved the three-axle and four-axle fatigue load model, gave the distribution ratio of each axle load, and considered the influence of traffic flow and typical vehicles, which further enhanced the adaptability of the fatigue load model. Tong et al. (1997) studied the fatigue load of urban road bridges, and obtained the fatigue load spectra of several different types of operating vehicles. Miao (2001); Miao and Chan (2002) used the weigh-in-motion (WIM) system to collect the vehicle load data of small and medium-span bridges in Hong Kong for 10 years, and established the corresponding vehicle load model. Zhou et al, (2010) based on the measured traffic load data and reliability theory analysis, a standard vehicle model for fatigue resistance of steel bridges in China is established, which provides a reference for the determination of fatigue load in Chinese code for highway steel bridges.
Lao et al. (2020) established a random traffic flow load model based on WIM data of a highway vehicle, and established the optimal Rice boundary cross-threshold rate model. Qu et al. (2020) used the generalized matrix method to analyze the traffic load of Jinan-Qingdao expressway in Shandong Province, and established a vehicle fatigue model. Li et al. (2020) established a fatigue vehicle load statistical model of Wuhan medium and small span urban highway bridge based on axle weights and wheelbases by using the WIM data of a long-span urban highway bridge in Wuhan. Lao et al. (2020) evaluate the tonnage of truck freight traffic by combining WIM data and telemetry traffic monitoring (TTM) point flow data, which can be used to evaluate freight performance in statewide areas with low calculation cost. Su et al. (2020) counted the vehicle information of a bridge by WIM, analyzed the typical vehicles and GVW, distribution characteristics of the vehicle, and established the fatigue vehicle load spectrum for low-grade highway in Yunnan mountainous area. Lai et al. (2020) based on the vehicle load parameters collected by the WIM module, the fatigue load spectrum of the equivalent model vehicle is obtained by using the statistical analysis method. Yan et al. (2021) combined with WIM data, analyzed the vehicle load model of heavy traffic highway in Fujian Province, and analyzed the vehicle load effect of typical highway simply supported beam bridge and continuous beam bridge. Chen and Shi (2021) studied the vehicle load characteristics and multi-lane load model of expressway reconstruction and expansion bridges in Guangdong Province, and put forward the multi-lane load model of small and medium-span bridges in Guangdong Province. Zhao et al. (2021) based on the WIM data of Qixiashan Yangtze River Bridge in Nanjing, the distribution characteristics and change law of vehicles with different axle number in each lane are studied, and the variation law of axle weights with GVW of vehicles with different axle number is analyzed. He and Wang (2022) based on the vehicle load data monitored by the WIM of a bridge, the fatigue load spectrum is established according to the fitted vehicle weight probability distribution model, and the fatigue damage contribution rate of each vehicle is calculated from the equivalent axle weights data. Wang et al. (2022) studied a vehicle load identification technology based on orthotropic steel deck stress monitoring data, verified the effectiveness and anti-noise performance of the algorithm through numerical simulation, and designed a model test to further verify the proposed theory. Wang and Nagayama (2022) proposed a response spectrum model to predict the root mean square acceleration response of bridges caused by bicycles, and deduced the mathematical model of vehicle induced load. Fu et al. (2022) combined with the traffic data of 35 expressway stations in 15 provinces in China, obtained the fatigue load spectrum, calculated the equivalent coefficient of each vehicle at all stations, and put forward three levels of design frequency. Deng et al. (2021) established the fatigue load spectrum and discussed the vehicle model of six-axle vehicle separately, and put forward a new method to study the fatigue vehicle model. Maljaars (2020) obtains the required partial coefficient through the applicability of the load effect evaluation model in WIM database. Zhou et al. (2021) analyzed the non-uniformity of truck traffic volume and truck load distribution in multi-lane traffic flow, and proposed a multi-lane coefficient model to calculate the load response of meeting multi-lane bridge. Yu et al. (2021) proposed an improved fatigue crack growth prediction method based on time scale, and directly predicted the fatigue crack length of steel bridge in time domain by using the stress history obtained by actual traffic load.
Based on the measured traffic flow information obtained by WIM system, the traffic load characteristics of a port highway bridge in the coastal area of China are analyzed by mathematical statistics, and the fatigue vehicle load spectrum and fatigue vehicle model are studied, in order to provide reference for anti-fatigue design and fatigue life assessment of similar bridges in the future.
2 Vehicle load measured from the WIM system
The research object is the steel box girder cable-stayed bridge with double towers and single cable plane on the coastal port highway of China, which is (50 + 158+392 + 158+50) m spans, as shown in Figure 1. The main line has twin four lanes, and the design speed is 80 km/h.

FIGURE 1. Elevation layout of the bridge on the Chinese port highway.
The bridge has been opened to traffic since November 2013. As the main passage to a coastal port area, the bridge has a high proportion of trucks and high traffic pressure, and the driving vehicles are mainly multi-axle container vehicles. All vehicles passing through the observation point can be automatically monitored in time, and the detailed information of traffic load can be collected and recorded continuously, including vehicles types, locations, axle weights, GVW, speed and arrival time and other parameters. Regular inspection ensures that the data acquisition sensor is in good condition, the single-axis weighing error of the WIM system is less than 5%, and the degree of confidence is more than 90%.
The vehicle load information of the bridge for 34 months from September 2014 to June 2017 was collected, with a total of 10, 271, 388 data samples. Many uncertain factors in the moving process of the vehicle will interfere with the data input of the WIM system, especially for the vehicles at high speed. Before using the WIM data, the validity of the data is verified. Through video data from traffic authorities and the vehicle basic parameters, the basis for judging valid data is established. The samples were judged one by one by Matlab programming. There are 41,425 abnormal data, and the abnormal rate of data is 0.40%, indicating that the vehicle load data provided by WIM system is true and effective.
3 Statistical models of vehicle load
3.1 The constitution of traffic flow
The sample data include 34 months of vehicle load information for a total of 1,031 days. The collection time span is large and the sample capacity is large. During this period, there were 10,229,963 vehicles passing through the bridge, and 7,483,624 vehicles are more than 3 tons, which are called trucks. Figure 2 shows the average monthly traffic volume (AMTV) of all vehicles and trucks from 2014 to 2017. The AMTV of the bridge showed a jump growth from 2015 to 2016, with an increase of about 122,000 vehicles, accounting for 52.4%. This phenomenon is caused by its regionality and policy. The bridge under investigation is located in the second channel between the port island and the inland, which was officially used at the end of 2013. At the beginning of operation, the vehicles were still driven along the original channel. After 2 years of use, this route was gradually popularized because of the higher road level and better driving comfort. From 2016 to 2017, the monthly traffic volume increased by about 3.5%, showing a regular growth trend. From 2014 to 2017, the proportion of trucks in total vehicles was 0.71, 0.68, 0.74, and 0.77, respectively.
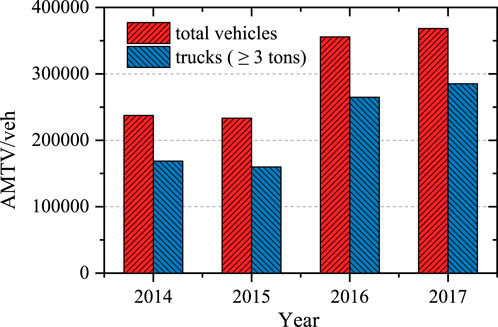
FIGURE 2. Yearly AMTV of vehicles.
Figure 3 showns the average daily traffic volume (ADTV) changes of the total vehicles and the trucks, which have the growing trend as a whole. In the vicinity of February and October, the ADTV decreases significantly. It can be inferred that this change is caused by holidays. In China, there are National Day holidays (7 days) in October and Spring Festival holidays (about 10 days) in February, which caused the rest of some drivers. The proportion of trucks in the total vehicles is basically stable, of which the average value is 73.2% in each month, and the maximum value is 82.1% appeared in July 2016. It shows that the main function of this highway bridge in the port area is freight transportation. Compared with the general highway, the proportion of trucks is obviously higher.

FIGURE 3. Monthly ADTV of vehicles.
Monthly ADTV of vehicles by axle number is shown in Figure 4. In the samples, the number of two-axle vehicles is the largest, with the maximum ADTV is 4,649 vehicles, which appeared in December 2016. This type of vehicles is mainly composed of minibuses, medium-sized buses, minivans, etc. The number of four-axle vehicles ranked second, with the maximum ADTV is 4,287 vehicles, which also appeared in December 2016. The ADTV of two-axle vehicles and four-axle vehicles decreased suddenly in five different months, which occurred in Chinese holidays, indicating that the traffic flow of two-axle vehicles and four-axle vehicles was greatly affected by holidays. The ADTV of other axle vehicles increases with the month, and their relative proportion in the total traffic flow is basically stable.
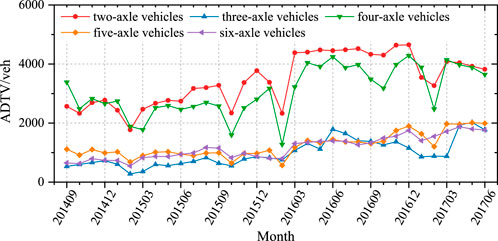
FIGURE 4. Monthly ADTV of vehicles by axle number.
In BS5400 (British Standards Institution, 2000), the vehicles with weight less than 3 tons will not cause fatigue damage to bridges, while in Eurocode (European Committee for Standardization, 2006), the limit value is 10 tons. For the sake of safety, the subsequent study will only consider the vehicles with weight greater than 3 tons, also known as trucks. Monthly ADTV of trucks by axle number is shown in Figure 5. After removing the vehicles with weight less than or equal to 3 tons, the number of two-axle vehicles decreased by 76.9%, while others remained basically unchanged.
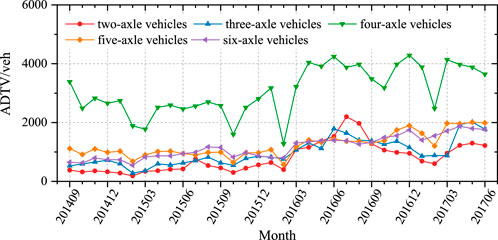
FIGURE 5. Monthly ADTV of trucks (≥3 tons) by axle number.
The ADTV and relative proportion of vehicles by axle number are shown in Figure 6. The ADTV of all vehicles is 9,922 vehicles, most of which are two-axle vehicles and four-axle vehicles, accounting for 66.0% of the total. The ADTV of trucks is 7,259 vehicles. The proportion of two-axle vehicles decreased from 34.9% to 11.0%, with the least number; The proportion of four-axle or more axles trucks is as high as 89.0%, and the proportion of four-axle trucks is the largest, accounting for 42.5%; Three-axle, five-axle and six-axle vehicles together accounted for 46.5%.
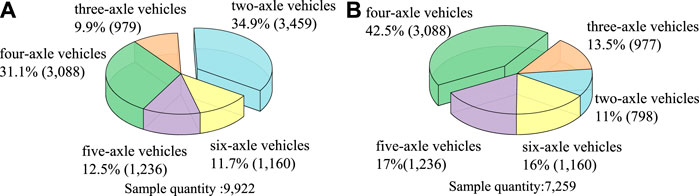
FIGURE 6. The ADTV and relative proportion of vehicles by axle number: (A) total vehicles, (B) trucks.
3.2 Determination of typical vehicles
The preliminary statistical data of the ADTV, wheelbase and vehicle weight corresponding to 16 vehicle types are obtained by WIM system, as shown in Table 1. Li is the mean value of the i-th wheelbase and si is the standard deviation of the i-th wheelbase; W and w are the mean and standard deviation of vehicle weight, respectively.
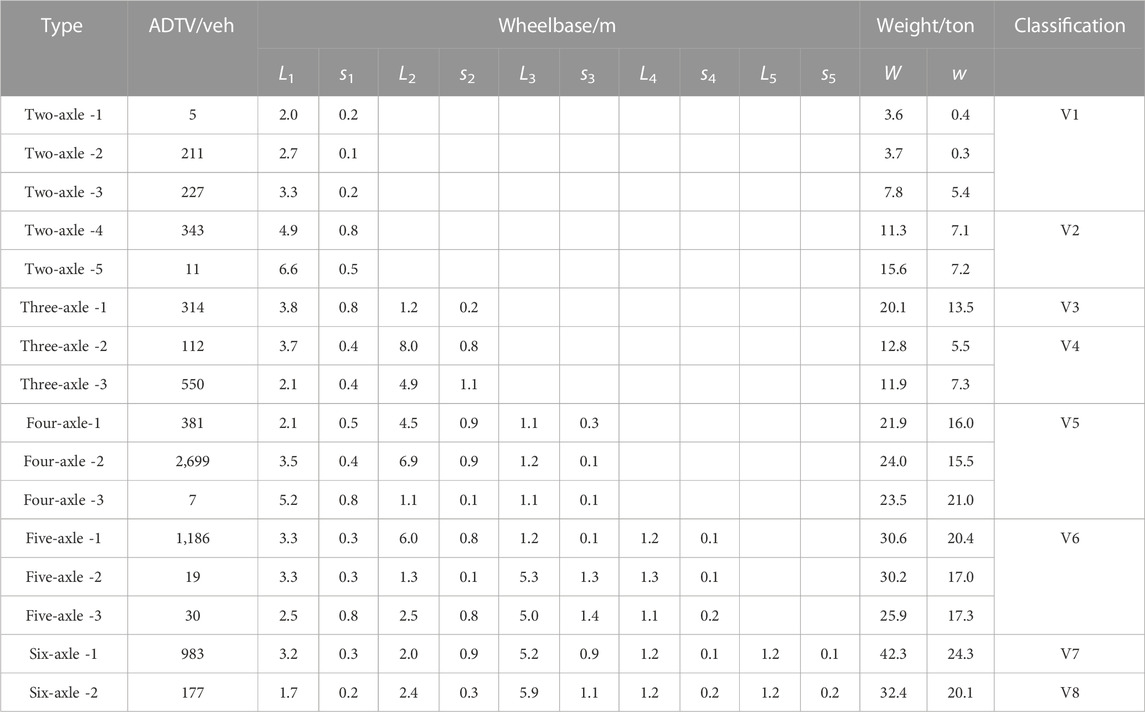
TABLE 1. Preliminary statistics of vehicles.
In Table 1, it can be seen that the dispersion of wheelbase is very small, especially for the intermediate axle (double axle) and rear axle (three axle) of truck, and the standard deviation of wheelbase is within 0.3 m. Because the vehicles are in different load states, the vehicle weight is obviously dispersed. For the convenience of analysis, it is necessary to combine the same or similar vehicle types into a standard vehicle type, and transform the original load spectrum into the standard vehicle fatigue load spectrum. According to the number of axles, the weight, the relative size of wheelbase. All vehicles are simplified as typical vehicles V1 ∼ V8, which are the basic models used to analyze fatigue load characteristic and derive fatigue load spectrum.
3.3 Statistical analysis of the wheelbases
The wheelbase and the axle group of vehicles are the important basis for the classification of typical vehicles and the derivation of fatigue load spectrum. Because the wheelbase distribution of the same vehicle type has strong regularity, the weighted average value is used to determine the wheelbase of typical vehicles. The wheelbase is expressed as
Where Lqi,k is the i-th equivalent wheelbase of the k-th typical vehicle, Lij,k is the i-th wheelbase of the j-th vehicle in the k-th typical vehicle, and nk is the total number of the k-th typical vehicle.
Table 2 shows the calculated wheelbases of typical vehicles. It can be seen that the wheelbase of each typical vehicle type is consistent with the provisions of the relevant national standards for manufactured vehicles. In some vehicle models, the distance between two or three adjacent axles is small (1.2 m or 2.0 m), which is defined as an axle group. The two adjacent axles are called tandem axles, such as the rear axles of V3 and V5, the middle axle and rear axle of V7. The three adjacent axles are called triple axles, such as the rear axles of V6, V7 and V8.
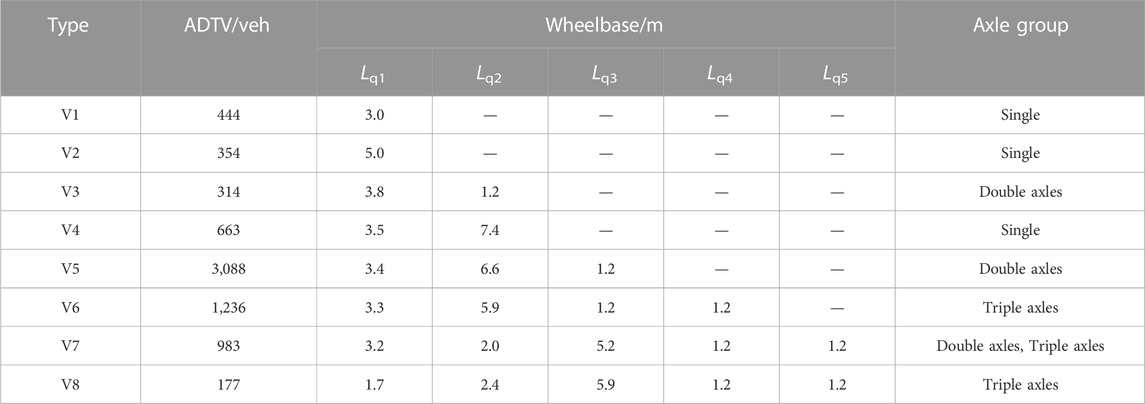
TABLE 2. Wheelbase parameters of typical vehicles.
3.4 Statistical analysis of vehicles in lanes
The distribution proportion of different vehicle types in each lanes can reflect the lateral distribution characteristics of vehicles. The highway lanes are usually divided into heavy lanes and fast lanes in China. Trucks are recommended to drive in heavy lanes and are not allowed to occupy fast lanes for long periods. So the occupancy of different vehicles in each lanes is unbalanced. The port highway bridge is arranged as two-way four lanes, and the ADTV by lane is shown in Figure 7.
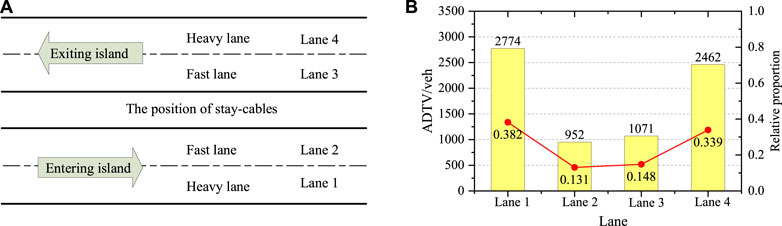
FIGURE 7. The ADTV and relative proportion by lane: (A) lane position, (B) ADTV and relative proportion.
The number of vehicles in the entering and exiting island directions of the port is similar, with only 1.3% difference. In both directions, the traffic flow of the outer lane is the majority, while the traffic flow of the middle lane is obviously less. The traffic flow of the heavy lane in the entering and exiting direction is 2.9 times and 2.3 times that of the fast lane, respectively. In the fatigue evaluation of the orthotropic steel deck, the occupancy of one-way heavy lane and fast lane vehicles in the total trucks can be taken as 35%, and 15%, respectively.
The ADTV of typical vehicles by lane is shown in Figure 8. It can be seen that the distribution pattern of typical vehicles in the entering and exiting directions of the port is basically the same in the corresponding lanes. The main vehicle types in the heavy lane are V5, V6 and V7, and the proportion of the three types in lane 1 and lane 4 is 75.8%, and 83.8%, respectively. The number of V5 was the largest, with 45.3% and 44.9% in lane 1, and lane 4, respectively. The main vehicle types in the fast lane are V4 and V5, and the proportion of the two types in lane 2 and lane 3 is 56.8%, and 59.0%, respectively. The number of V5 was also the largest, with 33.6% and 37.8% in lane 2, and lane 3, respectively. Through the analysis of vehicle types in each lane, it is shown that the heavy lane differs greatly from the fast lane not only in the total traffic volume of trucks, but also in the proportion of various vehicle types.
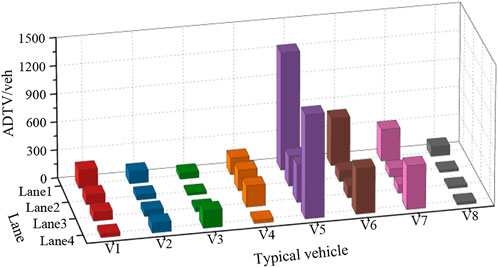
FIGURE 8. The ADTV of typical vehicles by lane.
3.5 Statistical analysis of GVW
The GVW directly acting on the bridge deck plays an important role in structural fatigue assessment. The GVW of all trucks is shown in Figure 9A. The trucks weighing more than 10 tons is about 82.1%. The number of vehicle weight in the range of 10–20 tons is the largest, accounting for 35.8%. The GVW of trucks by lane is shown in Figure 9B. Heavy trucks are concentrated on the two outer lanes. With the increase of the weight, the probability of the vehicle driving in the heavy lane is higher. The GVW in lane 4 is the largest, which is in the exiting direction of the port.
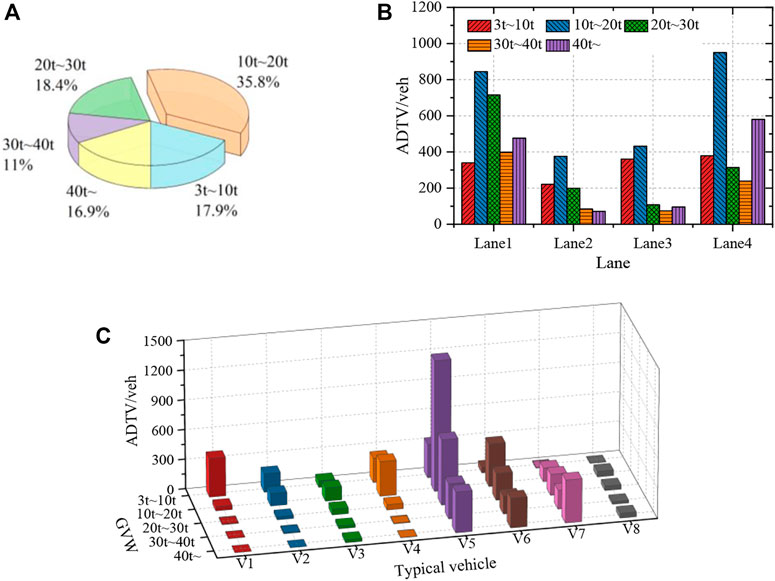
FIGURE 9. The GVW and ADTV of typical vehicles: (A) all trucks, (B) by lane, (C) by typical vehicle.
The relative proportion of the typical vehicles in different weight ranges, are shown in Figure 9C. With the increase of the axle number, the GVW usually shows an increasing trend. V1, V2 are mainly distributed in the 3–10 tons, and V3, V4 are mainly distributed in the 10–20 tons. The proportion of V5, V6 and V8 in the 20–30 tons and V7 in the 30–40 tons increases significantly. In addition, there are more V7 in the range above 40 tons, accounting for as high as 44.1%. Extra heavy vehicles have a great influence on the fatigue damage of orthotropic steel deck.
According to Miner’s linear damage accumulation theory and equivalent fatigue damage principle, the Wj of n vehicles of different GVW is equivalent to a vehicle of Wq for n times, so that the fatigue damage accumulation of the two vehicles is equal. According to the equivalent fatigue damage principle, the equivalent GVW of each typical vehicle is calculated.
Where Wqk is the equivalent GVW of a typical vehicle on lane k. fj,k is the relative frequency of the j vehicle in the vehicle classification on lane k. Wj,k is the GVW of the j vehicle in lane k. m is the negative reciprocal of the slope of S-N curve, and 3.0 is usually used for orthotropic steel deck welded structures.
Considering that the fatigue problem of orthotropic steel deck mainly occurs in the heavy lane, so it mainly takes the heavy lane as the research object for analysis. The GVW distribution of V1∼V8 in the heavy lanes is shown in Figure 10 nk is the ADTV of typical vehicles in lane k.
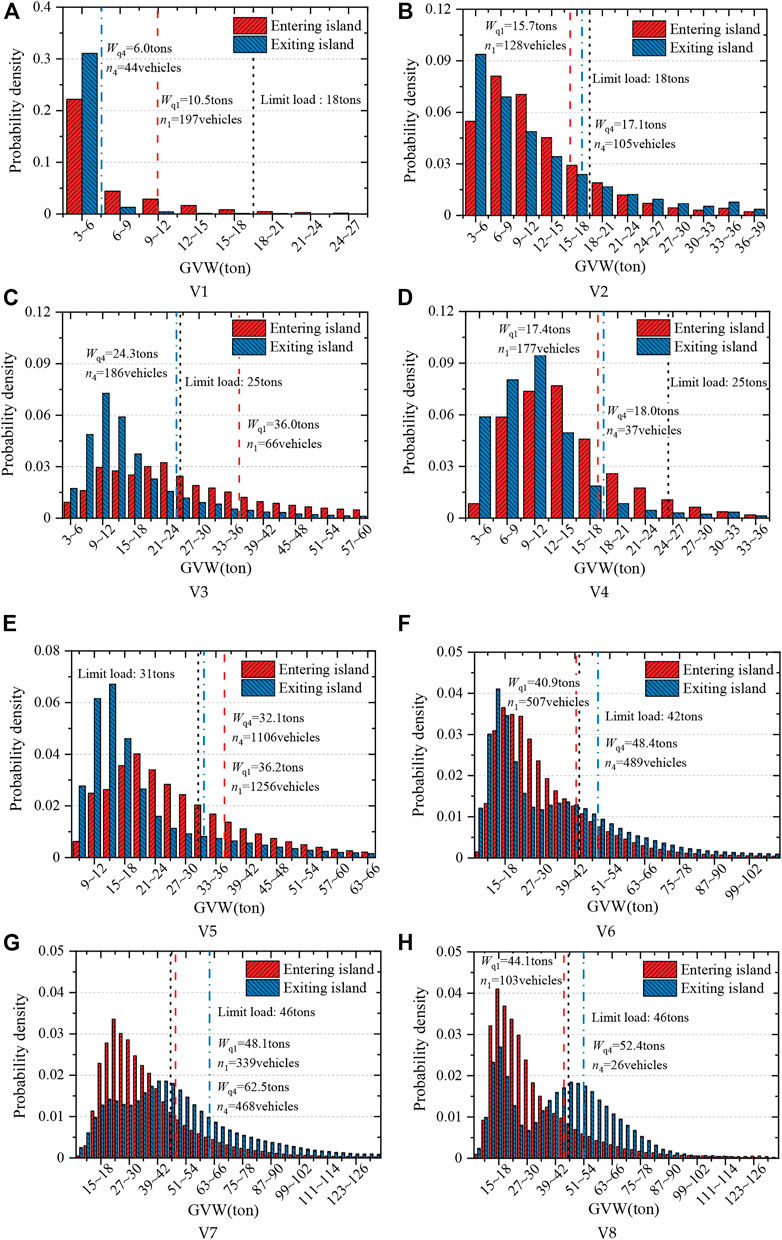
FIGURE 10. The GVW distribution of typical vehicles in the heavy lanes: (A) V1, (B) V2, (C) V3, (D) V4, (E) V5, (F) V6, (G) V7, (H) V8.
Due to the removal of GVW of less than 3 tons, the GVW distribution of V1 is unimodal and skewed. The GVW distribution of V2∼V8 show the multi peak, because of the complex loading states, with none-loading, half-loading or full-loading. By analyzing the equivalent GVW of the typical vehicles in the heavy lanes, the results show that the equivalent GVW of V6 and V7 is relatively high, and the equivalent GVW of V7 in the exiting island direction is up to 62.5 tons, which may be due to the port mainly imports. In addition, there are only 26 vehicles of V8 in the exiting island direction, of which the equivalent GVW reaches 52.4 tons. So its influence on the fatigue loading of orthotropic steel deck cannot be ignored.
3.6 Statistical analysis of the axle weights
The stress influence line of the structural details of the orthotropic steel deck is relatively short, so the vehicle passing on the bridge at one time may produce multiple stress amplitudes that cause fatigue damage. The number of stress cycles is related to the arrangement of the axle. According to the equivalent principle of fatigue damage, the equivalent axle weights Aqk of each lane are calculated.
Where Aqk is the equivalent axle weights in lane k. fj,k are the relative frequency of the j-th vehicle in lane k. Wij,k is the weights of the i-th axle of the j-th typical vehicle in lane k.
As can be seen from Figure 11, the equivalent axle weights of heavy lanes are all above 8 tons. The equivalent axle weights in the exiting island direction is 9.0 tons, which is 11.1% higher than that in the entering island direction. The number of average daily axle weights was up to 16,644 veh, which occurred in the entering island direction, which was about 12.7% higher than that in the exiting island direction. Considering the field inspection results that the fatigue damage of the deck in the exiting island direction is more serious, the vehicle data in lane 4 is selected as the typical sample to analyze the characteristic of the axle weights, which is in the heavy lane in the exiting island direction.
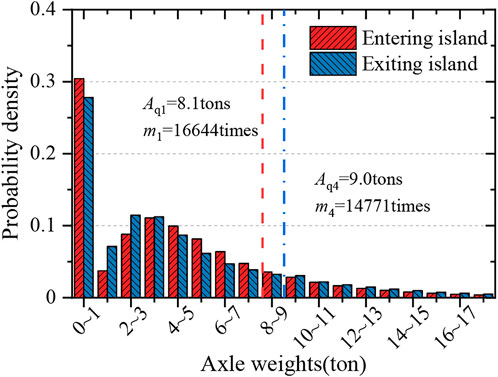
FIGURE 11. The axle weights distribution and equivalent axle weights in the heavy lanes.
The equivalent axle weights of each typical vehicle are defined as
Where WAi is the equivalent axle weights of the i-th axle of a typical vehicle in a lane. fj,k is the relative frequency of the j-th vehicle in the classification of the vehicle in a certain lane. Wij is the i-th axle weights of the j-th vehicle in a lane.
The axle weight distributions of typical vehicles in lane 4 are shown in Figure 12. It can be seen that the axle weights of the V1 show the single-peak distribution. The front axle weights of V2∼V8 show the single-peak distribution, while the middle and rear axle weights show the multi-peak distribution. The distributions of the double and triple axle weights are similar.
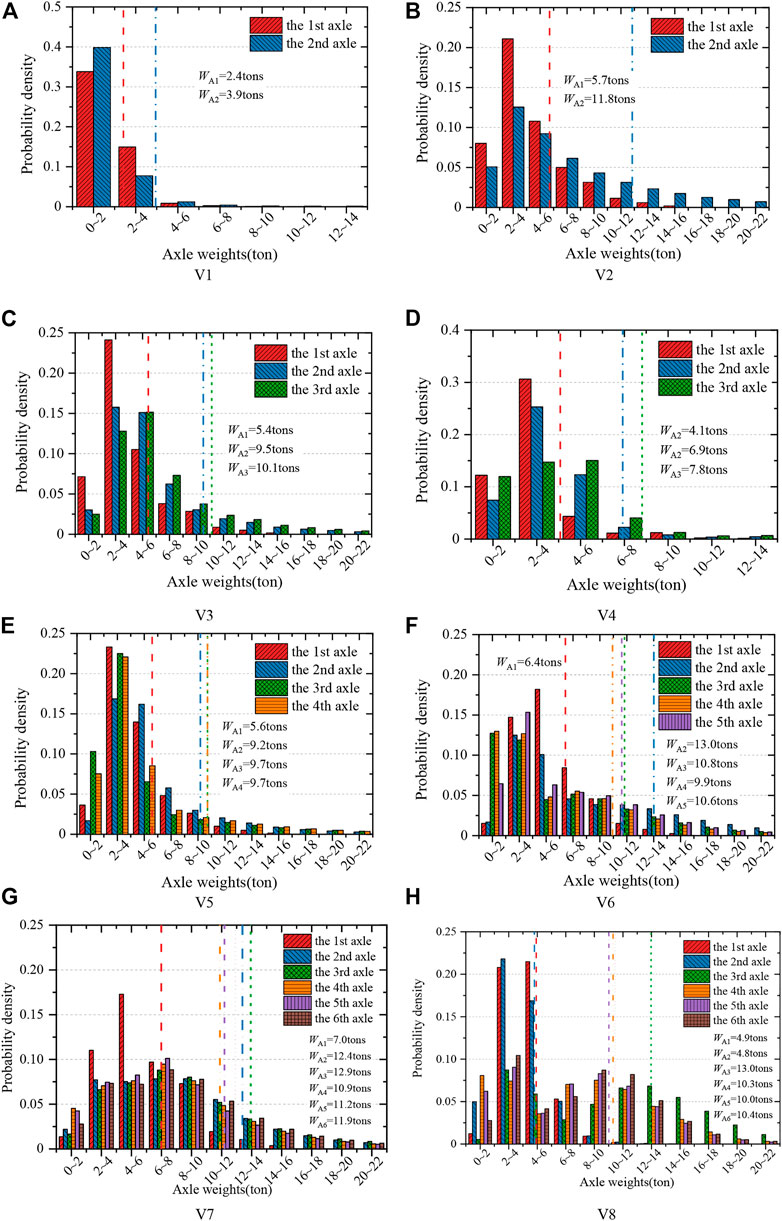
FIGURE 12. The axle weight distribution of typical vehicles in lane 4: (A) V1, (B) V2, (C) V3, (D) V4, (E) V5, (F) V6, (G) V7, (H) V8.
The equivalent axle weights of V1∼V8 in lane 4 are shown in Table 3. ∑WAi is the sum of equivalent axle weights of each typical vehicle. ΔW is the difference between ∑WAi and the equivalent GVW Wq4. The axle weights of V1 and V4 are relatively light. The maximum equivalent axle weight of V2 is 11.8 tons in lane 4, which is the two-axle vehicle. The average axle weight of the other typical vehicles with double axles or triple axles is about 10 tons, among which the maximum value appears in the middle axles of V6 and V8, and is 13 tons.

TABLE 3. The equivalent axle weights of typical vehicles in lane 4.
For the standard fatigue vehicles in the American code (AASHTO, 2017), the front axle weight is 3.6 tons, and the single axle weights of the middle or rear axles is 7.2 tons. Compared with the American code, the axle weights of most typical vehicles on Chinese port highway bridges are significantly heavier, accounting for 87.1%. This indicates that the axle weights of the vehicle are greatly affected by the regional environment, and the standard fatigue vehicle defined in the American code is not suitable for the Chinese port area. The sum of all the equivalent axle weights of each typical vehicles is close to the equivalent GVW of the corresponding typical vehicles, and the difference between them is not more than 10%. Therefore, the equivalent GVW can be allocated to each axle in proportion when simplifying the analysis.
4 Fatigue load model
4.1 Vehicle fatigue load spectrum
Based on the 34-months vehicle data of the port highway bridge (excluding the vehicles with GVW less than 3 tons), the vehicle data are classified according to typical vehicles in the heavy lane, which with prominent fatigue problem of the orthotropic steel decks. The wheelbases of typical vehicles are calculated by using the method of weighted mean, and then the axle weights of typical vehicles are calculated according to the equivalent fatigue damage principle. Combined with the relative proportion of typical vehicles, the fatigue load spectrum of port highway bridges is derived, as shown in Table 4. The axle weights underlined in the table represent the single wheel, and the others represent the double wheel.
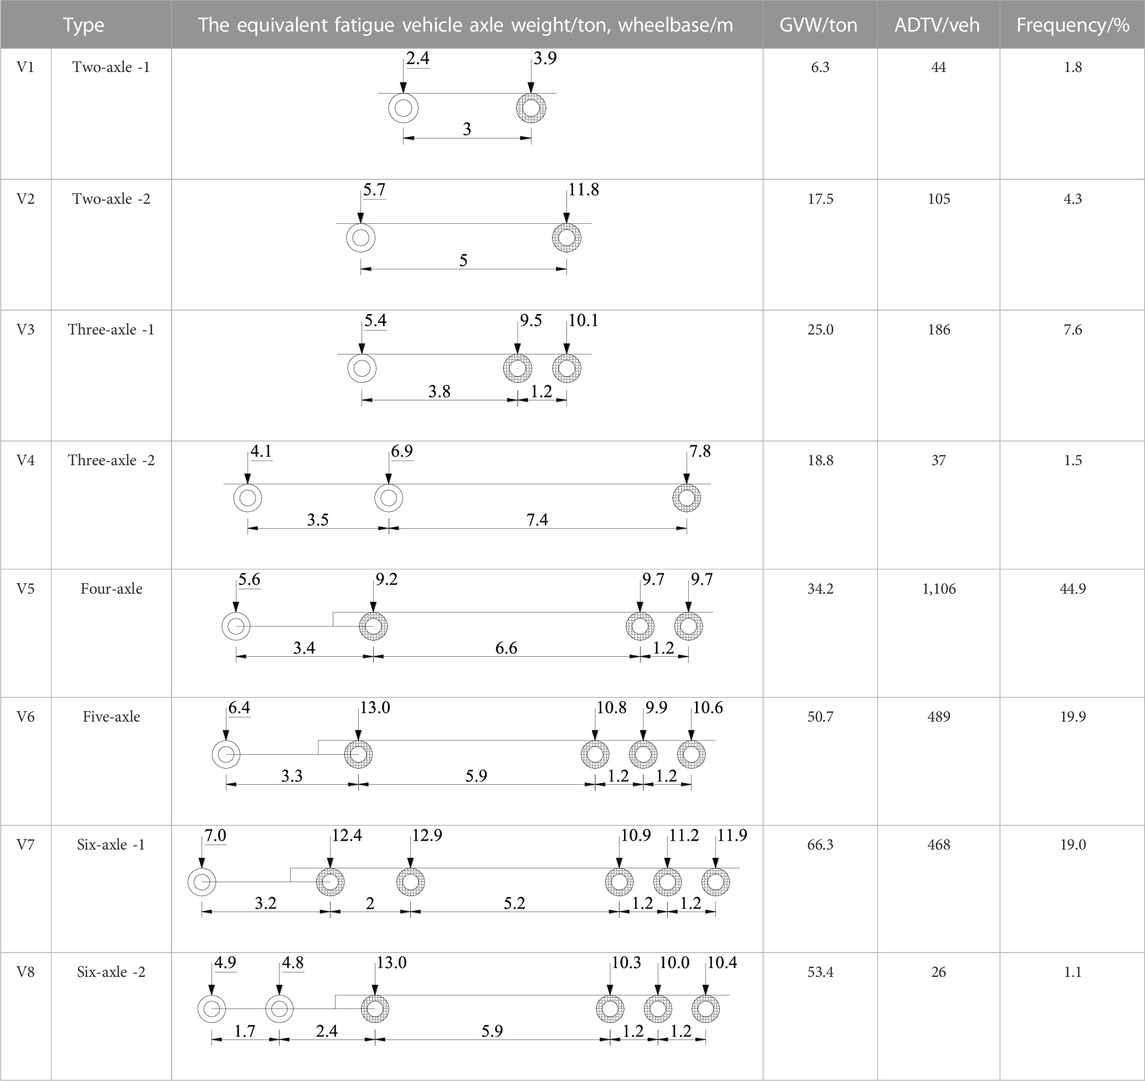
TABLE 4. Vehicle fatigue load spectrum in the heavy lane for port highway in China.
In this vehicle fatigue load spectrum, only the GVW of V1 is less than 10 tons, and V2∼V8 is more than 15 tons. Among all the models, the GVW of V7 is the largest, with 66.3 tons. V5 is the highest frequency of occurrence with 44.9%.
4.2 Standard fatigue vehicle model
Based on the statistical vehicle fatigue load spectrum and the fatigue damage equivalent principle, the contribution degree of typical vehicles to structural fatigue damage can be obtained.
Where Dk is the fatigue damage contribution degree of k-th typical vehicle. fk is the frequency of k-th typical vehicle in traffic flow. Wk is the equivalent GVW of k-th typical vehicle. N is the number of the typical vehicles.
The fatigue damage contribution of typical vehicles in the heavy lane is shown in Table 5. The vehicles with four or more axles (V5∼V8) are the major contributors to fatigue damage of the bridge, with a proportion of 98.5%. The proportion of V7 to bridge fatigue damage is up to 54.0%. The fatigue damage is determined by both GVW and frequency. The number of V5 is the largest, but the equivalent GVW is relatively light. Its fatigue loading contribution is 15.5%, ranking only third.

TABLE 5. Fatigue damage contribution of typical vehicles in the heavy lane.
The local effects of structural details such as roof-to-rib joints, rib-to-diaphragm joints in the orthotropic steel deck are significant under vehicle load. Each axle of vehicles may produce a stress amplitude, so the standard fatigue vehicle model should be used for anti-fatigue design. Based on the analysis of the vehicle fatigue load spectrum and the fatigue damage contribution, V7 is selected as the prototype of the standard fatigue vehicle, to derive the fatigue vehicle model suitable for the port highway bridge. According to the vehicle fatigue load spectrum, the equivalent GVW is obtained by Formula (3), and it is distributed to each axle according to the axle-weight ratio of the prototype, as shown in Figure 13A. In order to facilitate the application, the each weight of the tandem axles is averaged, and the simplified standard fatigue vehicle model is obtained, as shown in Figure 13B. The front axle is the single wheel, and the other axles are the double wheels. The loading length and width of the single wheel and the double wheel are 0.3 m × 0.2 m and 0.6 m × 0.2 m, respectively, referring by Chinese code (JTG D64, 2015).
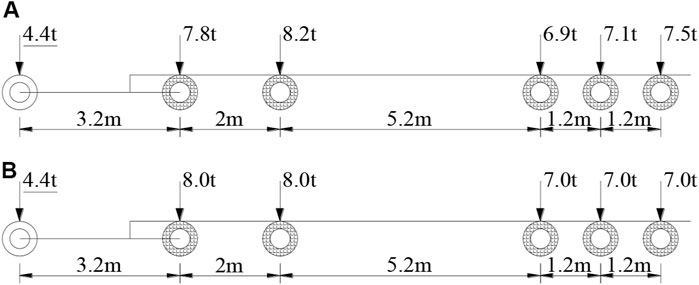
FIGURE 13. Standard fatigue vehicle model in the heavy lane: (A) derived fatigue vehicle model, (B) simplified fatigue vehicle model.
The comparison of standard fatigue vehicle models in various codes is shown in Table 6. The axle weights underlined in the table represent the single wheel, and the others represent the double wheel. It can be seen that the Chinese code (JTG D64, 2015) and the European code (European Committee for Standardization, 2006) are a four-axle vehicle. Only the wheel loading area is different, and the other axle weights and wheelbases are the same. The American code is a five-axle vehicle, and its GVW is smaller than that of European and Chinese codes. The Japanese code (Japan Road Association, 2002) is different from other codes, the uniaxial load of 200 kN is given. Its equivalent axle weights can be calculated according to the linear cumulative damage criterion, which is relatively heavier considering the superposition effect of the front and rear axles.
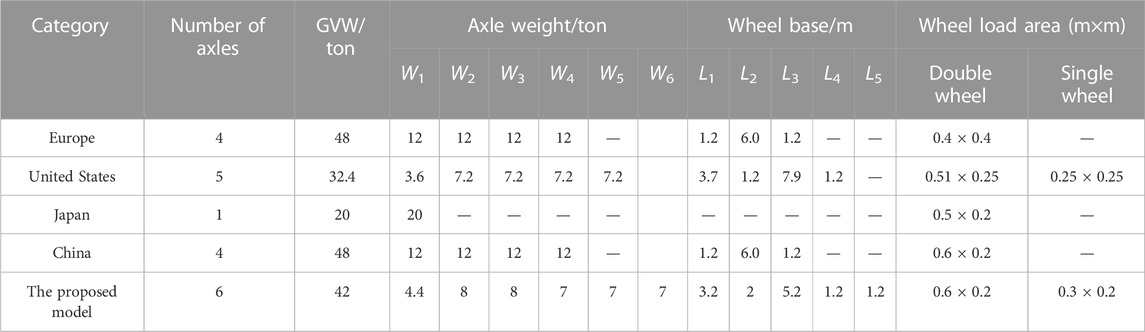
TABLE 6. Standard fatigue vehicle models in different countries.
Comparing the proposed model in this paper which is suitable for Chinese port highway bridges, its GVW is close to that of Chinese code and European code, and its axle weights are close to that of American code. The rear tandem axle of the proposed model is three axles, and its total weight is obviously larger than that of American code. In addition, the proposed model is the six-axle vehicle, and the number of axles is the largest compared with other fatigue vehicles. For some details of orthotropic steel deck, the number of stress cycles may also increase under the proposed model, and the fatigue damage will be more serious.
5 Conclusion
In this paper, based on the traffic flow data obtained by WIM system, the traffic load characteristics of the port highway bridge in the coastal area of China are analyzed by mathematical statistics, and the fatigue vehicle load spectrum and fatigue vehicle model are studied. The conclusions can be summed up as follows.
(1) The ADTV of all vehicles and trucks are 9,922, and 7,259 vehicles respectively, and they both show a fluctuating upward trend monthly. The total traffic flow is dominated by two-axle and four-axle vehicles which account for about 66.0%. The proportion of trucks in the total vehicles is basically stable, of which the average value is 73.2% in each month.
(2) Based on multi-period traffic flow data and wheelbase characteristics, eight typical vehicles of fatigue load spectrum are classified. The trucks with more than four axles account for 89.0% of the total trucks, of which V5 accounts for the most, as high as 42.5%. The share of vehicles in a heavy lane of the total trucks is about 35%, and the distribution of vehicles in both entering and exiting directions is basically approximate.
(3) The statistical analysis of GVW shows that the heavy vehicles are mainly concentrated on the outer lane. With the increase of GVW, the probability of the vehicle driving in the heavy lane is higher, and the GVW in the exiting direction is relatively heavier. The equivalent GVW of V7 in the exiting island direction is up to 62.5 tons. The axle weights of V1 show the single-peak distribution. The front axle weights of V2∼V8 show the single-peak distribution, while the middle and rear axle weights show the multi-peak distribution.
(4) Considering the high probability of fatigue damage in heavy lanes, the six-axle vehicle (V7) with the greatest fatigue damage contribution is selected as the prototype of the standard fatigue vehicle, the simplified fatigue vehicle model in the heavy lane for Chinese port highway bridges is proposed, of which the GVW is 42 tons, the middle axle is double axles and the rear axle is triple axles.
Data availability statement
The raw data supporting the conclusion of this article will be made available by the authors, without undue reservation.
Author contributions
XP, analysis of data and writing of the manuscript; KW, software; QY, revision of the manuscript; BX, funding; JD, concept and methods.
Funding
This work is supported by National Natural Science Foundation of China (52008215), the Science and Technology Project of China Communications Construction Co., Ltd. (YSZX-01-2020-01-B), the Major Special Science and Technology Project (2019B10076) of “Ningbo Science and Technology Innovation 2025,” Natural Science Foundation of Zhejiang Province, China (LQ20E080013). The authors declare that this study received funding from China Communications Construction Co., Ltd. The funder was not involved in the study design, collection, analysis, interpretation of data, the writing of this article, or the decision to submit it for publication.
Conflict of interest
KW is employed by CCCC Highway Bridge National Engineering Research Center Co., Ltd., China, and BX is employed by Ningbo Roaby Technology Industrial Group Co., Ltd., China.
The remaining authors declare that the research was conducted in the absence of any commercial or financial relationships that could be construed as a potential conflict of interest.
Publisher’s note
All claims expressed in this article are solely those of the authors and do not necessarily represent those of their affiliated organizations, or those of the publisher, the editors and the reviewers. Any product that may be evaluated in this article, or claim that may be made by its manufacturer, is not guaranteed or endorsed by the publisher.
References
AASHTO (2017). LRFD bridge design specifications[S]. Seventh Edition. Washington DC: American Association of State Highway and Transportationof Officials.
British Standards Institution (2000). BS5400. Part 3: Code of practice for design of steel bridges[S]. London: British Standards Institution.
Chen, D. Z., and Shi, X. F. (2021). Research on vehicle load characteristics and multi-lane load model of extended bridge[J]. Highway 66 (6), 176–183.
Chotickai, P., and Bowman, M. D. (2006). Truck models for improved fatigue life predictions of steel bridges. J. Bridge Eng. 11 (1), 71–80. doi:10.1061/(asce)1084-0702(2006)11:1(71)
Deng, L., Nie, L., and Zhong, W. J. (2021). Developing fatigue vehicle models for bridge fatigue assessment under different traffic conditions[J]. J. Bridge Eng. 26 (2), 04020122.
European Committee for Standardization (2006). Eurocode 1: Actions on structures--Part 2: Traffic loads on bridges[S]. Brussels: European Committee for Standardization.
Fu, H., Zhou, X., Zhou, Q., Xiang, P., Zhou, Z., and Fu, Q. (2022). An improved model for design fatigue load of highway bridges considering damage equivalence. J. Build. 12 (2), 217. doi:10.3390/buildings12020217
He, W. C., and Wang, C. (2022). Research on fatigue load spectrum of long span steel box girder suspension bridge based on WIM[J]. J. Hubei Univ. Technol. 37 (4), 86–91.
Japan Road Association (2002). Guide for fatigue design of steel highway bridges[S]. Tokyo: Japan Road Association.
JTG D64 (2015). Specifications for design of highway steel bridge[S]. Beijing: China Communications Press.
Lai, Y., Dai, L., and Zhu, Z. W. (2020). The study on fatigue load spectrum analysis and service life prediction of steel box girder cable-stayed bridges based on WIM data[J]. J. Jiangxi Normal Univ. Sci. Ed. 44 (6), 654–660.
Laman, J. A., and Nowak, A. S. (1996). Fatigue-load models for girder bridges. J. Struct. Eng. 122 (7), 726–733. doi:10.1061/(asce)0733-9445(1996)122:7(726)
Lao, J. R., Tan, H., and Lu, N. W. (2020). Study on extreme load effects on large bridges based on vehicle WIM monitoring data[J]. J. China Foreign Highw. 40 (3), 114–118.
Li, M., Huang, T. L., and Liao, J. J. (2020). WIM-based vehicle load models for urban highway bridge[J]. Lat. Am. J. Solids Struct. 17 (5), e290.
Liu, D., Deng, Z. H., Wang, Y. H., and Kaisar, E. I. (2020). Method for identifying truck traffic site clustering using weigh-in-motion (WIM) data. IEEE ACCESS 8 (8), 136750–136759. doi:10.1109/access.2020.3011433
Maljaars, J. (2020). Evaluation of traffic load models for fatigue verification of European road bridges. Eng. Struct. 225, 111326. doi:10.1016/j.engstruct.2020.111326
Miao, T. J., and Chan, T. (2002). Bridge live load models from WIM data. Eng. Struct. 24 (8), 1071–1084. doi:10.1016/s0141-0296(02)00034-2
Miao, T. J. (2001). Bridge live load models with special reference to Hong Kong[J]. Diss. Abstr. Int. 62 (10), 4668.
Peng, X., and Yang, Q. W. (2023). Damage detection in beam-like structures using static shear energy redistribution[J]. Front. Struct. Civ. Eng. 1, 1–13.
Peng, X., and Yang, Q. W. (2021). Sensor placement and structural damage evaluation by improved generalized flexibility. IEEE Sensors J. 21 (10), 11654–11664. doi:10.1109/jsen.2021.3066989
Qu, H., Niu, Z. H., and Huang, P. M. (2020). Research on random fatigue load model of highway bridge by vehicle traffic based on GMM[J]. Teh. Vjesn. 27 (3), 961–969.
Raju, S. K., Moses, F., and Schilling, C. G. (1990). Reliability calibration of fatigue evaluation and design procedures. J. Struct. Eng. 116 (5), 1356–1369. doi:10.1061/(asce)0733-9445(1990)116:5(1356)
Schilling, C. G., and Klippstein, K. H. (1978). New method for fatigue design of bridges. J. Struct. Div. 104 (11), 425–438. doi:10.1061/jsdeag.0004877
Su, W. Q., Li, R., and Liu, H. Z. (2020). Fatigue load spectrum of bridge of mountain low-grade highway[J]. J. Transp. Sci. Eng. 36 (2), 79–84+21.
Tong, L. W., Shen, Z. Y., and Chen, Z. Y. (1997). Fatigue load spectrum for urban road birdges[J]. China Civ. Eng. J. 5, 20–27.
Wang, C., Zhou, Z. S., and He, W. C. (2022). Vehicle load identification based on stress monitoring data of orthotropic bridge deck[J]. Sci. Technol. Eng. 22 (16), 6695–6701.
Wang, H. Q., and Nagayama, T. (2022). Response spectrum model of vehicle dynamic load for the prediction of bridge vibration level due to single vehicle-passage. Eng. Struct. 260, 114180. doi:10.1016/j.engstruct.2022.114180
Yan, Q. Z., Zhuo, W. D., and Wang, Z. J. (2021). Vehicle load model for heavy load and heavy traffic highway in Fujian Province based on weigh-in-motion data[J]. J. Fuzhou Univ. Sci. Ed. 49 (3), 421–427.
Yang, Q. W., and Peng, X. (2021). Sensitivity Analysis using a reduced finite element model for structural damage identification. Materials 14 (19), 5514. doi:10.3390/ma14195514
Yu, Y., Kurian, B., Zhang, W., Cai, C., and Liu, Y. (2021). Fatigue damage prognosis of steel bridges under traffic loading using a time-based crack growth method. Eng. Struct. 237, 112162. doi:10.1016/j.engstruct.2021.112162
Zhao, K. L., Zong, H., and Zhu, Q. (2021). Analysis on vehicle loads on Nanjing Qixiashan Yangtze river bridge based on long-term field measurement[J]. J. Southeast Univ. Sci. Ed. 51 (6), 979–985.
Zhou, J. Y., Hu, C., Chen, Z., Wang, X., and Wang, T. (2021). Extreme value modeling of coincident lane load effects for multi-lane factors of bridges using peaks-over-threshold method. Adv. Struct. Eng. 24 (3), 539–555. doi:10.1177/1369433220960275
Keywords: bridge engineering, port highway, orthotropic steel deck, vehicle load, fatigue load model
Citation: Peng X, Wang K, Yang Q, Xu B and Di J (2023) Fatigue load model of orthotropic steel deck for port highway in China. Front. Mater. 10:1115632. doi: 10.3389/fmats.2023.1115632
Received: 04 December 2022; Accepted: 31 January 2023;
Published: 13 February 2023.
Edited by:
Zhigang Zhang, Chongqing University, ChinaCopyright © 2023 Peng, Wang, Yang, Xu and Di. This is an open-access article distributed under the terms of the Creative Commons Attribution License (CC BY). The use, distribution or reproduction in other forums is permitted, provided the original author(s) and the copyright owner(s) are credited and that the original publication in this journal is cited, in accordance with accepted academic practice. No use, distribution or reproduction is permitted which does not comply with these terms.
*Correspondence: Jin Di, dijin@cqu.edu.cn