 Shatrudhan Pandey
 Karan Kumar Mishra2
- 1Department of Production and Industrial Engineering, Birla Institute of Technology, Mesra, Ranchi, India
- 2Department of Metallurgical Engineering, National Institute of Technology, Jamshedpur, India
- 3Research & Development, Tata Steel Limited, Jamshedpur, India
Tinplating on steel is a useful industrial process extensively used for food packaging. Cold-rolled annealed steel coated with tin gives the steel corrosion resistance property and a beautiful luster. Tinplating on steel is a complex process where rolled and annealed steel sheets are cleaned with acid to remove rust, grease, or oil from the surface. Pure tin is electrodeposited on this freshly prepared surface after the electrodeposition of tin on the steel strip; the surface becomes lustrous, the color of pure tin appears, and the finish is called matte. Very often, the flowing heat treatment is just about the tin melting point of 232°C–265°C. After electrodeposition, pure tin deposits on the steel surface; however, a chemical reaction between tin and iron occurs during the brightening treatment. This process results in iron–tin intermetallic formation; their orientation grain structure and orientation of substrate steel all have a synergistic effect on the final properties of tin-coated steel. In the present study, an attempt has been made to study this parameter in detail. A total of five commercially produced tin-plated steel have been selected for the present purpose, and both tin coating and substrate steel have been thoroughly characterized by optical microscopy, scanning electron microscopy, X-ray diffraction (XRD), and the crystallographic texture point of view; however, the best result has been discussed in this paper. The different phases of tin and the iron–tin compound have been identified using XRD, X-ray, and a texture goniometer that are used to find out the crystallographic texture observed in the presence of FeSn2, FeSn, and Sn in tin coating; the volume fraction of these phases is observed to vary from one sample to another. This variation may affect tinplating steel’s final property, which can be studied in the future work.
1 Introduction
1.1 Brief history of tinplate
Tinplate is one of the oldest packaging materials which was first used in the 1800s for round, square, and rectangular boxes and canisters during the time of Napoleon Bonaparte for preserving foods. The first heat-processed tinplate was developed, filled, processed, and sold to the public in Bermondsey, East London. The technique quickly moved to the United States, where it evolved into a continuous manufacturing process. This had a significant influence on society. When a technique for mechanically fastening the ends to the food can replace the ineffective soldering mechanism in the early 1900s, it represented a significant advancement. This increased both the process’s efficiency and the product’s safety. Erik Rotheim (Norway) received the first patent for an aerosol can in 1929. Following this, the abolition of the prohibition laws and the development of appropriate interior coating materials led to the introduction of three-piece soldered side seam beer cans in the United States in 1933–1936. During the Second World War, in Switzerland, the lack of tinplate prompted the invention of seamless can forms made of aluminum. As a result of this effort, the first thin-wall draws and wall-ironed aluminum beer cans were marketed in the United States approximately 20 years later, in 1963. Over the next 15 years, comparable thin-wall tinplate cans for food and beverages were made. The initial easy-open can end was created in 1962 by Ernie Fraze and ALCOA. In order to create the three-piece food and beverage cans quickly, the welded wire mesh side seam technique was developed in 1975. Drinking can designs with embossing and shaping debuted in 1997. The first bottle-shaped thin-wall can with a metal reclosable screw cap was commercialized in Japan in 2000, shortly following this. There are just over 400 billion metal containers sold globally. This includes containers for food, beverages, aerosols, dry goods, and technical items. For beer and soft drinks, Japan created the first thin-walled metal bottles with retractable screw closures in 2000. Less-expensive variants in Europe and the United States are now being created and marketed (Page, 2012). Tinplate is a light-gauge, cold-reduced, low-carbon steel sheet, or strip, coated on both sides with commercially pure tin. It has a gorgeous metallic luster and excellent properties of corrosion resistance, solderability, and weldability (Blunden and Wallace, 2003). The worldwide packaging demand is expected to reach United States $ 974 billion by 2018, with Asia, North America, and Western Europe accounting for slightly more than 40%, 21%, and 19%, respectively (Essuman, 2018). North America and Asia-Pacific are expected to have the most influence on the metal can market due to the increased demand for healthy beverages, carbonated soft drinks, and fruit and vegetable juices (Deshwal and Panjagari, 2020). Food packaging, as a major component of the food business, is directly linked to food hygiene and significantly influences food quality. People’s health is severely harmed by poor food packaging quality (Wan et al., 2021). Metal packaging materials account for 15% of the total packaging materials used globally (FICCI, 2016) (Kremser et al., 2021). Over the next five years, the metal can market is predicted to grow at a 4.9% CAGR. The product is gaining popularity due to its distinguishing qualities, such as transportation resistance, hermetically sealed cover, hard handling, and simple recyclability (Mordor Intelligence, 2022). The disadvantages of existing materials and the growing customer demand for higher quality and safer products have prompted the packaging industry to create alternative packaging solutions (Garcia-Oliveira et al., 2022). Food packaging has become a significant business area in today’s world of more people and food. Food packaging innovation has substantial problems in prolonging the shelf life of perishable food products and helping to achieve daily nutritional needs, as people increasingly seek meals with added health benefits (Iversen et al., 2022). Tinplate, tin-free steel, stainless steel, and, most often, aluminum are the most common metallic substrates used for packaging. On the other hand, metals can react with food, causing corrosion and the release of toxic substances (Morselli et al., 2021).
Tinplate is used for making all types of containers, such as food cans, beverage cans, 18 L cans, and artistic cans. However, its applications are wider than those of containers; recently, tinplate has been used for making electrical machinery parts and many other products (Tata Tinplate). It has superior protective qualities against gases, water vapor, light, and odors. The delicate process is also cheap to produce in large quantities. Tin-plated products can easily be recycled. Tin reacts with Fe to produce different intermetallic compounds. Figure 1 shows the typical Fe–Sn phase diagram (Hari Kumar et al., 1996). Many intermediate compounds, like FeSn, FeSn2, Fe3Sn2, and Fe3Sn3, can form. Only a little solubility of Sn in Fe can be seen. Tin was melted at 232°C. The results of the Fe–Sn system between 504 K and 880 K were by the phase diagram except for the temperature of 796 K peritectic transformation of FeSn2 and FeSn + L. From the diffusion couple and equilibration of Fe–Sn alloy, we found this temperature to be 504 K. In the diffusion couple of Fe versus saturated solid solution of Fe in Sn annealed between 504 K and 796 K, a thick FeSn2 and an extremely thin FeSn layer were found, as shown in Figure 1 (Lubyová et al., 1977). The present work has been undertaken to study the tin coating of industrially produced tin-plated steel. Also, both coating and substrate steel are characterized. If any, an attempt has been made to correlate tin plating and substrate steel properties.
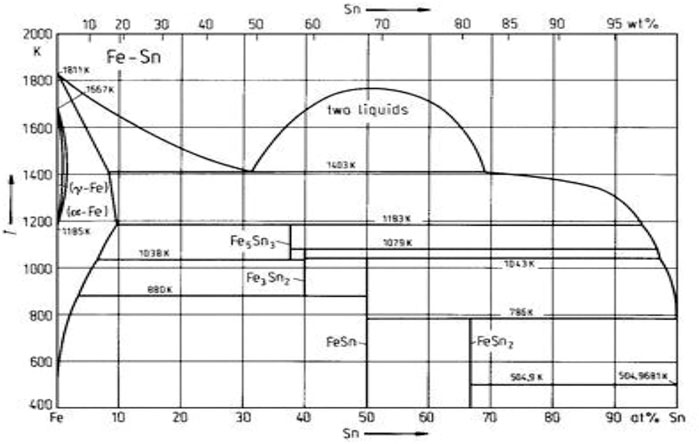
FIGURE 1. Fe–Sn phase diagram.
The structure of this paper is organized as follows: the introduction of tin-plated steel and its manufacturing flow process is discussed in Section 2. Section 3 provides the experimental procedure of tested steel. In Section 4, the results of the experiment are presented. Section 5 provides discussion based on the results. In Section 6, conclusions are drawn. Finally, Section 7 provides the scopes for future work.
2 Tin-plated steel
Tin-plated steel is a low mild-carbon steel with 0.05%–0.025% carbon content by wt. Low carbon makes it malleable and ductile (Tsymbal et al., 1986). Tinplating is carried out by either dipping the steel in molten Sn or electrolytic deposition of Sn; nowadays, only the latter method is used to produce tinplate. The tinplate made by this process is essentially a sandwich in which the central core is strip steel. This core is cleaned in a pickling solution and then fed through tanks containing electrolytes, where tin is deposited on both sides. As the strip passes between high-frequency electric induction coils, it is heated so that the tin coating melts and flows to form a lustrous coat (Kim and Tong, 1997). The product has a tin coating of about 0.00003 inches (0.00076 mm) on each side. Tinplate has the strength and formability of steel combined with tin’s non-corrosive and non-toxic properties; it has the additional property of easy solderability. The detailed properties of tin are shown in Table 1 (Kaye and Laby, 1995; Emsley, 2011; Haynes, 2014; Coursey et al., 2015; Thomas Jefferson National Accelerator Facility - Office of Science Education).
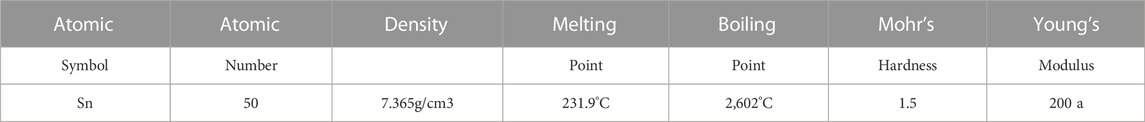
TABLE 1. Properties of tin.
2.1 Tinplating process
The schematic diagram can help to understand the manufacturing flow process of the tinplating process shown in Figure 2.
(a) Hot-rolled coil: In metal working, rolling is a metal forming process in which metal stock is passed through one or more pairs of rolls to reduce the thickness and to make the thickness uniform. Rolling is classified according to the temperature of the metal rolled. If the temperature of the metal is above its recrystallization temperature, then the process is known as hot rolling (Roberts and William, 1983).
(b) Pickling: Pickling is a metal surface treatment used to remove impurities from ferrous metals, copper, precious metals, and aluminum alloys, such as stains, inorganic contaminants, rust, or scale. A solution called pickle liquor, which contains strong acids, removes surface impurities. It is commonly used to descale or clean steel in various steel-making processes (Eagleson, 1994).
(c) Cold-rolling mill: Cold rolling is a process by which the sheet metal or strip stock is introduced between the rollers and then compressed and squeezed. The advantages of cold rolling are good dimensional accuracy and surface finish (Sansome, 1980; Roberts and William, 1978).
(d) Continuous annealing furnace: Continuous annealing is an annealing process that produces strain-free grain, unlike batch (Yoshitani and Hasegawa, 1998).
(e) Electrolytic cleaning line: An Electrolytic cleaning line cleans the strip surface of oil and dirt by chemical action using an alkaline solution. The strip passes between the electrodes, which are immersed in tanks containing the electrolyte. This technique is more effective in cleaning cold-rolled steel than conventional cleaning processes used on high-speed electro-tinning and alkaline-cleaning lines (Chen et al., 1988).
(f) Batch annealing furnace: Cold-rolled strips are annealed by a thin process, and new strain-free grains are produced. The batch-annealing process takes a long time, approximately 20–24 h, and for a cycle to complete annealing, it takes very few minutes but generally operates at a high temperature (Fang and Wu, 2015).
(g) Temper mill: A temper mill is a steel sheet or steel plate processing line composed of a horizontal pass cold-rolling mill stand, entry and exit conveyor tables, and upstream and downstream equipment, depending on the design and nature of the processing system. The primary purpose of a temper mill is to improve the surface finish of steel products.
(h) Coil preparation line: A coil preparation line is a coil handling line that prepares a coiled sheet for further processing. A coil preparation line generally consists of a payoff reel, coil peeler, flattener, and shear. Most processing lines today have a coil preparation section built into them.
(i) Electrolytic tinning lines: These lines are processes of steel strips made from soft, low carbon steel; first, it is cold rolled, then the steel strip is cleaned, annealed, and skin passed to give mechanical properties. To protect the material against corrosion, it is electrolytically tinplated and is known as tinplate.
(j) Tinplate sheet: Tinplate is produced from black-plated steel coated with tin on both sides by electrodeposition. The packaging industry has long used tinplate for cans and closures, deep-drawn oil filter shells, metal hoses, paint trays, etc.
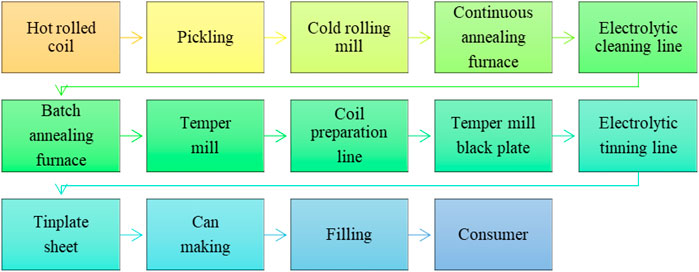
FIGURE 2. Schematic diagram of the manufacturing flow process of tinplating process.
3 Experimental procedure
3.1 Chemical composition of experimental samples
The chemical compositions of these samples were determined by a spectroscopy method in the rapid analysis center of TATA Steel, Jamshedpur. The sample was tested three times, and the averages of the values have been considered for this study. The chemical composition of the tested steel is given in Table 2.

TABLE 2. Chemical composition of tested steel.
3.2 Experimental setup
To characterize the tin-plated steel in detail, several experimental techniques, such as optical microscopy, scanning electron microscopy with energy dispersive spectrum (EDS) analysis, and X-ray diffraction with glancing and crystallographic measurements, were performed. In this section, all these experimental techniques will be discussed briefly.
3.2.1 Optical microscopy
Despite the limitations in resolution, optical microscopy, also referred to as light microscopy, allows a simple, rapid, and relatively accurate assessment of grain size and microstructure, including the presence of second-phase particles. This study used an optical microscope with a digital camera for microstructural characterization and grain size measurements. The sample for optical microstructural examination was initially conductive mounted. Then, the sample was ground through a series of successively finer grades of emery papers, 80, 120, 180, 320, 600, and 1,000, and grit using water and ethanol as the lubricant and coolant. After that, the sample was mechanically polished with 6 μm, 3 μm, and ¼ µm diamond slurry. The microstructure of the sample was revealed by etching the sample with 2%–5% Nital (nitric acid in ethanol) solution at room temperature for approximately 10 s–20 s. To obtain a refined microstructure, it was necessary to repeat the 1 µm polishing and etch several times.
3.2.2 Scanning electron microscopy with energy dispersive spectroscopy
The scanning electron microscope (SEM) provides an image of surfaces and can capture fine details both at high magnification and at a good depth of field. Unlike a light microscope, the SEM uses electrons instead of white light to view the specimen. In SEM, the electron beam scans the specimen surface point-by-point. The signal collected from each end is used to construct an image on display, with the cathode ray tube beam and the column beam following a synchronized scanning pattern. This means the displayed image is the variation in detectable signal intensity as the column beam is scanned across the sample. The sample preparation for SEM examination is like optical microscopy (described in Section 3.1). The sample was examined using a Quanta FEG 650 operating at (5 KV–20 KV) a chamber pressure (1–13e-3), Torr and gun pressure (2.83e-7), and Torr and emission current (200 µA). The average grain sizes and coating thickness were determined from the linear intercepted length of the particles and grains in SEM imaging of the polished sample. More than 70 grains for each case were considered for measurement for the mounted sheet samples.
3.2.3 X-ray diffraction
X-ray diffraction (X’Pert PRO PANalytical) was carried out to investigate the different phases present in the coating used for this purpose. A PANalytical X’Pert PRO radiation with a Cu-Kα (λ = 0.154 nm). The sample preparation for XRD examination is as that of optical microscopy.
3.2.4 Glancing XRD
Glancing incident ray diffraction is a powerful diagnostic tool for the non-destructive analysis of thin film materials and structures. Glancing X-ray diffraction was carried out to investigate the different phases of the coating. Continuous scans were performed over the 2θ range of 20°C–90°C with a scan rate of 3°C per second and a step size of 0.05°C. The X-ray peak profile analysis was performed using X’Pert high score plus software).
4 Results
4.1 Chemical composition of the sample
The results of the studied sample are presented in this section. The chemical composition of the sample is given in Table 3.

TABLE 3. Chemical composition of the sample (wt.%).
4.2 Substrate steel
The coating was mechanically removed to obtain the microstructure of its top surface. Figures 3A, B show the top surface, while Figures 4A, B show the cross-section of the substrate steel. It appears from the figure that the grains are elongated.
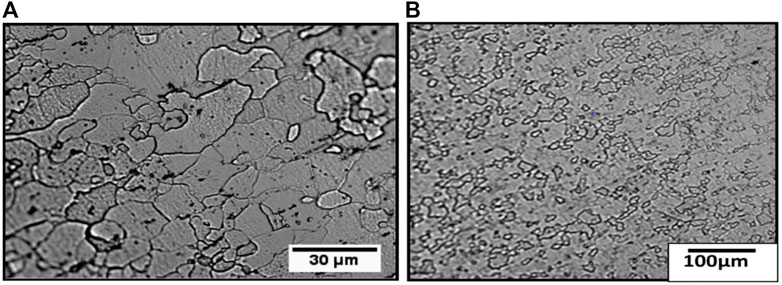
FIGURE 3. Optical micrographs of the sample show the top surface at (A) low and (B) higher magnifications.
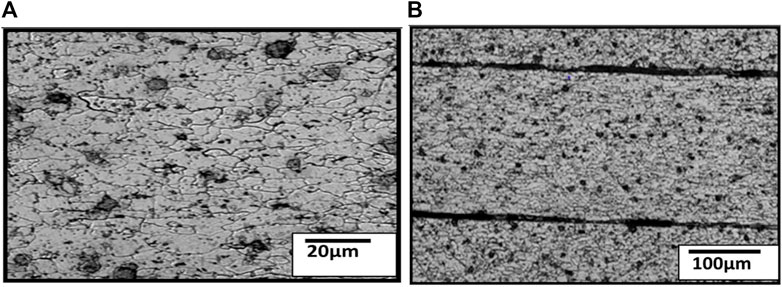
FIGURE 4. Optical micrographs of the sample show the cross-section of substrate steel at (A) low and (B) higher magnifications.
4.3 Scanning electron microscopy along with EDS analysis
SEM photographs of the substrate steel are shown in Figures 5A, B. The top surface after coating removal is shown in Figure 5A, while that of the cross-section is shown in Figure 5B. From the top surface micrographs, equiaxed grains can be observed. However, the cross-section images show that the grains are still elongated. The presence of the second-phase particles can be seen throughout the steel matrix, as shown in Figure 6. EDS analysis of the particles revealed the presence of C and Fe. These are Fe-carbide or cementite.
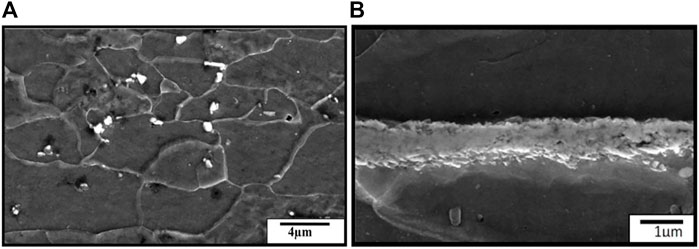
FIGURE 5. SEM micrographs of substrate steel (A) show the top surface after the coating removal surface (B) cross-section sample.
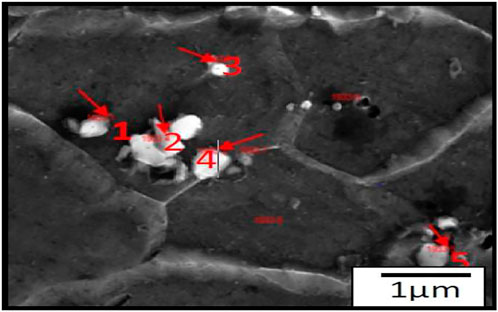
FIGURE 6. SEM micrographs showing the presence of carbide particles inside the grains.
4.4 Grain size of substrate steel
The grain size distribution of the substrate steel of the sample is shown in Figures 7A, B At least 70 grains were considered, and a linear interception method was used for grain size measurements. The average grain size is found to be 5 µm–10 µm in range.
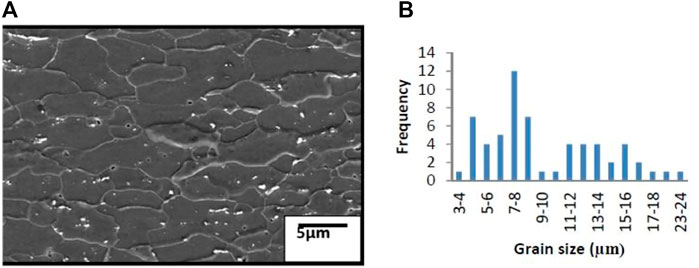
FIGURE 7. (A) SEM micrographs and (B) grain size distribution of the sample.
The corresponding analysis is shown in Table 4 for the presence of carbide particles inside the grains; in Figure 7A, SEM micrographs and in Figure 7B, the grain size distribution of samples are shown.
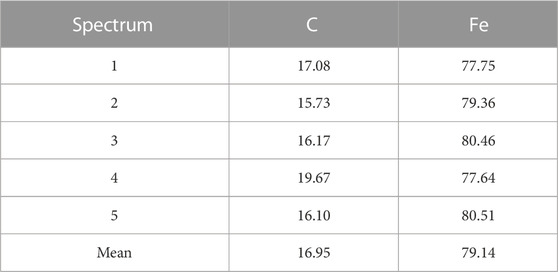
TABLE 4. Corresponding EDS analysis.
4.5 Crystallographic texture of substrate steel
The (222) pole figure and Φ2 = 45°C section of the substrate steel is given in Figures 8A, B. As can be seen from the figure, the high intensity of (222) poles are seen on the rolling plane, in which RD shows the rolling direction, TD shows the transverse direction, and RPF shows the recalculated pole field, and the maximum intensity is 11.752, as shown in Figure 8A. γ-fiber is also present, as can be seen from the ODF in Figure 8B, in which Φ, Φ1, and Φ2 represent the Euler angles, and the maximum intensity is 16.567.

FIGURE 8. (A) 222-pole figure of the sample. (B) Φ2 = 45°C section of the ODF of the sample.
4.6 Coating
After coating, optical micrographs of the sample show the top surface of coated steel in Figure 9A and Figure 9B at low and higher magnifications, respectively.
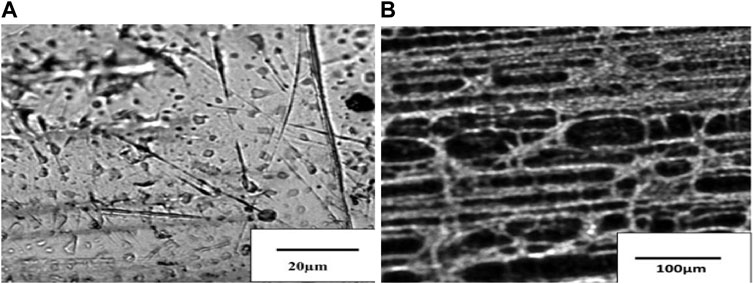
FIGURE 9. Optical micrographs of the sample show the top surface of coated steel at (A) low and (B) higher magnifications.
4.7 Scanning electron microscope
Figure 10A shows an SEM micrograph, and Figure 10B shows SEM with EDS mapping of Fe and Sn, while Figures 14A, B show the line scan of the coating composition; also, the measurement of coating thickness reveals 0.7 µm ± 0.64 µm.
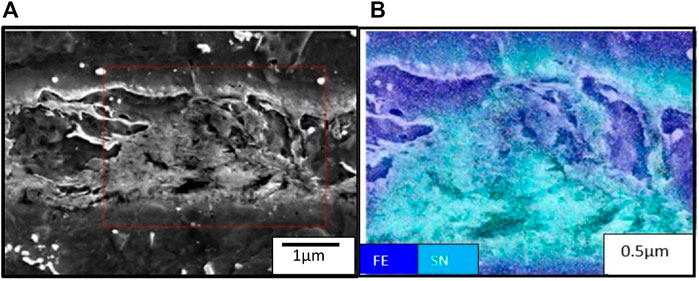
FIGURE 10. (A) SEM micrograph and (B) EDS mapping of the selected area.
5 Discussion
The steel is plain carbon manganese steel. Among steel, it has the lowest carbon and manganese percentage. The studied steel has a single-phase ferrite matrix with a small carbide precipitate. Equiaxed grains in the steels indicate crystallization during their annealing treatment. Although most grains seem to be recrystallized in the presence of deforming sub-structure which can sometimes be noticed inside them, as shown in Figure 11.
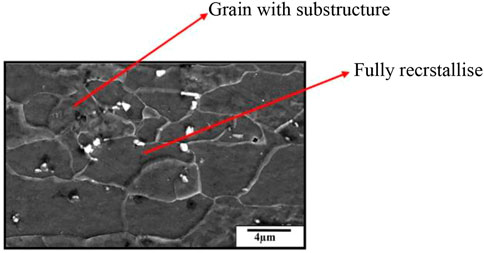
FIGURE 11. SEM micrograph of substrates.
The cross-sectional figure reveals slightly elongated grains along the rolling direction in Figure 12.
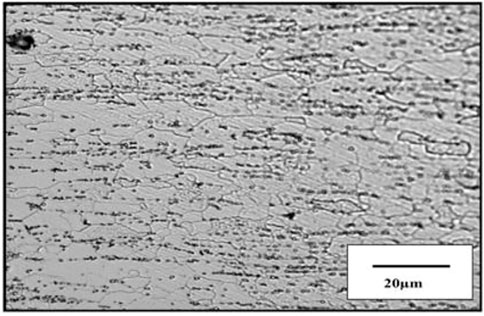
FIGURE 12. Optical micrographs of cross-sectional substrate steel.
Grain size is measured by the linear interception method within a grain size distribution 3–10 µm in the sample. Carbide particles are observed to be present throughout the matrix, on and inside the grains; EDS analysis of this carbide precipitate identified them as Fe3C or cementite. Not much difference between the grain structure and distribution has been observed among the tested steel. However, the distinct differences are noticed in their crystallographic texture. The tested steel should present a sharp γ-fiber. The sample reveals the presence of intensity. This can be seen from the poles and ODF section in Figure 8B. The presence of a sharp γ-fiber indicates higher drawability in this steel. The very often black region in the coated tin is also observed. This is probably porosity in the coating. This is shown in Figure 13B. The tin coating of these samples is found to be 0.5–2 µm thick optical micrograph of the top surface, and the tin-coated steel did not reveal any clear grain structure, as shown in Figures 13A, B.
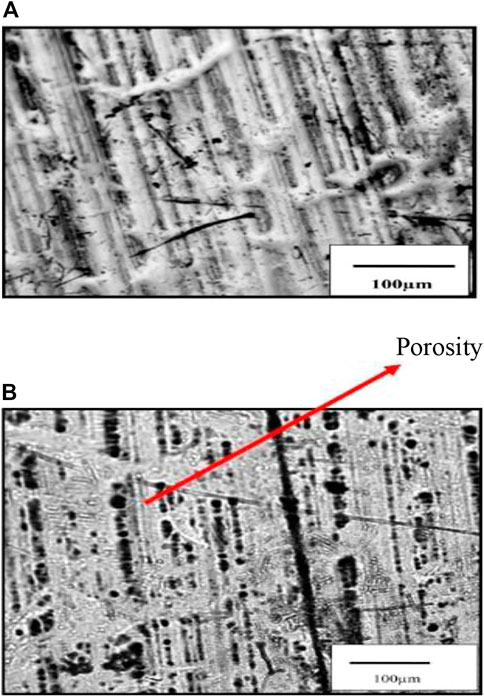
FIGURE 13. (A) Optical micrograph of the sample shows the top surface of coated steel. (B) Optical micrograph shows the top surface of coated steel having porosity.
An EDS line scan on the coating reveals the presence of pure tin and the iron–tin compound, as seen in Figures 14A, B.
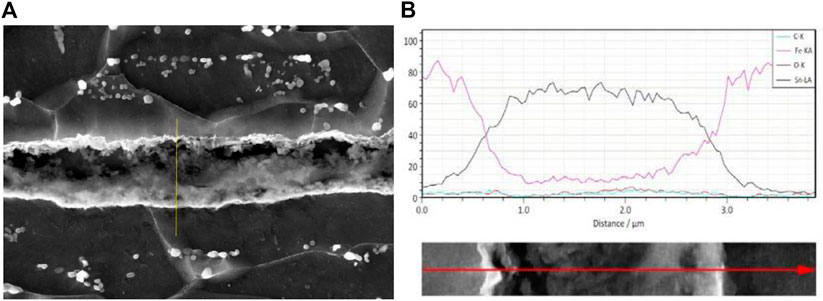
FIGURE 14. (A) SEM micrograph. (B) EDS line scan shows the presence of the compound.
X-ray diffraction analysis was used to identify different phases present in the coating; as described earlier, glancing angle XRD was employed. The glancing angle ensures that the X-ray penetrates mainly the coating and negligible penetration in the iron substrate. This will help to identify the phases present in the thin layer more effectively to illustrate the XRD peak profile of the sample shown in Figure 15, and the peak from different phases have been identified; FeSn2, FeSn, and tin are observed as small peaks of iron that can also be noticed, which come from substrate steel beneath the coating. The intensity ratio of different phases shows it has more alloy formation. However, it also appears that FeSn2 is the main primary alloy that forms during the heat treatment of electrode-deposited tin on steel.
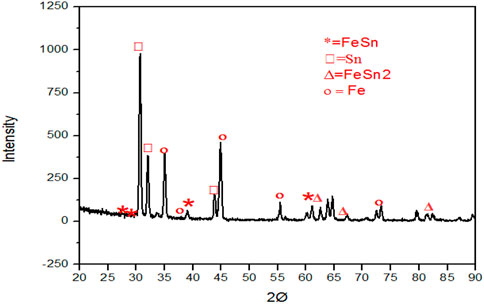
FIGURE 15. Glancing angle XRD peak profile.
6 Conclusion
Based on the experimental analysis, it was found that 1 µm–2 µm tin coating is present on tin-plated steel. Different compounds, such as pure tin, FeSn2, or FeSn, are present in the tin coating. The substrate steel has recrystallized grains with occasional substructure inside them. This suggests the incompleteness of the recrystallization process. The low carbon tin-plated steel has a grain size range of 5–10 µm. Sometimes big and small grains are observed to be present side by side. This also suggests incomplete recrystallization. The presence of solid γ-fiber has been observed. The substrate grain size and distribution and their crystallographic texture, amount of pure tin, and alloyed tin may affect the final properties of tin-plated steel such as corrosion resistance and brightness.
7 Future work
Future work can be carried out to correlate the effect of substrate steel, composition, crystallographic texture, and grain size distribution as well as pure tin and alloyed tin percentage in the coating with the final coating to enhance the properties of tin plate and improve its recyclability and reusability.
Data availability statement
The original contributions presented in the study are included in the article/supplementary material; further inquiries can be directed to the corresponding author.
Author contributions
All authors listed have made a substantial, direct, and intellectual contribution to the work and approved it for publication.
Conflict of interest
Author PG was employed by company Tata Steel Limited.
The remaining authors declare that the research was conducted in the absence of any commercial or financial relationships that could be construed as a potential conflict of interest.
Publisher’s note
All claims expressed in this article are solely those of the authors and do not necessarily represent those of their affiliated organizations, or those of the publisher, the editors, and the reviewers. Any product that may be evaluated in this article, or claim that may be made by its manufacturer, is not guaranteed or endorsed by the publisher.
References
Blunden, S., and Wallace, T. (2003). Tin in canned food: A review and understanding of occurrence and effect. Food Chem. Toxicol. 41 (12), 1651–1662. doi:10.1016/s0278-6915(03)00217-5
Chen, P-Y., Shen, S-T., and Sun, P-C. (1988). Cleaning composition for electrocleaning cold-rolled steel. United States Patent, 4746453.
Coursey, J. S., Schwab, D. J., Tsai, J. J., and Dragoset, R. A. (2015). Atomic weights and isotopic compositions. Version 4.1. Available at: http://physics.nist.gov/Comp.
Deshwal, G. K., and Panjagari, N. R. (2020). Review on metal packaging: Materials, forms, food applications, safety and recyclability. J. Food Sci. Technol. 57 (7), 2377–2392. doi:10.1007/s13197-019-04172-z
Essuman, K. M. (2018). Packaging and trade. Available at: https://www.worldpackaging.org/Uploads/2018-11/ResourcePDF27.pdf.
Fang, C. J., and Wu, L. W. (2015). “Batch annealing model for cold rolled coils and its application,” in European conference on heat treatment 2015 and 22nd IFHTSE congress - heat treatment and surface engineering from tradition to innovation, 13–20.
FICCI (2016). A report on India’s plastic industry. (January): 44. Available at: http://ficci.in/spdocument/20690/plastic-packaging-report.pdf.
Garcia-Oliveira, P., Pereira, A. G., Carpena, M., Carreira-Casais, A., Fraga-Corral, M., Prieto, M., et al. (2022). “Application of releasing packaging in beverages,” in Releasing systems in active food packaging: Preparation and ApplicationsSeid mahdi jafari and ana sanches silva (Cham: Springer International Publishing), 373–401. doi:10.1007/978-3-030-90299-5_13
Hari Kumar, K. C., Wollants, P., and Delaey, L. (1996). Thermodynamic evaluation of Fe-Sn phase diagram. Calphad Comput. Coupling Phase Diagrams Thermochem. 20 (2), 139–149. doi:10.1016/s0364-5916(96)00021-1
Haynes, W. M. (2014). CRC Handbook of Chemistry and Physics. 95th ed. Cell Press. doi:10.1201/b17118
Iversen, L. J. L., Rovina, K., Vonnie, J. M., Matanjun, P., Erna, K. H., ‘Aqilah, N. M. N., et al. (2022). The emergence of edible and food-application coatings for food packaging: A review. Molecules 27 (17), 5604. doi:10.3390/molecules27175604
Kim, J. K., and Tong, X. Y. (1997). Forming and failure behaviour of coated, laminated and sandwiched sheet metals: A review. J. Mater. Process. Technol. 63 (1–3), 33–42. doi:10.1016/s0924-0136(96)02596-4
Kremser, K., Gerl, P., Pellis, A., and Georg, M. G. (2021). A new bioleaching strategy for the selective recovery of aluminum from multi-layer beverage cans. Waste Manag. 120, 16–24. doi:10.1016/j.wasman.2020.11.012
Lubyová, Ž., Fellner, P., Silný, A., and Matiašovský, K. (1977). Determination of the thickness of the tin layer and underlayer in the tin plating of copper and steel bases. Surf. Technol. 5 (6), 479–485. doi:10.1016/0376-4583(77)90013-9
Mordor Intelligence (2022). “Metal cans market - growth,” in Trends, COVID-19 impact, and forecasts (2022 - 2027). Available at: https://www.mordorintelligence.com/industry-reports/global-metal-cans-market-industry.
Morselli, D., Cataldi, P., Paul, U. C., Ceseracciu, L., Benitez, J. J., Scarpellini, A., et al. (2021). Zinc polyaleuritate ionomer coatings as a sustainable, alternative Technology for bisphenol A-free metal packaging. ACS Sustain. Chem. Eng. 9 (46), 15484–15495. doi:10.1021/acssuschemeng.1c04815
Page, B. (2012). “Rigid metal packaging,” in Packaging Technology, 122–162. doi:10.1533/9780857095701.2.122
Sansome, D. H. (1980). Cold rolling of steel (manufacturing and materials processing series, volume 2). J. Mech. Work. Technol. 4 (2), 200–201. doi:10.1016/0378-3804(80)90042-x
Tata Tinplate Tinplate advantages. Available at: http://www.tatatinplate.com/advantages.shtm (Accessed November 15, 2022).
Thomas Jefferson National Accelerator Facility - Office of Science Education. Available at: https://education.jlab.org/itselemental/ (Accessed November 11, 2022).
Tsymbal, V. P., Denisov, V. A., Raev, Yu. N., Kabakanov, Kh. Zh., Il’yashenko, A. V., and Shefer, A. F. (1986). Improvement in the technology for the production of steel for tin plate. Metallurgist 30, 354–355. doi:10.1007/BF00741401
Wan, X., Qian, H., and Chen, G. (2021). “An review on food packaging safety,” in Advances in graphic communication, printing and packaging Technology and materials. Editor P Zhao (Singapore: Springer Singapore), 405–409.
Keywords: tinplating, scanning electron microscopy, X-ray diffraction, optical microscope, energy dispersive spectroscopy
Citation: Pandey S, Mishra KK, Ghosh P, Singh AK and Jha SK (2023) Characterization of tin-plated steel. Front. Mater. 10:1113438. doi: 10.3389/fmats.2023.1113438
Received: 01 December 2022; Accepted: 04 January 2023;
Published: 19 January 2023.
Edited by:
Mohammad Uddin, University of South Australia, AustraliaReviewed by:
Luca Pezzato, University of Padua, ItalyGhulam Yasin, Beijing University of Chemical Technology, China
Copyright © 2023 Pandey, Mishra, Ghosh, Singh and Jha. This is an open-access article distributed under the terms of the Creative Commons Attribution License (CC BY). The use, distribution or reproduction in other forums is permitted, provided the original author(s) and the copyright owner(s) are credited and that the original publication in this journal is cited, in accordance with accepted academic practice. No use, distribution or reproduction is permitted which does not comply with these terms.
*Correspondence: Shatrudhan Pandey, ZXIuc2hhdHJ1ZGhhbnBAZ21haWwuY29t