 Zaira Manigrasso1*
 Wannes Goethals2,3
 Niloofar M. Goudarzi2,3
 Matthieu N. Boone2,3
 Aseel Samaro4
 Chris Vervaet4
 Wilfried Philips1Jan Aelterman1,2,3
- 1Department of Telecommunications and Information Processing (TELIN) - IPI Research Group, Faculty of Engineering and Architecture, Ghent University-imec, Ghent, Belgium
- 2Department of Physics and Astronomy, Radiation Physics, Ghent University, Ghent, Belgium
- 3Centre for X-ray Tomography (UGCT), Ghent University, Ghent, Belgium
- 4Laboratory of Pharmaceutical Technology, Faculty of Pharmaceutical Sciences, Ghent University, Ghent, Belgium
Digital volume correlation (DVC) is a 3D image-based technique for displacement and strain computation. Traditionally, both (digital image correlation) DIC and DVC are methods based on two individual time frames; the estimation of the displacement and strain field is done using one reference and one moving frame as input. However, dynamic experiments generate more than two temporal frames. Therefore, with classical DVC techniques, only a subset of the available data is used. In this study, we propose a novel DVC method that can rely on more than two frames for the displacement and strain computation. The proposed method aims to be as general as possible; there is no constraint regarding the nature or the rate of the displacement (e.g., cyclic or linear). The aim of this method is to impose a temporal regularization that improves the self-consistency of the algorithm. The multi-frame DVC improves the quality of the registration in challenging situations. As an example, we investigate the dissolution of a pharmaceutical tablet in water, which undergoes three processes: swelling, gel formation, and material erosion. The accuracy of the registration—quantified by the sum of square differences (SSD)—has improved by 23% on an average with respect to the classical two-frame method. Classical DVC methods fail in registering images with structures that change appearance through time, such as the tablet that, in contact with water, reacts chemically, changing phase and becoming a gel. Moreover, we proved that multi-frame DVC is more robust in registering images with severe but realistic motion artefacts. As an example for this case, we apply the method to a series of μ-CT datasets of aluminum foam during a compression experiment. As seen with the tablets, we are in a situation where the appearance of the structures in the images changes through time, but in this case it is because of motion artefacts. Finally, the use of more than two frames makes the method more robust against noisy images, with an average improvement of 35% in registration accuracy obtained using the three-frame DVC method compared to the classical two-frame DVC method.
1 Introduction
Digital volume correlation (DVC) (Bay et al., 1999) is an image-based technique for full-field displacement and strain computation derived from the theory of digital image correlation (DIC) (Bruck et al., 1989). DVC is a powerful method to study the dynamics of 3D objects that were imaged in a non-invasive way. Traditionally, DVC is a two-frame method; the correlation occurs between two volumes, the reference and the moving one. If more than two frames are available (4D dataset-multiple 3D frames), the correlation occurs between each consecutive couple of 3D frames and the resulting deformation fields are concatenated or between each frame and the reference frame.
Examples of groupwise image registration, where two or more images are registered in the same optimization step, already exist. They have been mainly developed for atlas creation of medical images where the choice of a reference frame might affect the result of the registration (Geng et al., 2009), introducing bias towards the selected frame (Wu et al., 2012). Such methods, therefore, are symmetric because all the images play the same role in the registration process. The groupwise methods can be divided into three categories (Wu et al., 2012): pairwise registration derived groupwise registration (PDG), population center guided groupwise registration (PCG), and hidden common space based groupwise registration (HCSG). The PDG method performs pairwise registration between each couple in the image population. Namely, the method developed by Seghers et al. (2004) registers each couple in the image population, changing reference images, and then warps the reference images with the average displacement. In total, it performs N(N − 1) registrations (with N the number of time frames available) and, for this reason, it is computationally demanding. Other PDG methods, instead, after registering all the images with each possible template in the population, create a distance matrix to choose the image that is closest to the population center as a reference. Once the reference image is selected, all the other images are registered with it. In this case, since the matrix is symmetric, only N(N − 1)/2 registrations are needed (Park et al., 2005). PCG methods, instead, consist of registering all the images with a population center. The methods developed aim to find the population center by following different procedures and then registering all the other images with the population center. These methods have some limitations. They might fail when they try to register sharp images with blurry images (Wu et al., 2012). Moreover, the found population center may differ from the actual population center, and this can lead to some inaccuracy in the registration (Wu et al., 2012). To overcome such a limitation, hidden common space groupwise methods have been developed (Huizinga et al., 2016; Guyader et al., 2018). In this case, the aim is to minimize the variation within the population. However, this set of methods does not suit our applications. Indeed, because the population center does not coincide with a physical frame the problem results to be unconstrained (Metz et al., 2011). To solve this issue some constraints must be imposed on the transformation. To register frame A to frame B, for instance, two transformations must be computed, which respectively link frame B to the population center and the population center to the frame A. The transformations are often forced to be the inverse of each other (Aganj et al., 2017), or they may be constrained to have zero-sum displacement field (i.e., cyclic motion) (Metz et al., 2011; Aganj et al., 2017).
The applications of DVC we are interested in differ for two reasons from the applications we described so far; the displacement of the temporal image sequence we need to measure is not compatible with the aforementioned dynamic constraints. Moreover, groupwise methods are used for a simultaneously alignment of all the images, without taking in consideration the temporal continuity of the data (Metz et al., 2011). The temporal data continuity is rather an important factor for our applications. Indeed, the main objective we want to focus on is the improvement of the self-consistency of DVC in order to improve the accuracy of the registration of images that change appearance through time.
In general, registration of image sequences has gained high interest for meteorology (Héas and Mémin, 2008), security (Wu et al., 2019), military, industrial, medical, and transportation purposes (Huang and Tsai, 1981). When an image sequence is available, instead of using the groupwise methods described above, it is possible to use methods based on joint estimated camera pose and matching among multiple frames (Jo et al., 2018; Ngeljaratan and Moustafa, 2020; Zona, 2020; Wani et al., 2022). Other temporal sequence DIC methods, instead, estimate the motion incrementally using two frames with temporal constraints. In the past, it was done using recursive temporal filters (Fleet and Langley, 1995; Fejes and Davis, 1999; Clifford and Langley, 2000). More recently, algorithms based on data conservation constraint and temporal coherence constraint (Irani, 2002; Ricco and Tomasi, 2012; Garg et al., 2013) or based on temporal integration (Irani et al., 1992; Sundaram et al., 2010) or deep learning techniques (Qin et al., 2018; Bae et al., 2021) were implemented. The listed techniques have the downside of accumulating error when the motion is computed between successive time frames. To overcome those limitations, the motion might be estimated from image sequences using simultaneous multi-frame estimation, where multiple frames of the sequence are considered simultaneously (Zelnik-Manor and Irani, 2000; Cofaru et al., 2012). Such methods are implemented for temporal sequences of 2D images (a (2 + 1)D dataset), and in the study by Cofaru et al. (2012), the main assumption is that the displacement rate between each pair of consecutive time frames is approximately the same and small.
In our work, we developed a multi-frame DVC method built for 4D (or (3 + 1)D) datasets, without any constraint concerning the similarity of the displacement rate between two consecutive time frames.
The novel method introduces a temporal regularization, improving the self-consistency in the image domain and the accuracy of the results. Moreover, enforcing consistency over more than two frames makes the algorithm more robust to noise (Stiller and Konrad, 1999; Cofaru et al., 2012), which is a regular source of errors in registration algorithms (Powierza et al., 2019). The self-consistency constraint plays an important role in the applications we will present in this paper. Indeed, classical DVC techniques are traditionally designed to estimate the deformation field from images, acquired by the same or by different imaging techniques, of materials that simply deform while holding their appearance. For the experiments reported in this study, we require a DVC algorithm that is able to cope with structures that change their appearance through time as a consequence of a chemical reaction and therefore material transformation (i.e., gel formation) or because of motion artefacts that cause image blurring. The solution to this problem has been found by considering the entire, or part, of the image sequence in the same optimization process and adding a consistency term to the cost function.
2 Multi-frame method
DVC estimates the three-dimensional displacement field
where,
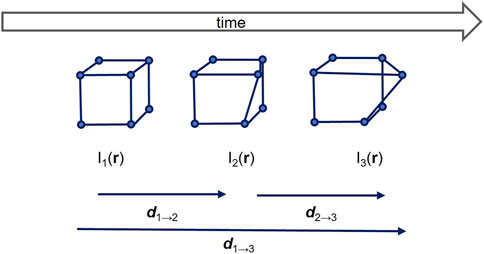
FIGURE 1. Schematic overview of the multi-frame method, with number of frames equal to 3.
2.1 Cost function
The proposed DVC method uses sequences of N frames through time. Let us consider the following frames
The general cost function is defined as
where, d1→N(r) is computed by concatenating recursively the displacement fields (di→i+1) such that
Eq. 2 is an extension of the corresponding classical 2-frames sum of squared differences (SSD). SSD optimizes the displacement fields to enforce a constancy of brightness after registration. The first term of Eq. 2 defines the similarity criteria between each two consecutive time frames of the temporal sequence, the last term defines the similarity metric between the first and the last frame of the temporal sequence, I1 and IN. The last term is the consistency term.
The principle of multi-frame DVC can be applied using other metrics (e.g., normalized cross correlation, mutual information). In the case of low contrast and low signal-to-noise ratio, indeed, the accuracy of the registration computed using SSD might decrease. Other similarity metrics like mutual information, for instance, can be used in the case of multi-modal image registration.
2.2 Algorithm
In this section, the optimization process to obtain a final estimation of di→i+1(r) will be illustrated. As already mentioned, the method uses temporal sequences of N frames. For convenience of notation we set N = 3. Therefore, the unknown displacement fields will be d1→2(r) and d2→3(r). The algorithm is based on the principle of alternating optimization, which is an iterative procedure to minimize the cost function over all the variables (Bezdek and Hathaway, 2003). The optimizer is a gradient based method, namely the Quasi-Newton Broyden-Fletcher-Goldfarb-Shanno algorithm (BFGS) (Broyden, 1970; Fletcher, 1970; Goldfarb, 1970; Shanno, 1970).
The algorithm consists of three steps. In the first step, a coarse approximation of d1→2(r) and d2→3(r) is computed separately. The displacement fields are obtained by registering the two volumes at low resolution (scaling factor = 0.25) by using the classical two-frame method. The outputs of the first step are the coarse displacement fields
where,
In the following steps, each displacement field is updated sequentially. In the second step,
At the third step,
where,
2.3 Parametric multi-resolution displacement field
In this work, the displacement is modelled using a tensor product of cubic B-spline functions in x, y, and z direction d(r) = Bx(x)By(y)Bz(z). Because of their properties of local support and smoothness and because they are computationally efficient, cubic B-splines are widely used in image deformation (Rueckert et al., 1999; Xie and Farin, 2004). B-spline-based deformation models are classified as parametric transformation (Szeliski and Coughlan, 1997; Rueckert et al., 1999; Tustison et al., 2009). The parametrization of the displacement field allows for a reduction in the dimensionality of the optimization problem. The parametrization is imposed on a mesh nx × ny × nz of control points Φi,j,k that are equally spaced.
Multi-resolution of non-rigid parametric transformation can be modelled by changing the distance between control points. By increasing the number of control points, better local control of the deformation is possible (high degree of non-rigid deformation), but the computational cost increases. In order to reach a good compromise, a multi-resolution approach is used. The multi-resolution approach involves multiple levels of subsampling and smoothing of the images, in addition to a reduction of the B-spline node spacing resolution. The displacement field at each level of the pyramid is initialized by linearly interpolating the control point weights from the previous level of the pyramid. Other than reducing the computational time, the multi-resolution method reduces the influence of noise (Thirion, 1995; Kovacic and Bajcsy, 1998).
In this paper, a Gaussian pyramid approach has been used; the coarsest levels of the pyramid are obtained through a subsequent Gaussian filtering of the images based on local convolution and subsampling (by a factor of 2). The total number of levels for both experiments has been set to 3. The mesh size at the coarsest level was set to 32 × 32 × 32 voxels and for each of the next levels of the pyramid the resolution was incremented by a factor of 2. At the last level, it reaches the size of 8 × 8 × 8 voxels. For the first coarse approximation of the displacement fields
3 Experimental applications
3.1 Dataset
The algorithm has been tested on two datasets with very different dynamics: erosion of a pharmaceutical tablet and compression of aluminum foam.
3.1.1 Pharmaceutical tablet
This experiment aims to study the dynamics of a pharmaceutical tablet during an in-vitro dissolution experiment. The tablet undergoes three processes: swelling, gel formation, and material erosion. The last two processes occur mainly at the edges of the tablet, where the water is in direct contact with the tablet. The erosion process causes material within one voxel to dissipate, resulting in a meaningless tracking of image intensity. The most challenging process to address by using DVC is the swelling of the area where the tablet changes its phase, becoming gel. From the image point of view, the change in phase corresponds to a change in the gray level of the voxels. The volume fraction of gel at the edges of the tablet increases through time, see Figure 2A. At t = 0, there is no gel, and as the time progresses, the gel layer around the tablet becomes thicker.
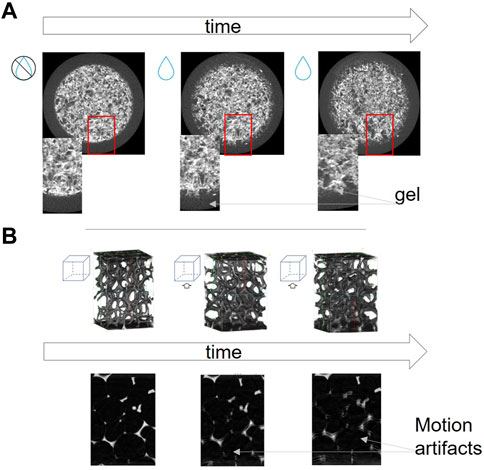
FIGURE 2. (A) Central slice (658×658 voxels) of the pharmaceutical tablet before the experiment (dry condition) and during the experiment. The images show the presence of gel at the edges of the tablet. (B) Volumes and central slices (401×601 voxels) of the aluminum foam sample before and during the compression experiment. The aluminum foam dataset is an artificially slowed down dynamic acquisition of the sample during compression, which is why motion artifacts are present in the images.
For the acquisition of the dataset, the Environmental Micro CT scanner (EMCT) (Dierick et al., 2014) was used. For each μ-CT scan, 600 projections were taken over 360° at 80 kV acceleration voltage and 8 W output power. The acquisition time for one scan is 120 s. The voxel size is 20.18 μm. For the volume reconstruction, the Octopus software (Vlassenbroeck et al., 2007) was used.
3.1.2 Aluminum foam
The aluminum foam open-cell has been scanned during a dynamic process of compression. The sample size is 20 mm × 20 mm × 22mm, the total compression is 35% (
At these very fast acquisitions and the low compression speed, barely any motion artefacts are present in the data. However, such short acquisitions produce large volumes of data and a good contrast-to-noise ratio is difficult to achieve in more complex data. In many experiments, motion artefacts are therefore present (De Schryver et al., 2018). To test our proposed method in challenging situations, we introduced motion artefacts in the data by simulating a faster acquisition. The compression has been accelerated by a factor of 32 by updating the sample 32 times per revolution in a simulated CT scan. The simulated CT scan was reconstructed again with one time step per revolution, which now contained severe motion artefacts due to the accelerated dynamics.
The resulting images are strongly affected by motion artefacts, Figure 2B. The first image of the triplet shown in Figure 2B was acquired at the start of the experiment, where the effect of compression jaws was not as strong as the later stages, which is why it does not have motion artifacts.
4 Results
In this section, we demonstrate that multi-frame DVC can improve registration quality in the case of dynamic experiments (4D data) with changes in structural appearance. Such changes can be both due to real changes in the sample, for example, in the case of chemical reactions, or due to acquisition artefacts in the images, i.e., motion artefacts. In this section, the results of the image registrations using different numbers of time frames are compared. For every dataset, the comparison was done considering all the frames belonging to the considered temporal sequence. This means that if we considered, for instance, a temporal sequence composed of four frames, to register the last frame to the first frame of the sequence, we compared the three methods defined as follows:
• Two-frame-conc method: concatenating 2-frames registration computed between each consecutive frames couple, Figure 3A.
• Three-frame-conc method: concatenating 3-frames registration computed between the first three frames, Eq. 2, and 2-frames registration computed between the last two frames, Figure 3B.
• Four-frame method: using four-frame method, Eq. 2 and Figure 3C.
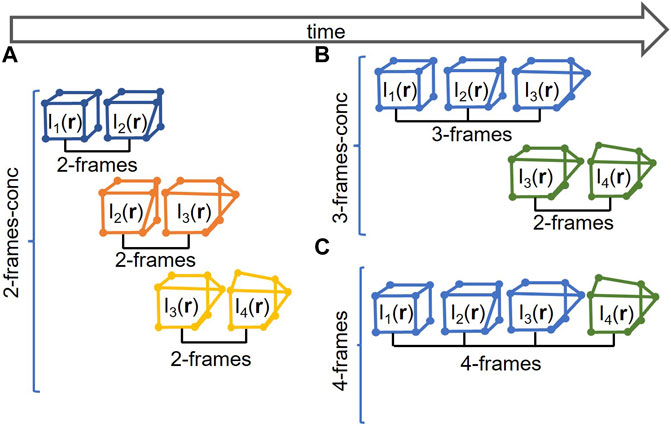
FIGURE 3. (A) Schematic explanation of concatenation of the 2-frames method (2-frames-conc); (B) schematic explanation of concatenation of the 3-frames and 2-frames method (3-frames-conc); (C) schematic explanation of the 4-frames method.
In this way, regardless of the method used, the amount of information given as input to the method remains unchanged. This allowed us to distinguish whether the added accuracy comes from the multi-frame proposed method or whether it comes from the fact that we used more information. Indeed, the alternative to this approach would be to compare either the multi-frame method to the direct two-frame method computed between the first and the last frame of the temporal sequence or the multi-frame method to the 3-frames method computed between the three out of four frames belonging to the temporal sequence. However, for the sake of completeness in Section 5, the 4-frames method has also been compared with the classical direct 2-frames method (where the first and the last frames of the temporal sequence are registered).
4.1 Validation of the registration accuracy
Our analysis was mainly based on data-fit quantification. Indeed, being a real and non-destructive experiment with a complex dynamic, we do not have a ground-truth to compare the displacement field with. Therefore, a quantitative evaluation of the displacement field was not possible.The validations of the registration accuracy were done following qualitative methods and qualitative assessments:
• Sum of Squared Difference (SSD): this expresses the data fidelity of the solution; it is based on the pixels intensity. For the SSD definition see Section 2.1.
• Consistency map: it is defined as the difference between the reference and the warped frame. A small magnitude difference is indicative of high consistency between the reference frame and the warped frame. An ideally estimated deformation would produce perfect consistency.
• qualitative assessment of the displacement fields.
4.2 Tracking pharmaceutical tablet dissolution
The multi-frame method algorithm was compared with the 2-frames-conc method. The parameter evaluated is the quality of the registration expressed in terms of SSD computed considering the first and last warped frame of the temporal sequence.
The algorithm has been applied by using different groups of three frames:
• T1: 00h10 min - 00h20min - 00h30min
• T2: 00h30 min - 1h00min - 1h30min
• T3: 1h00 min - 1h30min - 2h00min
• T4: 1h30 min - 2h00min - 2h30min
• T5: 2h00 min - 2h30min - 3h00min
and groups of four frames:
• Q1: 00 h30min - 1 h00min - 1 h19min - 1h30min
• Q2: 1 h00min - 1 h30min - 1 h45min - 2h00min
As mentioned in Subsection 3.1.1, the tablet undergoes three processes through time: swelling, gel formation, and erosion at the edges. The time step (Ts) between each frame of the group varies between groups and within groups: Ts (T1) = 10min; Ts (T2, T3, T4, T5, T6) = 30 min; Ts (Q1) = 30, 19, 11 min and Ts (Q2) = 30, 15, 15 min.
The first set of results Figure 4 shows a comparison between the 3-frames method and the 2-frames-conc method applied to the five triplets. Figure 4A shows the central slice of the volume given by the difference between the deformed volume (i.e., deformed version of the last frame of the sequence) computed using the 2-frames-conc method (first row) and 3-frames method (second row), and the reference volume (i.e., first frame of the sequence). The 3-frames results were computed using our proposed method, Eq. 2.
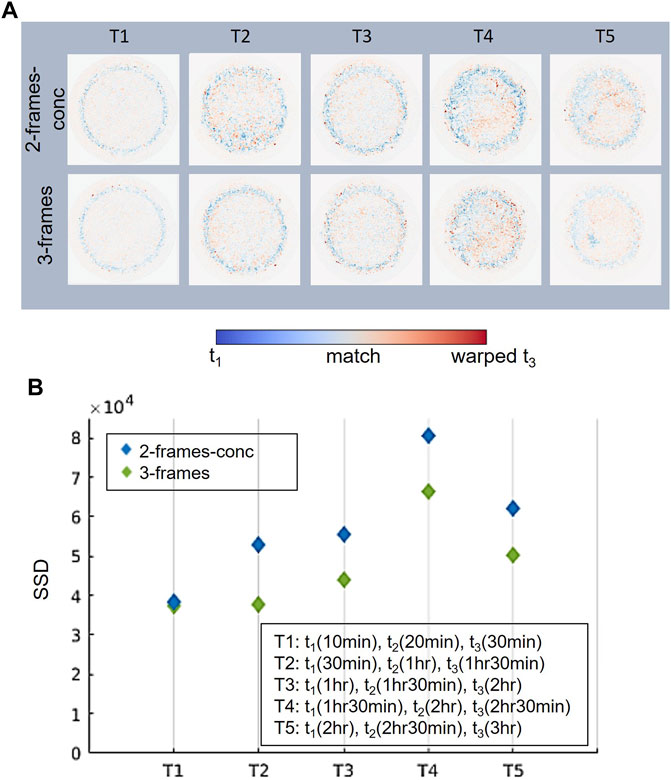
FIGURE 4. (A) Central slices of the consistency map defined as the difference between the reference (i.e., first frame of the temporal sequence) and deformed volumes (i.e., deformed last frame of the temporal sequence): blue regions correspond to material of t1 does not match material in the warped t3; red regions correspond to material of the warped t3 does not match material in t1; white regions correspond to material of warped t3 that fully overlaps material in t1. The first row is related to the 2-frames-conc method and the second row is related to the 3-frames method. Five triplets have been analyzed, from T1 to T5. (B) Registration accuracy evaluated by SSD metric for the five triplets.
The results show an improvement in the quality of the registration for each group analyzed, but for the groups T2, T3, T4, and T5 it is more marked. The average improvement in terms of SSD for the aforementioned groups is 23%, while for T1 the improvement is limited to 2.3%. Such a result shows, therefore, that as the gel formation process advances, it effects the structure and DVC more. Indeed, from Figure 4A, it can be noted that the difference in terms of registration quality is mainly evident at the edges of the tablet, where in addition to the swelling process, the tablet undergoes a process of gel formation.
On the same dataset, DVC with four frames was performed. In this case, groups of four frames were analyzed. The quality of the registration measured by using the 4-frames DVC was compared to the quality achieved by using the 2-frames-conc method and the 3-frames-conc and method, see Figure 5. The experiment was carried out using Q1 (0h 30 min, 1h 0 min, 1h 19 min, 1 h 30 min) which resembles T2 with the addition of one extra intermediate frame acquired after 1 hr 19 min and using Q2 (1 h 0 min, 1 h 30 min, 1 h 45 min, 2h 0 min) which resembles T3 with the addition of one extra intermediate frame acquired after 1 hr 45 min. The performances achieved by using the four-frames method have been compared to other possible registration configurations, Figure 5
• 4-frames method versus 3-frames-conc method: the 4-frames method was compared to the results obtained from the 2-frames-conc method applied to the consecutive image pairs of the subsets. In the case of Q1, the 2-frames-conc method was applied between frames acquired at 00 hr 30 min and 1 hr 00 min, 1 hr 00 min and 1 hr 19 min, 1 hr 19 min and 1 hr 30 min. When the three registrations are completed, the final displacement field is obtained by the concatenation of the three displacement fields. The same was done for Q2, and the registration was performed between frames acquired at 1 hr 00 min and 1 hr 30 min, 1 hr 30 min and 1 hr 45 min, 1 hr 45 min and 2 hr 00 min. The 4-frames method improved the registration quality by 62.3% for Q1 and by 14.9% for Q2 compared to 2-frames method.
• 4-frames method versus 3-frames-conc: the 4-frames method was compared to the results obtained from 3-frames combined with the 2-frames method. In this case, the same subsets of four frames (Q1 and Q2) were used. For the 3-frames registration, frames acquired at 30 min, 1 hr, and 1 hr 19 min were considered and the cost function used was Eq. 2. Subsequently, frames at 1 hr 19 min and 1 hr 30 min were registered using 2-frames method, according to the scheme in Figure 3B. When the two registrations were completed, the final displacement field was obtained by the concatenation of the two displacement fields. In the case of the subset Q2, the three-frame registration was performed between frames acquired at 1 hr, 1 hr 30 min, and 1 hr 45 min, and the 2-frames registration was performed between frames at 1 h45 min and 2 h. 4-frames method improved the registration by 2.6% for Q1 and by 2.7% for Q2 compared to three-frame-conc method.

FIGURE 5. (A) Central slices of the consistency map defined as the difference between the reference (i.e., first frame of the temporal sequence) and deformed volumes (i.e., deformed last frame of the temporal sequence):blue regions correspond to material of t1 does not match material in the warped t4; red regions correspond to material of the warped t4 does not match material in t1; white regions correspond to material of warped t4 that fully overlap material in t1. The first map is related to the 2-frames-conc method, the second is related to the 3-frames-conc method and the third is related to the 4-frames method. (B) Registration accuracy evaluated by SSD metric.
We compared qualitatively the displacement field obtained by the two-frame-conc and the four-frame method for the temporal sequence Q1, Figure 6. The displacement field in the case of the four-frame method is more homogeneous in the center of the tablet, suggesting homogeneous swelling of the tablet itself at this point in time. In the displacement field, in the areas corresponding to the edges of the tablet, there are some noisy spots. Since they are all located at the edges of the tablet, this is consistent with the known behavior of tablet dissolution happening at the edge of the tablet. We therefore assume this to be a more accurate displacement field. The displacement field obtained by the two-frame-conc method is less homogeneous even inside the tablet. This is reflected in a worst data-fit, Figure 6.
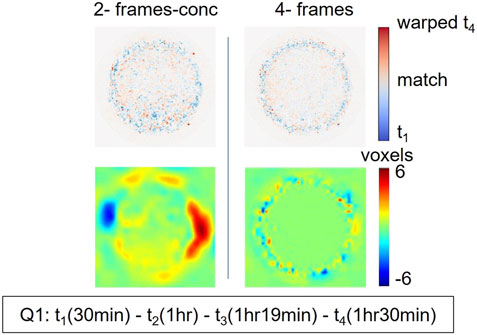
FIGURE 6. In the first row is shown central slices of the consistency map defined as the difference between the reference (i.e., first frame of the temporal sequence) and deformed volumes (i.e., deformed last frame of the temporal sequence): blue regions correspond to material of t1 does not match material in the warped t4; red regions correspond to material of the warped t4 does not match material in t1; white regions correspond to material of warped t4 that fully overlap material in t1. In the second row the magnitude of the displacement field computed using 2-frames-conc and 4-frames in the plane x-y is shown.
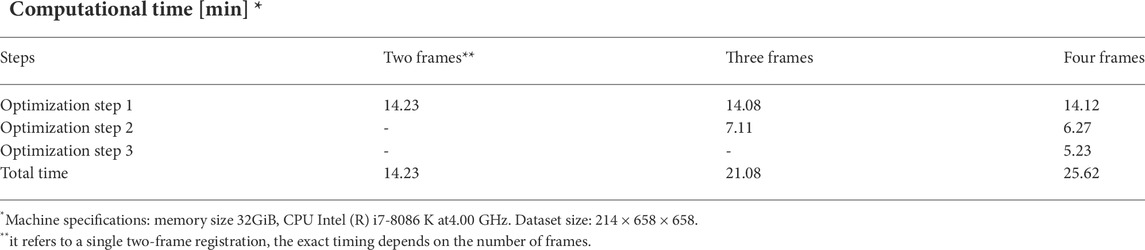
An important aspect to consider is the computational time for the optimization. It depends on the number of steps, which in turn depends on the frames number, see Section 2.2. The results are reported in Computational time table. The values of computational time reported in the table are obtained from the average of three measurements done on the same temporal sequence (i.e., Q1). The computational time of two-frame method refers to the time needed to register each frame couple belonging to the temporal sequence. The exact timing, therefore, depends on the number of concatenations.
4.2.1 Noise robustness of the algorithm
An additional experiment was performed to test the robustness of the algorithm to the noise.
For this purpose, in the DVC tablet experiment, random image noise with a normal distribution of zero mean and a standard deviation (std) ranging from 0.01 to 0.03 was added to the images. The intensity of the images’ gray level ranges between 0 and 1. The PSNR of the simulated datasets, computed with the original image as the reference, ranges from 35.5 to 35.7 dB. In this experiment, a sequence of three temporal frames (00h30min, 01h00min, 01h19min) was analyzed and the 2-frames-conc method was compared to with the 3-frames method. The quality of the registration was evaluated by using SSD.
The registration accuracy improvement using 3-frames versus 2-frames-conc became more evident for images with lower PSNR, see Figure 7. The improvement in SSD for PSNR = 35.5 dB is 35.7%, for PSNR = 35.6 dB is 35.1%, and for PSNR = 35.7 dB is 33.0%.
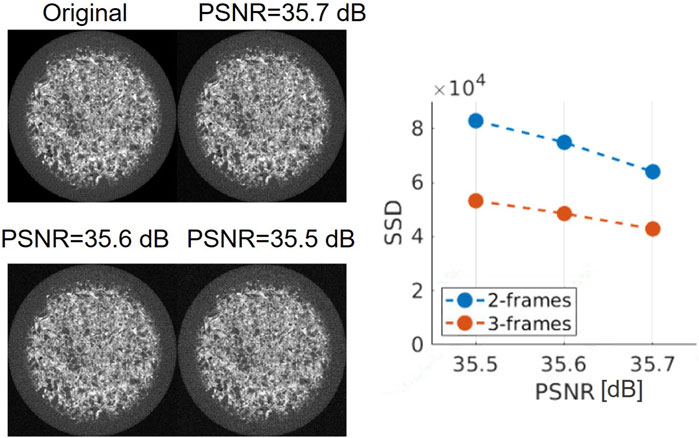
FIGURE 7. Central slice of the tablet acquired after 30 min, without additional noise and with additional simulated noise. PSNR ranges from 35.5 to 35.7 dB. In the graph on the right of the Figure, the SSD variation as noise changes is reported for 2-frames-conc and 3-frames method.
4.3 Tracking aluminum foam compression
The multi-frame algorithm was compared with the 2-frames-conc method. The parameter evaluated was the quality of the registration between the first and the last warped frame expressed in terms of SSD. The algorithm was applied by using different groups of three frames. The first set of results, as shown in Figure 8 shows a comparison between the 3-frames method and the 3-frames-conc method applied to two triplets. The first considered triplet (Figure 8A), composed of frames t1, t2 and t3, was acquired at the beginning of the compression experiment. The frame t1, as often encountered in experimental data, does not contain motion artefacts. The following frames contain more severe motion artefacts. The artefacts’ severity changed through the sample and through time. Since the sample was compressed in the z direction from the bottom to the top, the artefacts at the first stages (frames t2, t3) are more severe at the bottom of the sample. The artefacts also propagate to the top part of the sample over time. In Figure 8B, the consistency map between frame t1 and the warped frame t3 is shown after 2-frames-conc and 3-frames DVC. For 2-frames-conc results, the registration quality drops going from the top to the bottom of the sample. Such behavior is correlated with the aforementioned distribution of motion artefacts. The registration quality obtained by using 3-frames DVC instead looks more homogeneous through the sample, showing the robustness of the multi-frame method against motion artefacts.
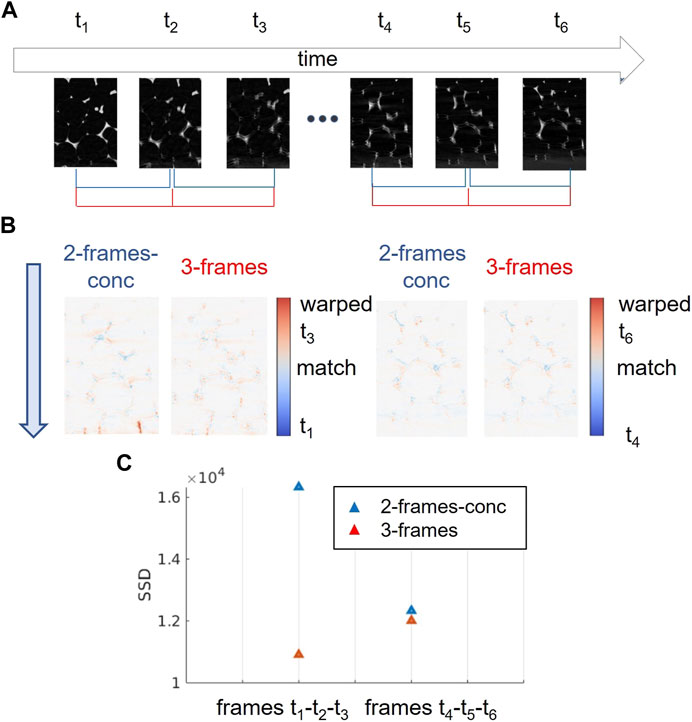
FIGURE 8. (A) Vertical slices of the frames through time. (B) Central slices of the consistency map defined as the difference between the reference and deformed volumes: red regions correspond to material of the warped t3/t6 does not match material in t1/t4; blue regions correspond to material of t1/t4 does not match material in the warped t3/t6; white regions correspond to material of warped t3/t6 that fully overlap material in t1/t4.(C) Registration accuracy evaluated by SSD metric for the two triplets.
The same experiment was carried out with another triplet composed of frames t4, t5, and t6, acquired at the late stage of the compression experiment. In this case, the severity of the motion artefacts is roughly the same throughout the sample (from bottom to top) and through time. The quality of two-frame-conc DVC is already high Figure 8B.
For the first triplet, the improvement using 3-frames over 2-frames-conc DVC is 29.2%, for the second triplet it is only 1.0%. Such a difference is in accordance with what has been observed with the tablet experiment; the registration of frames with structures with similar appearances does not have a great benefit from the self-consistency constraint introduced by the multi-frame method as frames with a big difference in the severity of motion artefacts.
As in the case of the pharmaceutical tablet experiments, we did not have ground truth to compare the displacement field with. Therefore, also in this case, we performed a qualitative comparative analysis between the displacement field computed by the 2-frames-conc and the 3-frames method. In this case, we expected a displacement field mainly oriented in the direction of the compression that gradually decreases its magnitude going from the bottom to the top of the sample. This is, indeed, what we observe from the displacement fields shown in Figure 9. The main difference we can observe between the displacement computed by the two-frame-conc method and the displacement computed by the 4-frames method is that the first one is more noisy. Such evidence is supported by results reported in the work by Cofaru et al. (2012). In this work, indeed, the displacement field computed using the multi-frame method was less noisy than the one computed using the classical 2-frames method and the data-fit was higher. We therefore assume the 4-frames method to have produced a more plausible deformation field.
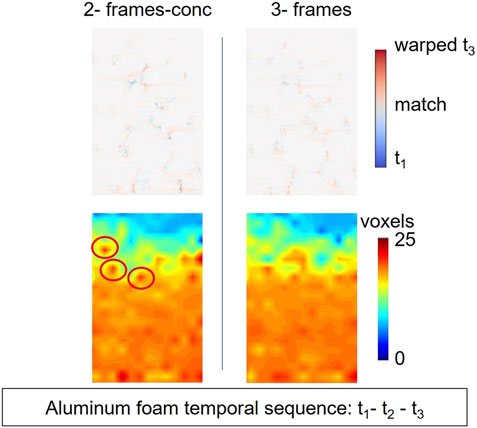
FIGURE 9. In the first row is shown the central slices of the consistency map defined by the difference between the reference and deformed volumes is shown. Red regions correspond to material of the warped t3 does not match material in t1; blue regions correspond to material of t1 does not match material in the warped t3; white regions correspond to material of warped t3 that fully overlap material in t1. In the second row the magnitude of the displacement field computed using 2-frames-conc and 3-frames in the plane y-z is shown. The red circles in the figure highlight peaks of noise.
5 Discussion
The results show an improvement using multi-frame DVC compared to the concatenation of 2-frames DVC. Both pharmaceutical tablet (Figures 4, 5) and aluminum foam results (Figure 8) show a greater improvement in areas of the image where the appearance of the structures changes, because of chemical reactions (gel formation) or experimental conditions (motion artefacts). Such situations, indeed, pose a challenge for classical DVC and for this reason a regularization is needed. Moreover, for the proposed experiments, the frequency of the dynamic is unknown. Knowing exactly the dynamic frequency is, indeed, possible to take as input of the DVC algorithm those frames that helps to reconstruct the entire trajectory of the sample. If this a priori information is unknown, any couple of frames we give as input to the algorithm, generates a leakage of information. The idea of introducing more than two frames in the registration process has the purpose of introducing as much information as possible that otherwise will not be used. Therefore, the use of more than two frames permits a temporal regularization that improves the DVC self-consistency.
The first and the last time steps hold a larger weight in the consistency than, for instance, in the groupwise methods Huizinga et al. (2016); Guyader et al. (2018) mentioned in Section 1. Therefore, it is good for these frames to be of higher quality. This happens regularly in μ − CT, where a pre- and post-scan are acquired at static high resolution conditions to analyze the dynamic series.
From a result comparison, it appears that an improvement is visible even if, considering the same temporal range, more frames are used. Let us consider the results reported in Figures 4, 5. The group T2 (00h30min - 1h00min - 1h30min) has the same temporal limits of the group Q1 (00h30min - 1h00min - 1h19min - 1h30min), but Q1 contains one frame more (i.e., 01h19min). The registration quality in registering time frame 00h30min with time frame 1h30min is higher if more temporal frames are used, even if it is with the 2-frames-conc method.
Even the registration noise robustness increases upon increasing the number of frames. The graph in Figure 7 shows how the registration accuracy improvement obtained by using 3-frames DVC becomes more evident for images with lower PSNR.
It is interesting to notice how the computational time does not increase linearly with the number of frames (see Table Computational time). Indeed, the convergence of the steps that follow the first one benefits from the results of the previous steps.
Other cost functions have been implemented in the course of this study in order to use more than two frames belonging to the image sequence. The most obvious one was defined by one term for each possible image couple that occurs:
Compared to Eq. 2, it contains more terms. If we consider the case of a temporal sequence with four frames, it contains two more terms, and that means two more optimization steps. The computational time, therefore, increases. We compared the results based on computational time and registration accuracy for the two cost functions, namely Eqs 2 and 6, for a 4-frames temporal sequence. In terms of computational time, the average increment is 28% and the SSD improvement using the cost function (6) is 0.5% for Q1 and 1.1% for Q2. For these applications, given the little improvement in the registration quality and the large increase in the computation time, we decided to use the cost function (2). The computational complexity is reduced by only one consistency term. However, we do not exclude that, for other applications, the use of the cost function (6) might lead to significantly better results in terms of registration quality. If the number of frames increases substantially, an alternative solution that includes polynomial regression to compute the displacement field, taking as input multiple time frames, might be more efficient in terms of computational time. However, by imposing the degree of the polynomial, we would introduce a constraint to the dynamic we want to measure using DVC. On the other hand, the method we propose allows the calculation of the instantaneous displacement field with a higher degree of spatial freedom, at the cost of computational time. Given the complex dynamics of the experiments we proposed in this paper, we think that the proposed method could bring some advantages.
The concatenated 2-frames method has been compared with the 2-frames method applied between the first and the last time frames (direct 2-frames method), neglecting all the frames in between. Despite the amount of information that is greater in the case of 2-frames-conc, it is possible that because of instability issues due to concatenation, the result is worse than the result obtained using the direct 2-frames method between the first and the last frame of the temporal sequence. However, this is not what we observed. We compared the 2-frames-conc and the direct 2-frames method, considering the temporal sequences Q1 and Q2 as input. The 2-frames-conc method gives better results, with an average improvement of 21.3% compared to the direct 2-frames method. For the aluminum foam, an improvement of 18.7% was measured. The registrations of both datasets, therefore, benefit from the increased amount of information given as input.
6 Conclusion
In this study we added an extra regularization term that enforces consistency and thereby improves the quality of the registration.
Unlike other methods already present in literature, our method does not impose constraints based on the nature of the motion: the motion does not have to be cyclic or linear. This is a substantial advantage because it enables the use of the proposed method for a wide set of applications, regardless of the dynamic of the sample. Even if the images are acquired during a dynamic experiment, and therefore severe motion artefacts are present, the multi-frame DVC has higher performance compared to the concatenated 2-frames method. The presented method, therefore, represents a valuable tool to be used in experiments where high-speed dynamic behavior of materials needs to be analyzed. More in general, thanks to the constraint of self-consistency, such a method has overcome the issues related to the registration of images with structures that change appearance through time, and it opens, therefore, the possibility to register material during chemical processes.
Data availability statement
The data analyzed in this study is subject to the following licenses/restrictions: The datasets are not publicly available. Requests to access these datasets should be directed to Tescan-XRE, https://www.tescan-orsay.com/applications/tescan-xre, Niloofar M. Goudarzi, bmlsb29mYXIuZ291ZGFyemlAdWdlbnQuYmU=.
Author contributions
ZM, conceptualization, methodology, validation, formal analysis, investigation, resources, writing-original draft, visualization; WG, conceptualization, data curation, and writing-review and editing; NG: resources, data curation, and writing-review and editing; MB, conceptualization, methodology, writing-review and editing, and supervision; AS, data-acquisition; CV, data acquisition; WP, resources, supervision; JA, conceptualization, methodology, resources, writing-review and editing, supervision, and project administration.
Funding
This research was funded by the Research Foundation—Flanders in the Strategic Basic Research Program MoCCha-CT (S003418N) and the Junior Research Project program (3G036518). Ghent University Special Research Fund (BOF.24Y.2018.0007) and Interreg Vlaanderen-Nederland project Smart Light.
Acknowledgments
We thank Tescan-XRE for providing the aluminum foam dataset.
Conflict of interest
The authors declare that the research was conducted in the absence of any commercial or financial relationships that could be construed as a potential conflict of interest.
Publisher’s note
All claims expressed in this article are solely those of the authors and do not necessarily represent those of their affiliated organizations, or those of the publisher, the editors, and the reviewers. Any product that may be evaluated in this article, or claim that may be made by its manufacturer, is not guaranteed or endorsed by the publisher.
References
Aganj, I., Iglesias, J. E., Reuter, M., Sabuncu, M. R., and Fischl, B. (2017). Mid-space-independent deformable image registration. Neuroimage 152, 158–170.
Bae, H., Jang, K., and An, Y.-K. (2021). Deep super resolution crack network (srcnet) for improving computer vision–based automated crack detectability in in situ bridges. Struct. Health Monit. 20, 1428–1442. doi:10.1177/1475921720917227
Bay, B. K., Smith, T. S., Fyhrie, D. P., and Saad, M. (1999). Digital volume correlation: Three-dimensional strain mapping using x-ray tomography. Exp. Mech. 39, 217–226. doi:10.1007/bf02323555
Bezdek, J. C., and Hathaway, R. J. (2003). Convergence of alternating optimization. Neural, Parallel & Sci. Comput. 11, 351–368. doi:10.5555/964885.964886
Broyden, C. G. (1970). The convergence of a class of double-rank minimization algorithms 1. general considerations. IMA J. Appl. Math. 6, 76–90. doi:10.1093/imamat/6.1.76
Bruck, H., McNeill, S., Sutton, M. A., and Peters, W. (1989). Digital image correlation using Newton-raphson method of partial differential correction. Exp. Mech. 29, 261–267. doi:10.1007/bf02321405
Clifford, C. W., and Langley, K. (2000). Recursive implementations of temporal filters for image motion computation. Biol. Cybern. 82, 383–390. doi:10.1007/s004220050592
Cofaru, C., Philips, W., and Van Paepegem, W. (2012). A three-frame digital image correlation (dic) method for the measurement of small displacements and strains. Meas. Sci. Technol. 23, 105406. doi:10.1088/0957-0233/23/10/105406
De Schryver, T., Dierick, M., Heyndrickx, M., Van Stappen, J., Boone, M. A., Van Hoorebeke, L., et al. (2018). Motion compensated micro-ct reconstruction for in-situ analysis of dynamic processes. Sci. Rep. 8, 7655. doi:10.1038/s41598-018-25916-5
Dierick, M., Van Loo, D., Masschaele, B., Van den Bulcke, J., Van Acker, J., Cnudde, V., et al. (2014). “Recent micro-ct scanner developments at ugct,” in Nuclear instruments and methods in physics research section B: Beam interactions with materials and atoms. Amsterdam: Elsevier, 324, 35–40. doi:10.1016/j.nimb.2013.10.051
Fejes, S., and Davis, L. S. (1999). Detection of independent motion using directional motion estimation. Comput. Vis. Image Underst. 74, 101–120. doi:10.1006/cviu.1999.0751
Fleet, D. J., and Langley, K. (1995). Recursive filters for optical flow. IEEE Trans. Pattern Anal. Mach. Intell. 17, 61–67. doi:10.1109/34.368151
Fletcher, R. (1970). A new approach to variable metric algorithms. Comput. J. 13, 317–322. doi:10.1093/comjnl/13.3.317
Garg, R., Roussos, A., and Agapito, L. (2013). A variational approach to video registration with subspace constraints. Int. J. Comput. Vis. 104, 286–314. doi:10.1007/s11263-012-0607-7
Geng, X., Christensen, G. E., Gu, H., Ross, T. J., and Yang, Y. (2009). Implicit reference-based group-wise image registration and its application to structural and functional mri. Neuroimage 47, 1341–1351. doi:10.1016/j.neuroimage.2009.04.024
Goldfarb, D. (1970). A family of variable-metric methods derived by variational means. Math. Comput. 24, 23–26. doi:10.1090/s0025-5718-1970-0258249-6
Guyader, J.-M., Huizinga, W., Poot, D. H., van Kranenburg, M., Uitterdijk, A., Niessen, W. J., et al. (2018). Groupwise image registration based on a total correlation dissimilarity measure for quantitative mri and dynamic imaging data. Sci. Rep. 8, 13112–13114. doi:10.1038/s41598-018-31474-7
Héas, P., and Mémin, E. (2008). Three-dimensional motion estimation of atmospheric layers from image sequences. IEEE Trans. Geosci. Remote Sens. 46, 2385–2396. doi:10.1109/tgrs.2008.918167
Huang, T. S., and Tsai, R. (1981). “Image sequence analysis: Motion estimation,” in Image sequence analysis (Berlin, Heidelberg: Springer), 1–18.
Huizinga, W., Poot, D. H., Guyader, J.-M., Klaassen, R., Coolen, B. F., van Kranenburg, M., et al. (2016). Pca-based groupwise image registration for quantitative mri. Med. image Anal. 29, 65–78. doi:10.1016/j.media.2015.12.004
Irani, M. (2002). Multi-frame correspondence estimation using subspace constraints. Int. J. Comput. Vis.. Berlin, Heidelberg: Springer 48, 173–194. doi:10.1023/a:1016372015744
Irani, M., Rousso, B., and Peleg, S. (1992). “Detecting and tracking multiple moving objects using temporal integration,” in European conference on computer vision (Springer), 282–287.
Jo, B.-W., Lee, Y.-S., Jo, J. H., and Khan, R. M. A. (2018). Computer vision-based bridge displacement measurements using rotation-invariant image processing technique. Sustainability 10, 1785. doi:10.3390/su10061785
Kovacic, S., and Bajcsy, R. (1998). “Multiscale/multiresolution representations,” in Brain warping. Editor W. Toga. San Diego, CA: Academic Press, 45–65.
Metz, C. T., Klein, S., Schaap, M., van Walsum, T., and Niessen, W. J. (2011). Nonrigid registration of dynamic medical imaging data using nD+ t B-splines and a groupwise optimization approach. Med. Image Anal. 15 (2), 238–249.
Ngeljaratan, L., and Moustafa, M. A. (2020). Structural health monitoring and seismic response assessment of bridge structures using target-tracking digital image correlation. Eng. Struct. 213, 110551. doi:10.1016/j.engstruct.2020.110551
Park, H., Bland, P. H., Hero, A. O., and Meyer, C. R. (2005). “Least biased target selection in probabilistic atlas construction,” in International conference on medical image computing and computer-assisted intervention (Berlin, Heidelberg: Springer), 419–426.
Powierza, B., Gollwitzer, C., Wolgast, D., Staude, A., and Bruno, G. (2019). Fully experiment-based evaluation of few digital volume correlation techniques. Rev. Sci. Instrum. 90, 115105. doi:10.1063/1.5099572
Qin, C., Bai, W., Schlemper, J., Petersen, S. E., Piechnik, S. K., Neubauer, S., et al. (2018). “Joint learning of motion estimation and segmentation for cardiac mr image sequences,” in International conference on medical image computing and computer-assisted intervention (Berlin, Heidelberg: Springer), 472–480.
Ricco, S., and Tomasi, C. (2012). “Dense Lagrangian motion estimation with occlusions,” in 2012 IEEE Conference on Computer Vision and Pattern Recognition, Providence, RI, USA, 16-21 June 2012 (Piscataway,NJ: IEEE), 1800–1807.
Rueckert, D., Sonoda, L. I., Hayes, C., Hill, D. L., Leach, M. O., and Hawkes, D. J. (1999). Nonrigid registration using free-form deformations: Application to breast mr images. IEEE Trans. Med. Imaging 18, 712–721. doi:10.1109/42.796284
Seghers, D., D’Agostino, E., Maes, F., Vandermeulen, D., and Suetens, P. (2004). “Construction of a brain template from mr images using state-of-the-art registration and segmentation techniques,” in International conference on medical image computing and computer-assisted intervention (Berlin, Heidelberg: Springer), 696–703.
Shanno, D. F. (1970). Conditioning of quasi-Newton methods for function minimization. Math. Comput. 24, 647–656. doi:10.1090/s0025-5718-1970-0274029-x
Stiller, C., and Konrad, J. (1999). Estimating motion in image sequences. IEEE Signal Process. Mag. 16, 70–91. doi:10.1109/79.774934
Sundaram, N., Brox, T., and Keutzer, K. (2010). “Dense point trajectories by gpu-accelerated large displacement optical flow,” in European conference on computer vision (Berlin, Heidelberg: Springer), 438–451.
Szeliski, R., and Coughlan, J. (1997). Spline-based image registration. Int. J. Comput. Vis. 22, 199–218. doi:10.1023/a:1007996332012
Thirion, J.-P. (1995). Fast non-rigid matching of 3D medical images (Valbonne: Sophia-Antipolis). Ph.D. thesis.
Tustison, N. J., Avants, B. B., and Gee, J. C. (2009). Directly manipulated free-form deformation image registration. IEEE Trans. Image Process. 18, 624–635. doi:10.1109/tip.2008.2010072
Vlassenbroeck, J., Dierick, M., Masschaele, B., Cnudde, V., Van Hoorebeke, L., and Jacobs, P. (2007). “Software tools for quantification of x-ray microtomography at the ugct,” in Nuclear instruments and methods in physics research section A: Accelerators, spectrometers, detectors and associated equipment. Amsterdam: Elsevier, 580, 442–445. doi:10.1016/j.nima.2007.05.073
Wani, Z. R., Tantray, M., and Farsangi, E. N. (2022). In-plane measurements using a novel streamed digital image correlation for shake table test of steel structures controlled with mr dampers. Eng. Struct. 256, 113998. doi:10.1016/j.engstruct.2022.113998
Wu, G., Jia, H., Wang, Q., Shi, F., Yap, P.-T., and Shen, D. (2012). “Emergence of groupwise registration in mr brain study,” in Biosignal processing: Principles and practices. Pennsylvania: The Pennsylvania State University, CiteseerX, 43.
Wu, M., Li, X., Liu, C., Liu, M., Zhao, N., Wang, J., et al. (2019). Robust global motion estimation for video security based on improved k-means clustering. J. Ambient. Intell. Humaniz. Comput. 10, 439–448. doi:10.1007/s12652-017-0660-8
Xie, Z., and Farin, G. E. (2004). Image registration using hierarchical b-splines. IEEE Trans. Vis. Comput. Graph. 10, 85–94. doi:10.1109/tvcg.2004.1260760
Zona, A. (2020). Vision-based vibration monitoring of structures and infrastructures: An overview of recent applications. Infrastructures 6, 4. doi:10.3390/infrastructures6010004
Keywords: digital volume correlation (DVC), multi-frame, temporal image sequence, motion artefacts, dynamic experiments
Citation: Manigrasso Z, Goethals W, Goudarzi NM, Boone MN, Samaro A, Vervaet C, Philips W and Aelterman J (2022) Multi-frame DVC for temporal image sequences. Front. Mater. 9:998311. doi: 10.3389/fmats.2022.998311
Received: 19 July 2022; Accepted: 15 August 2022;
Published: 13 October 2022.
Edited by:
M. K. Samal, Bhabha Atomic Research Centre (BARC), IndiaReviewed by:
Zubair Wani, Indian Institute of Science (IISc), IndiaDong Lei, College of Mechanics and Materials, Hohai University, China
Copyright © 2022 Manigrasso, Goethals, Goudarzi, Boone, Samaro, Vervaet, Philips and Aelterman. This is an open-access article distributed under the terms of the Creative Commons Attribution License (CC BY). The use, distribution or reproduction in other forums is permitted, provided the original author(s) and the copyright owner(s) are credited and that the original publication in this journal is cited, in accordance with accepted academic practice. No use, distribution or reproduction is permitted which does not comply with these terms.
*Correspondence: Zaira Manigrasso, emFpcmEubWFuaWdyYXNzb0B1Z2VudC5iZQ==