 Jihong Lian1
 Xiaowei Cheng
- 1CNOOC International Limited, Beijing, China
- 2CNOOC Research Institute Co. Ltd., Beijing, China
- 3China National Petroleum Corporation Southwest Oil and Gas Field Branch Exploration Division, Chengdu, China
- 4School of New Energy and Materials, Southwest Petroleum University, Chengdu, China
- 5State Key Laboratory of Oil & Gas Reservoir Geology and Exploitation, Southwest Petroleum University, Chengdu, China
Under the engineering background of the carbon dioxide capture and geological storage technology (CCUS) cementing project, an experiment on the generation of cement single-phase tricalcium silicate CO2 carbonization products were carried out. Combining the phase diffraction pattern data and the thermogravimetric experiment, a relative crystallinity algorithm is proposed, which combines the quantitative results of the carbonized products with the relative crystallinity (RCP) results of each component. The growth and development mechanism of tricalcium silicate carbide crystal products under high temperature, high pressure and high concentration CO2 environment is deduced. The experimental results show that under the conditions of early gas phase carbonization, the carbonization rate of C3S first increases and then decreases as the carbonized crystal product grows. Under the conditions of early liquid phase carbonization, the carbonization rate of C3S first decreases and then increases with the generation and fragmentation of the hydration barrier layer. It provides a research basis and a new perspective for the subsequent analysis of the changes in the microstructure of the cement paste in the carbonization process under the CCUS engineering background.
1 Introduction
The continuous consumption of fossil energy has led to a continuous increase in man-made CO2 emissions. The International Energy Agency (IEA) predicts that by 2035, global CO2 emissions will reach 35.4 billion tons (Chang et al., 2012). In the past 10 years, in order to effectively alleviate greenhouse gas emissions, carbon dioxide capture and geological storage technology has become the main way to reduce CO2 emissions and the greenhouse effect, and has received more and more attention (Bachu, 2008; Gleick et al., 2010; Leung et al., 2014). Portland cement is usually used in CCUS cementing projects (Kutchko et al., 2008; Duguid, 2009; Brandão et al., 2017). Cementing involves injecting cement slurry into the annulus between the casing and the formation, or between successive casings, and waiting for it to solidify to form cement paste to shield and seal the formation fluid. However, the cement-based materials in the well need to withstand the harsh service conditions of high temperature, high pressure, and high CO2 concentration. Under such harsh conditions, cement-based materials will be in a process of accelerating carbonation. The formation of carbonized products and the growth and dissolution of crystals will cause changes in the pore structure of the cement matrix, and ultimately lead to cement performance failure (Groves et al., 1991; Dong et al., 2019). This will extremely seriously affect the integrity and safety of the long-term seal of the carbon dioxide storage technology. Therefore, it is necessary to conduct in-depth research on the carbonization mechanism of cement in the strongly acidic downhole environment to accurately predict the carbonization failure process of cement and provide a basis for the research and development of acid-resistant cement.
Portland cement mainly contains four single-phases: tricalcium silicate (C3S), dicalcium silicate (C2S), tricalcium aluminate (C3A), and tetracalcium aluminoferrite (C4AF) (Tadros et al., 1976; Sánchez Herrero et al., 2016; Cuesta et al., 2018). According to the American Petroleum Institute (API) standard, it can be known that C3S is the main mineral component (50%–80%) in common oil well cement (G-class/H-class) (Sorrentino, 2008). In addition, the hydration and carbonization reaction of C3S determines the development of the microstructure and structural strength of the cement paste (Groves et al., 1991; Mei et al., 2018). Therefore, to accurately predict the carbonization failure process of cement paste, it can be start with the single-phase tricalcium silicate, which has the greatest impact on the strength development of Portland cement (Kjellsen and Justnes, 2004). In the current research on the carbide carbonization process of tricalcium silicate, through conventional qualitative analysis (transmission electron microscope combined energy spectrometer (TEM-EDS), X-ray diffraction (XRD) and 29Si magic angle rotating nuclear magnetic resonance (29Si MAS) -NMR). It has been proved that the product of fully carbonated C3S is amorphous silicon dioxide (SiO2) and calcite crystals and there will be no other polymorphic calcium carbonate (CaCO3) (Li et al., 2018). In addition, a variety of technical methods (Rietveld refinement, thermogravimetric analysis, Fourier transform infrared spectroscopy, field emission scanning electron microscope and micro-Raman spectroscopy) have been used to study the growth process of calcite crystals produced after tricalcium silicate carbonization from the aspects of crystallite size, particle size, chemical bonds and thermodynamic stability (Wang et al., 2020; Klimavicius et al., 2021). Through these qualitative analyses, it can be known that the growth of calcite crystals formed by the carbonization of tricalcium silicate has a great influence on the strength of cement.
These existing studies focus on the qualitative analysis of the carbonization products of tricalcium silicate and the effect of the microstructure after complete carbonization on the changes in the macroscopic mechanical strength properties. However, the crystal growth of the carbonized product during the carbonization process of tricalcium silicate in a high-concentration CO2 environment will seriously affect the development of its internal microstructure and macro-mechanical strength of cement. Due to insufficient research on the crystallization laws of single-phase cement crystal products after CO2 carbonization, there is insufficient understanding of the changes in the microstructure of cement after CO2 carbonization. There are few studies on the orientation of the cement crystal phase after CO2 carbonization, or the crystallization and crystal transformation laws in the long-term carbonization process, and there is no quantitative or semi-quantitative method to describe the growth process of carbonized crystalline products. In this paper, according to the crystal change law of single-phase cement during CO2 carbonization, the C3S hydration products and carbonization products were analyzed by X-ray diffraction (XRD) analysis, and the relative crystallinity was introduced according to the experimental results for semi-quantitative analysis. The changes of amorphous products during the hydration and carbonization of C3S were investigated by thermogravimetric (TG/DTG) analysis, and the relative crystallinity change law of C3S single-phase cement CO2 carbonization crystal products was studied. It is expected to provide new ideas and research basis for the study of microstructure changes caused by crystal changes.
2 Materials and methods
2.1 Materials
C3S single-phase cement powder was provided by Mineral Research Processing (M.R. PRO, France).
2.2 Experiment methods
The water-cement ratio provided by the API standard is 0.38–0.44. The effect of the water-cement ratio on cement particle hydration was mainly reflected in the cement particle spacing and in the final degree of hydration reaction, owing to the rapid hydration of the single phase, in order to ensure that the sample has a certain fluidity for moulding, a water-cement ratio of 0.6 was selected to prepare single-phase cement samples with different carbonization time intervals at 90°C (Mei et al., 2018).
In general oil and gas well conditions, the corrosive medium CO2 usually exists in two states: one is in the form of a solute dissolved in formation water, and the other is in the form of supercritical gaseous CO2 in a humid environment. To study the influence of these two different water-humidity environments on the carbonation process of the samples, the prepared samples were placed in a high-temperature and high-pressure carbonation reactor, as shown in Figure 1. The upper sample is in a gas-phase environment as a dry gas carbonization environment, and the lower sample is in a liquid phase environment as an acid solution environment. CO2 gas with high pressure of 5.0 MPa (3.0 MPa for air and 8.0 MPa for total pressure) was injected to ensure saturation conditions, thereby simulating the underground environment (Mei et al., 2021).
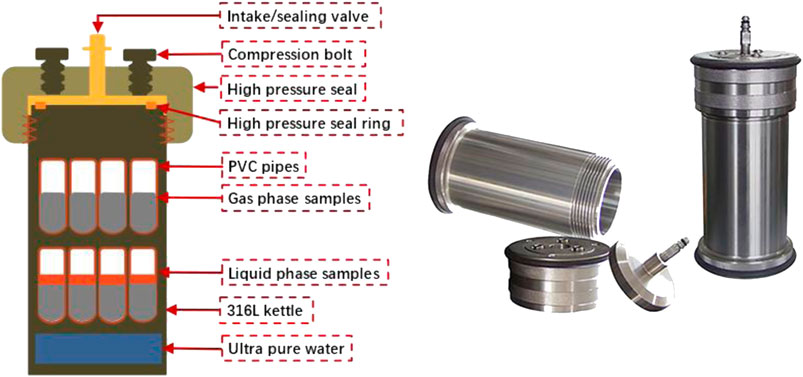
FIGURE 1. Photograph and schematic representation of HTHP carbonation kettle and sample loading.
During the experiment, load the prepared single-phase cement slurry into the kettle body, the assembled kettle body was immersed in a constant-temperature water-bath curing box to maintain the experimental temperature of the sample. The single-ore cement carbonization curing environment, temperature, and age are listed in Table 1. The selection of experimental temperature conditions is based on the formation depth-temperature relationship to simulate the temperature conditions under common well depth environments.
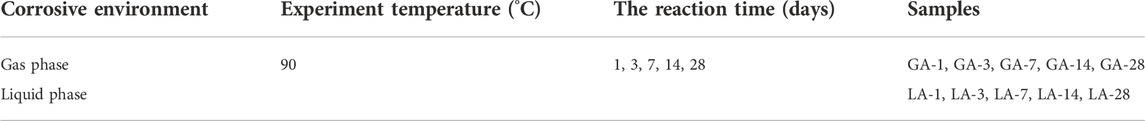
TABLE 1. Experimental conditions of the sample.
2.3 Characterization
To evaluate the carbonization products of the CO2 carbonized samples in the early stage of the experiment and the microstructure changes after carbonization, the reaction of the samples was stopped by soaking them in isopropanol. The immersion time of the carbonized sample was defined as from the completion of the carbonization corrosion experiment to immediately before the inspection, and the following tests were carried out:
1) Grind all CO2 carbonized samples (hand-grind with a grinder), and then use an X-ray diffractometer for phase analysis. The equipment model is DXJ-2000, and the place of production is China’s Fangyuan Instrument Co., Ltd. When the equipment is performing phase analysis, the current is 20 mA and the voltage is 30 kV. The sample passes in 2θ at a rate of 0.04°/s in the range of 5°–70°.
2) A Thermogravimetric analysis (DTG) (TGA/SDTA851e, Mettler Toledo, Switzerland, TA Q20) was carried out to quantitatively investigate the carbonation products over a temperature range of 40°C–1,000°C at a heating rate of 10°C/min. Additionally, the powder samples were tested using nitrogen gas as the working gas.
3 Results and discussion
3.1 Material property
The X-ray diffraction (XRD) peaks of these experiments with the standard powder diffraction pattern (PDF# 49-0442) are consistent with Figure 2. The particle size distribution of the powder was measured using a laser particle size analyser (Mastersizer 2000; Malvern Panalytical, United Kingdom), and its main physical properties are shown in Figure 3. The particle size was mainly concentrated in the range of 1–100 μm, the specific surface area was 1.09 m2/g, and the median size was 6.365 μm.
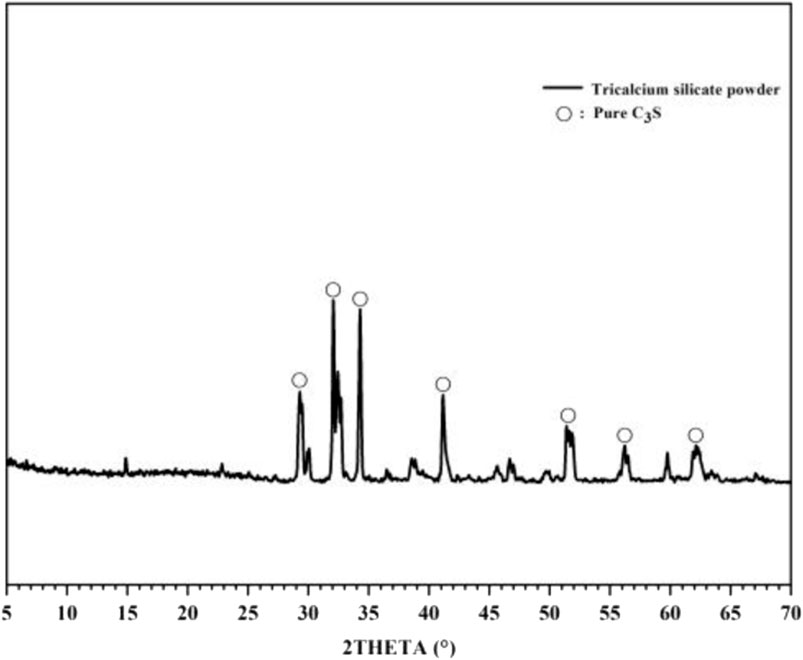
FIGURE 2. XRD results of experimental powders and main crystal faces.
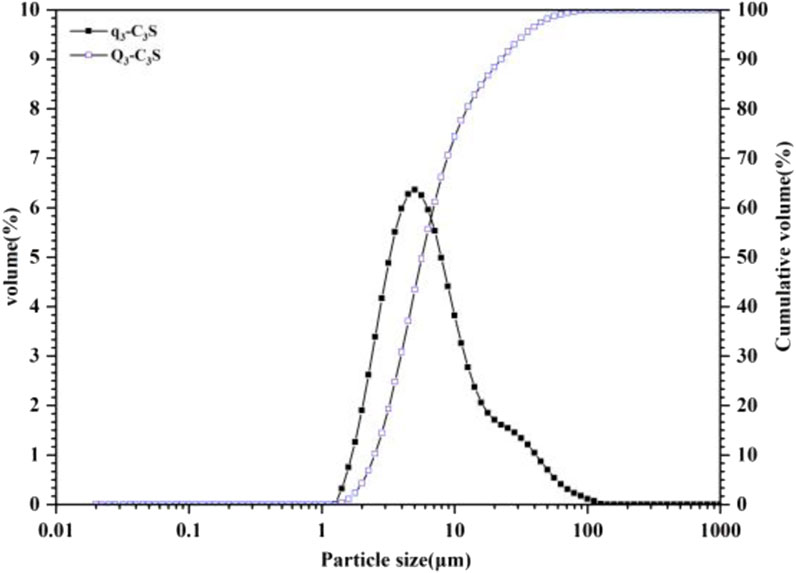
FIGURE 3. Particle size distribution of C3S single-phase raw materials.
3.2 Phase analysis
For the XRD diffractograms shown in Figure 4, carbonation C3S samples (GA-1, 3, 7, 14, 28 and LA-1, 3, 7, 14, 28) with different curing times under liquid and gas phase carbonization conditions (CH: #44-1,481 and Calcite: #47-1743). It can be seen from the figure that calcite CaCO3 (abbreviated as C
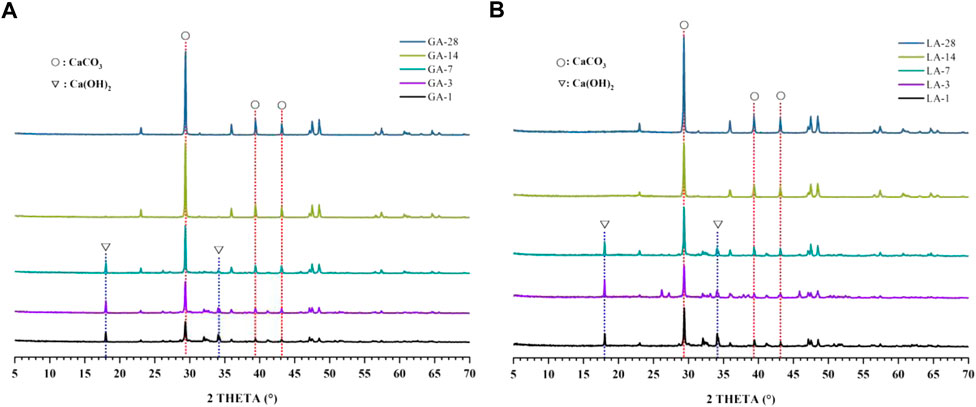
FIGURE 4. (A). XRD pattern of the GA-1, 3, 7, 14, 28 samples; (B). XRD pattern of the LA-1, 3, 7, 14, 28 samples.
The amorphous gel phase calcium silicate hydrate (abbreviated as C-S-H) is one of the products of cement hydration process, but the XRD test cannot effectively characterize the amorphous gel phase. Therefore, it is necessary to combine the decomposition temperature of the phase at different temperatures to characterize the phase, where 400°C–500°C is the decomposition interval of the hydration product CH, and 600°C–900°C is the decomposition interval of the CO2 carbonization product (Gomez-Villalba et al., 2012). The decomposition temperature range and decomposition stage of single-phase C3S cement hydration and carbonization products are shown in Table 2.
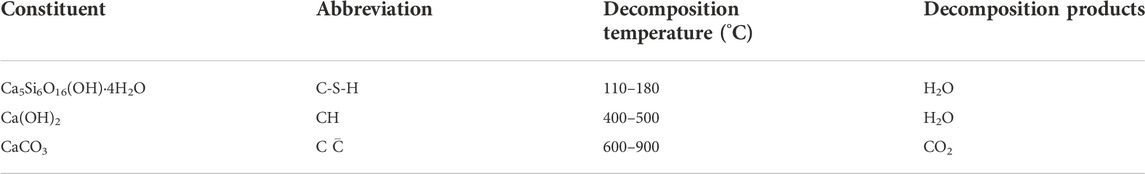
TABLE 2. Decomposition temperature range and decomposition phases in C3S carbonization samples of single-phase cement.
The quality loss in the range of 120°C and 460°C are produced by the decomposition of C-S-H and CH, respectively. At the same time, the CH produced by C3S hydration is consumed in large quantities due to the carbonization reaction, and a large amount of CaCO3 is produced. The quality loss in the range of 750°C is produced by C
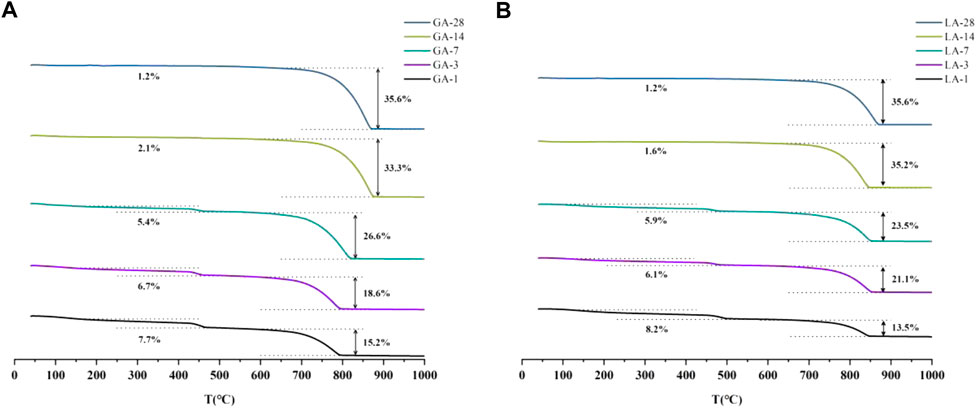
FIGURE 5. (A) TG diagram of GA-1, 3, 7, 14, 28 samples; (B) TG diagram of LA-1, 3, 7, 14, 28 samples.
3.3 Relative crystallinity analysis
The main product after full hydration reaction of tricalcium silicate is composed of gel phase C-S-H and CH phase with different crystallinity (Cuesta et al., 2018). These hydration products are carbonized under the conditions of high concentration of carbon dioxide. The carbonized crystal products produced by the carbonization reaction will have a significant impact on the structure of the tricalcium silicate single-phase cement slurry. Therefore, studying the dependence of crystalline hydration products on carbonized crystalline products can enable people to understand the properties of cement paste structure carbonization corrosion damage. After long-term carbonization, the hydration products of cement continue to decrease, and the carbonization products continue to increase. In order to explore the changes in the crystallization law of the product crystals during the CO2 carbonization process, the relative crystallinity can be introduced to conduct a semi-quantitative analysis of the development process of the carbonized crystallization products, so as to compare the crystal phases in the C3S carbonization reaction products of cement single phase and determine the law.
By measuring the cumulative diffraction intensity of the crystalline phases, a semi-quantitative analysis of the crystallinity changes of the phases was carried out, and the law of changes in the crystal structure was obtained (Dai et al., 2017; Dai et al., 2018). The crystallization process of tricalcium silicate carbonized products is related to the carbonization environment temperature and carbonization age. With regard to the phase growth process of the crystalline product, there is no perfect crystal owing to the influence of the external environment. Therefore, the crystallinity mentioned in this article is all relative crystallinity (Capron et al., 1987; Kontoyannis and Vagenas, 2000; Lee et al., 2008; Jiang et al., 2018), where the relative crystallinity is related to the crystallinity of the reference phase taken. The crystallinity of the phase is represented by the main diffraction peak area, I, corresponding to the object in the diffraction test result. The relative crystallinity of a single crystalline phase relative to all crystalline phases in the sample (RCS) and relative crystallinity of the phase (RCP) of a single carbonized crystalline phase under certain curing conditions were used to understand the crystal change process of carbonization products in a single cement phase. The calculation process of the RCS and RCP of the crystalline phase is shown in Eqs 1–4.
In-phase is the peak area of the n-phase diffraction peak corresponding to a certain phase; ISUM-phase is the sum of the integrated areas of the three strongest peaks in the diffraction peak of a certain phase, and ISUM is the sum of the integrated area of the diffraction peaks of the crystal phase in a certain sample. RCP = 100% indicates the maximum integral area of the diffraction peak of hydration or carbonization products during the carbonization age. This suggests that the crystal structure of the crystalline phase in the sample is relatively complete. Jade software (version 6.0) was used to subtract the background peaks of the amorphous phase in the test results, fit each peak of the main crystalline product to obtain the three characteristic peaks with the strongest phase intensity, and calculate the integral area. The RCS and RCP values of the crystalline phase were calculated using Eqs 1–4, and the specific sample analysis results are as follows.
3.3.1 Analysis of relative crystallinity change under gas phase carbonization
The phases of C3S after gas-phase carbonization at 90°C are shown in Figure 4A. The main hydration and carbonization phases were CH and C
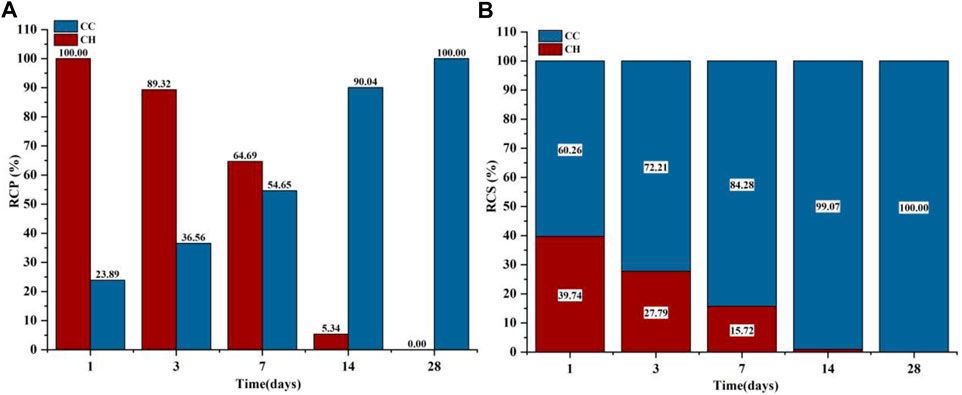
FIGURE 6. GA-1,3,7,14,28 Samples: (A) Carbonized crystalline product RCP; (B) Carbonized crystalline product RCS.
Because both the CO2 carbonization and hydration processes react with Ca2+ to produce the corresponding products, the sum of the C
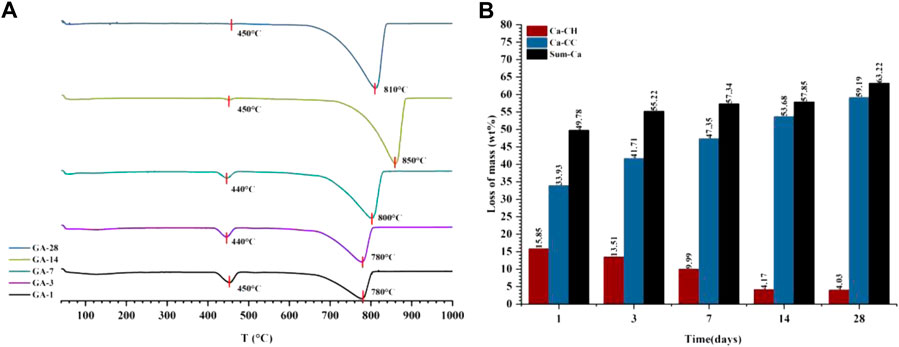
FIGURE 7. The DTG curve (A) and the content of each component in the quantitative tests of CO2 carbonization products (B) of the gas phase carbonization sample (GA-1, 3, 7, 14, 28).
3.3.2 Analysis of relative crystallinity change under liquid phase carbonization
Figure 4B shows the XRD test results of the liquid-phase carbonized sample and the RCP and RCS results of the crystalline product. The phases contained in the C3S liquid-phase carbonization sample at 90°C are mainly CH and C
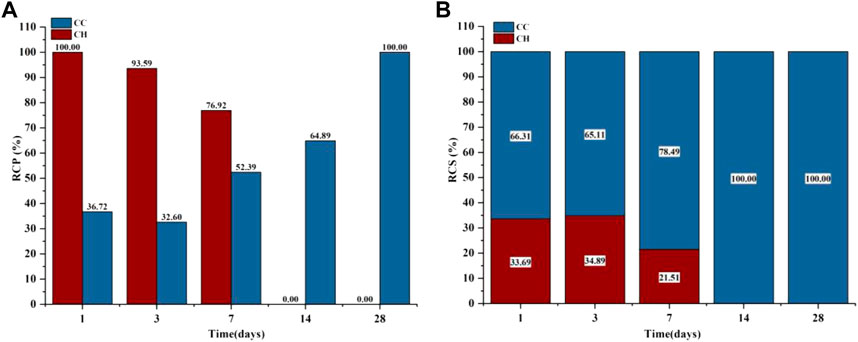
FIGURE 8. LA-1, 3, 7, 14, 28 samples: (A) Carbonized crystalline product RCP; (B) Carbonized crystalline product RCS.
Combining the results of thermogravimetric analysis to verify the carbonization law shown by the relative crystallinity is shown in Figure 9. The hydration product CH was at a maximum of 15.41% at 1 day, and then continued to decrease to only 3.69% at 28 days, so the decomposition peak of CH on the DTG curve disappeared. For C
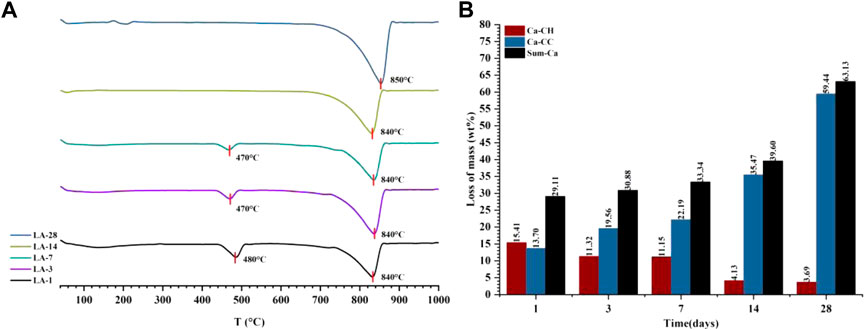
FIGURE 9. The DTG curve (A) and the content of each component in the quantitative test of CO2 carbonization products (B) of the liquid phase carbonization sample (LA-1, 3, 7, 14, 28).
3.4 Analysis of carbonization product crystal change process
The foregoing is the law of influence on the crystal products formed in the CO2 carbonization reaction of C3S mono-ore cement under different corrosive environments, including CH generated by the hydration reaction. Among the carbonization products, C
The main crystalline phase of C3S formed by CO2 carbonization is C
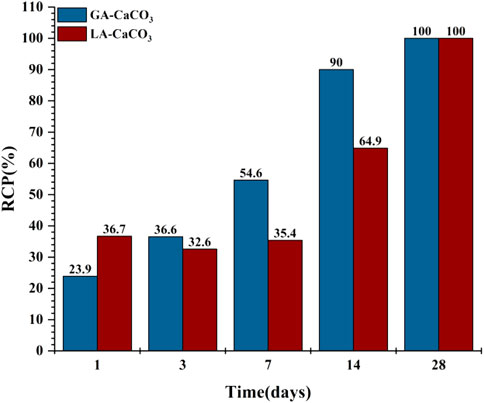
FIGURE 10. RCP variation law of the carbonization crystallization product C
In the liquid phase CO2 carbonization environment, the RCP value of the carbonization products decreased from 1 to 3 days, then the liquid phase carbonization reaction speed continued to increase. Combined with the quantitative results, the hydration products at this stage increased, indicating that delayed hydration destroys the integrity of the carbonization product crystals, resulting in a decrease in the RCP. According to previous studies (Goodbrake et al., 1979), this is due to the faster hydration of C3S in the liquid phase environment, and more CH phase and C-S-H are formed at the beginning of the carbonization reaction. In the subsequent reaction, the presence of a large amount of free Ca2+ during the hydration process is conducive to the reaction with CO32−. It can still form a stable carbonization product even in an environment with a higher concentration of CO2, and there are only C
For C-S-H, although the gel phase does not have a fixed molecular formula, many studies (Rostami et al., 2012; Morandeau et al., 2014; Shen et al., 2016) have shown that as C-S-H is corroded by CO2, when the amount of C-S-H is small, the volume of C-S-H will increase, and the volume effect of C-S-H accounts for 70% of the total volume change. When the amount of C-S-H is large, the volume of C-S-H decreases after carbonization, resulting in sample shrinkage. Combined with the previous quantitative analysis of the reaction products, the amount of C-S-H is relatively low; when it is corroded by CO2, it is mainly due to volume expansion, and a hydration barrier layer (the reduction of porosity and the dense growth of CHS under the early liquid phase environment carbonization) is formed on the surface of the cement paste to slow down the carbonization process. Numerous studies (Fabbri et al., 2012; Cheshire et al., 2017; Jimoh et al., 2018; Shah et al., 2018) have shown that the change in pore structure affects the penetration process of the CO2 corrosive medium to a certain extent, thus delaying the carbonization process. Therefore, the RCP value of vapour-phase carbonization at 14 days is much larger than that of liquid-phase carbonization. In summary, the entire CO2 cement single-ore carbonization process (Mei et al., 2018) is shown in the model in Figure 11.
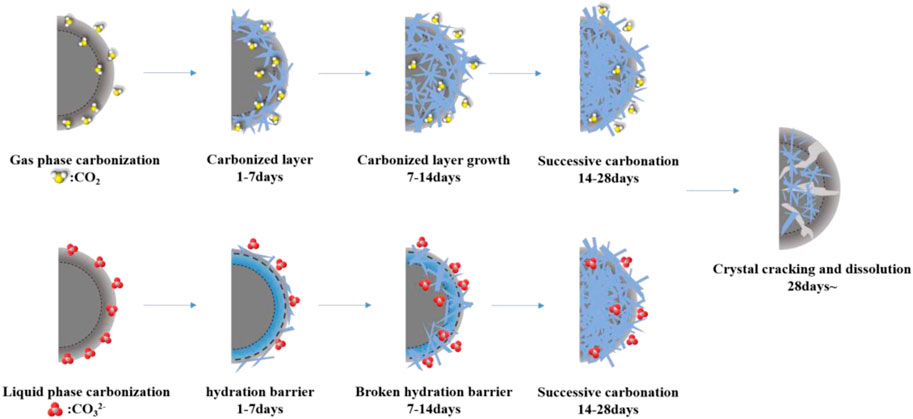
FIGURE 11. Schematic diagram of CO2 carbonization process of C3S single-phase cement.
4 Conclusion
In this study, XRD and relative crystallinity algorithms were used to analyse and study the relative crystallinity change law of C3S single-phase cement during CO2 carbonization. The main conclusions are as follows.
1) Compared with gas phase carbonization, the formation rate of liquid phase carbonization crystallization products is slower. The increase of carbonization time will accelerate the formation of crystallization products. For subsequent cement failure, the liquid phase environment is more dangerous.
2) Under the assumption that all carbonization products are crystals, the quantitative results of the carbonization products and the relative crystallinity (RCS) results of the components are combined to deduce the crystal change process of the carbonization products during the CO2 carbonization process. Supported by previous research results, this semi-analytical method is feasible and more intuitive. In the CCUS well condition, the carbonization products of cement will dissolve in the later stage, and the development trend of the later carbonization products can be predicted by the calculation results of the relative crystallinity.
3) The method of calculating relative crystallinity combined with thermogravimetric analysis can realize semi-quantitative analysis of the pre-development process of carbonized product crystals in the process of tricalcium silicate carbonization. The effect of this analysis method is intuitive, it provides a good analysis method to explore the evolution process of the crystal growth of carbonized corrosion products.
The above results provide a research basis for analysing the microstructural changes in cement paste caused by CO2 carbonization and provides a new analysis perspective of XRD combined with relative crystallinity algorithm for carbonization research.
Data availability statement
The raw data supporting the conclusion of this article will be made available by the authors, without undue reservation.
Author contributions
JL: Conceptualization, investigation, writing-original draft, data curation ZW: Validation, resources, writing—review & editing, supervision. YL: Validation, formal analysis, investigation, data curation QG: Formal analysis, project administration KM: Formal analysis, project administration XC: Resources, funding acquisition JC: Methodology, conceptualization.
Funding
This study was financially supported by 111 Project, No. D18016. The Sichuan Science and Technology Program (2021YFQ0045 and 2021YFSY0056) and the Cnooc’s preliminary project: Feasibility study of Wenchang 9-7 oilfield (2021PFS-05).
Acknowledgments
The authors appreciate the support of the Sichuan Science and Technology Program (2021YFQ0045 and 2021YFSY0056) and the Cnooc’s preliminary project: Feasibility study of Wenchang 9-7 oilfield (2021PFS-05). The authors would also like to thank the Advanced Cementing Materials Research Center of SWPU for their kind assistance with the experiments.
Conflict of interest
JL was empolyed by the CNOOC International Limited, ZW was empolyed by CNOOC Research Institute Co. Ltd., and YL was empolyed by the China National Petroleum Corporation Southwest Oil and Gas Field Branch Exploration Division.
The remaining authors declare that the research was conducted in the absence of any commercial or financial relationships that could be construed as a potential conflict of interest.
Publisher’s note
All claims expressed in this article are solely those of the authors and do not necessarily represent those of their affiliated organizations, or those of the publisher, the editors and the reviewers. Any product that may be evaluated in this article, or claim that may be made by its manufacturer, is not guaranteed or endorsed by the publisher.
References
Bachu, S. (2008). CO2 storage in geological media: Role, means, status and barriers to deployment. Prog. Energy Combust. Sci. 34 (2), 254–273. No. doi:10.1016/j.pecs.2007.10.001
Brandão, N. B. A., Roehl, D. A. B., de Andrade Silva, F. B., and Rosas E Silva, R. B. (2017). The impact of cement slurry aging creep on the construction process of oil wells. J. Pet. Sci. Eng. 157, 422–429. doi:10.1016/j.petrol.2017.07.051
Capron, B., Girou, A., Humbert, L., and Puech-Costes, E. (1987). Experimental dissolution of natural calcite. II. A matrix optimized for study of the relative influence of carbon dioxide pressure, salinity, lithostatic pressure, granulometry, crystallinity, and flow rate. Bull. Soc. Chim. Fr.
Chang, Y., Lee, J., and Yoon, H. (2012). Alternative projection of the world energy consumption-in comparison with the 2010 international energy outlook. Energy Policy 50, 154–160. doi:10.1016/j.enpol.2012.07.059
Cheshire, M. C., Stack, A. G., Carey, J. W., Anovitz, L. M., Prisk, T. R., and Ilavsky, J. (2017). Wellbore cement porosity evolution in response to mineral alteration during CO2 flooding. Environ. Sci. Technol. 51 (1), 692–698. No. doi:10.1021/acs.est.6b03290
Cuesta, A., Zea-Garcia, J. D., Londono-Zuluaga, D., De la Torre, A. G., Santacruz, I., Vallcorba, O., et al. (2018). Multiscale understanding of tricalcium silicate hydration reactions. Sci. Rep. 8 (1), 8544. doi:10.1038/s41598-018-26943-y
Dai, Y., Zou, H., Zhu, H., Zhou, X., Song, Y., Shi, Z. S., et al. (2017). Controlled synthesis of calcite/vaterite/aragonite and their applications as red phosphors doped with Eu3+ ions. CRYSTENGCOMM 19 (20), 2758–2767. No. doi:10.1039/c7ce00375g
Dai, Y., Zou, H., Zhu, H., Zhou, X., Song, Y., Zheng, K., et al. (2018). Facile surfactant- and template-free synthesis and luminescence properties of needle-like calcite CaCO3:Eu3+ phosphors. CRYSTENGCOMM 20 (4), 496–504. No. doi:10.1039/c7ce01554b
Der, W. (2014). Calcite growth: Rate dependence on saturation, on ratios of dissolved calcium and (bi)carbonate and on their complexes(Article). J. Cryst. GROWTH 394, 137–144.
Dong, S., Berelson, W. M., Rollins, N. E., Subhas, A. V., Naviaux, J. D., Celestian, A. J., et al. (2019). Aragonite dissolution kinetics and calcite/aragonite ratios in sinking and suspended particles in the North Pacific. Earth Planet. Sci. Lett. 515, 1–12. doi:10.1016/j.epsl.2019.03.016
Duguid, A. (2009). An estimate of the time to degrade the cement sheath in a well exposed to carbonated brine. Energy Procedia 1 (1), 3181–3188. No. doi:10.1016/j.egypro.2009.02.101
Fabbri, A., Jacquemet, N., and Seyedi, D. M. (2012). A chemo-poromechanical model of oilwell cement carbonation under CO 2 geological storage conditions(Article). Cem. Concr. Res. 42 (1), 8–19. No. doi:10.1016/j.cemconres.2011.07.002
Gleick, P. H., Adams, R. M., Amasino, R. M., AndErs, E., Anderson, D. J., Anderson, W. W., et al. (2010). Climate change and the integrity of science. SCIENCE 2010 (5980), 689–690. No doi:10.1126/science.328.5979.689
Gomez-Villalba, L. S., Lopez-Arce, P., Alvarez De Buergo, M., and Fort, R. (2012). Atomic defects and their relationship to aragonite–calcite transformation in portlandite nanocrystal carbonation. Cryst. Growth Des. 12 (10), 4844–4852. No. doi:10.1021/cg300628m
Goodbrake, C. J., Young, J. F., and Berger, R. L. (1979). Reaction of hydraulic calcium silicates with carbon dioxide and water. J. Am. Ceram. Soc. 62 (9-10), 488–491. No.. doi:10.1111/j.1151-2916.1979.tb19112.x
Groves, G. W., Brough, A., Richardson, I. G., and Dobson, C. M. (1991). Progressive changes in the structure of hardened C3S cement pastes due to carbonation. J. Am. Ceram. Soc. 74 (11), 2891–2896. No. doi:10.1111/j.1151-2916.1991.tb06859.x
Jiang, J., Zheng, Q., Hou, D., Yan, Y., Chen, H., She, W., et al. (2018). Calcite crystallization in the cement system: Morphological diversity, growth mechanism and shape evolution. Phys. Chem. Chem. Phys. 20 (20), 14174–14181. No. doi:10.1039/c8cp01979g
Jimoh, O. A., Ariffin, K. S., Hussin, H. B., and Temitope, A. E. (2018). Synthesis of precipitated calcium carbonate: A review. Carbonates Evaporites 33 (2), 331–346. No. doi:10.1007/s13146-017-0341-x
Kjellsen, K. O., and Justnes, H. (2004). Revisiting the microstructure of hydrated tricalcium silicate––a comparison to Portland cement. Cem. Concr. Compos. 26 (8), 947–956. No. doi:10.1016/j.cemconcomp.2004.02.030
Klimavicius, V., Hilbig, H., Gutmann, T., and Buntkowsky, G. (2021). Direct observation of carbonate formation in partly hydrated tricalcium silicate by dynamic nuclear polarization enhanced NMR spectroscopy. J. Phys. Chem. C 125 (13), 7321–7328. No. doi:10.1021/acs.jpcc.0c10382
Kontoyannis, C. G., and Vagenas, N. V. (2000). Calcium carbonate phase analysis using XRD and FT-Raman spectroscopy. Analyst 125 (2), 251–255. No. doi:10.1039/a908609i
Kutchko, B. G., Strazisar, B. R., Dzombak, D. A., Lowry, G. V., and Thaulow, N. (2008). Degradation of well cement by CO2 under geologic sequestration conditions. Environ. Sci. Technol. 41 (13), 4787–4792. No. doi:10.1021/es062828c
Lee, M., Hodson, M., and Langworthy, G. (2008). Crystallization of calcite from amorphous calcium carbonate: Earthworms show the way. Mineral. Mag. 72 (1), 257–261. No. doi:10.1180/minmag.2008.072.1.257
Leung, D., Caramanna, G., and Maroto-Valer, M. (2014). An overview of current status of carbon dioxide capture and storage technologies. Renew. Sustain. Energy Rev. 39, 426–443. doi:10.1016/j.rser.2014.07.093
Li, Z., He, Z., and Shao, Y. (2018). Early age carbonation heat and products of tricalcium silicate paste subject to carbon dioxide curing. MATERIALS 11 (5), 730. doi:10.3390/ma11050730
Marius-George, P., Georgeta, V., Alina-Ioana, B., Eugeniu, V., and Vasile, E. (2021). CO 2 sequestration in the production of portland cement mortars with calcium carbonate additions. Nanomater. (Basel, Switz. 11 (4), 875. No. doi:10.3390/nano11040875
Mei, K., Cheng, X., Gu, T., Zheng, Y., Gong, P., Li, B., et al. (2021). Effects of Fe and Al ions during hydrogen sulphide (H 2 S)-induced corrosion of tetracalcium aluminoferrite (C 4 AF) and tricalcium aluminate (C 3 A). J. Hazard. Mat. 403, 123928. doi:10.1016/j.jhazmat.2020.123928
Mei, K., Cheng, X., Zhang, H., Yu, Y., Gao, X., Zhao, F., et al. (2018). The coupled reaction and crystal growth mechanism of tricalcium silicate (C3S): An experimental study for carbon dioxide geo-sequestration wells. Constr. Build. Mat. 187, 1286–1294. doi:10.1016/j.conbuildmat.2018.08.080
Morandeau, A. A., Morandeau, I., Thiéry, M., and Dangla, P. (2014). Investigation of the carbonation mechanism of CH and C-S-H in terms of kinetics, microstructure changes and moisture properties. Cem. Concr. Res. 56, 153–170. doi:10.1016/j.cemconres.2013.11.015
Niel, P., and Eurybiades, B. (1982). The solubilities of calcite, aragonite, and vaterite in CO_2-H_2O solutions between 0 and 90°C, and evaluation of the aqueous model for the system CaCO_3-CO_2H_2O. Geochim. Cosmochim. Acta. 46, 1011–1040.
Palmer, T. J., Hudson, J. D., and Wilson, M. A. (1988). Palaeoecological evidence for early aragonite dissolution in ancient calcite seas. NATURE 335 (6193), 809–810. No. doi:10.1038/335809a0
Poudyal, L., Adhikari, K., and Won, M. (2021). Mechanical and durability properties of portland limestone cement (PLC) incorporated with nano calcium carbonate (CaCO3)(Article). MATERIALS 14 (4), 1–19. No.
Rostami, V., Shao, Y., Boyd, A. J., and He, Z. (2012). Microstructure of cement paste subject to early carbonation curing. Cem. Concr. Res. 42 (1), 186–193. No. doi:10.1016/j.cemconres.2011.09.010
Sánchez Herrero, M. J., Fernández Jiménez, A., Palomo, Á., and Klein, L. (2016). Alkaline hydration of C2S and C3S. J. Am. Ceram. Soc. 99 (2), 604–611. No. doi:10.1111/jace.13985
Shah, V., Scrivener, K., Bhattacharjee, B., and Bishnoi, S. (2018). Changes in microstructure characteristics of cement paste on carbonation. Cem. Concr. Res. 109, 184–197. doi:10.1016/j.cemconres.2018.04.016
Shen, Q., Pan, G., and Bao, B. (2016). Influence of CSH carbonation on the porosity of cement paste. Mag. Concr. Res. 10, 504–514. No. doi:10.1680/jmacr.15.00286
Sorrentino, F. (2008). Upscaling the synthesis of tricalcium silicate and alite. Cem. WAPNO BETON 8 (4), 177. No.
Tadros, M. E., Skalny, J., and Kalyoncu, R. S. (1976). Early hydration of tricalcium silicate. J. Am. Ceram. Soc. 59 (7-8), 344–347. No. doi:10.1111/j.1151-2916.1976.tb10980.x
Therese, K. F., Eric, H. O., Sigurður, R. G., and Per, A. (2011). The effect of dissolved sulphate on calcite precipitation kinetics and consequences for subsurface CO2 storage. Energy Procedia 4, 5037–5043. doi:10.1016/j.egypro.2011.02.476
Wang, D., Xiong, C., Li, W., and Jun, C. (2020). Growth of calcium carbonate induced by accelerated carbonation of tricalcium silicate. ACS Sustain. Chem. Eng. 8 (39), 14718–14731. No. doi:10.1021/acssuschemeng.0c02260
Wei, Tingcong, Wei, Fengqi, Zhou, Jinghong, Wu, Zhiqiang, Zhang, Chunmei, Jia, Zhuang, et al. (2022). Formation and strengthening mechanisms of xonotlite in C3S-silica and C2S-silica powder systems under high temperature and pressure. Cem. Concr. Res. 157, 106812. doi:10.1016/j.cemconres.2022.106812
Keywords: carbonization corrosion, relative crystallinity, single-phase cement, CCUS, C3S (tricalcium silicate)
Citation: Lian J, Wu Z, Lei Y, Gao Q, Mei K, Cai J and Cheng X (2022) Growth mechanism of carbonated tricalcium silicate (C3S) under the high concentration of CO2: A novel research for CCUS wells. Front. Mater. 9:995122. doi: 10.3389/fmats.2022.995122
Received: 15 July 2022; Accepted: 15 November 2022;
Published: 24 November 2022.
Edited by:
Deepanraj B., Prince Mohammad bin Fahd University, Saudi ArabiaReviewed by:
Arkamitra Kar, Birla Institute of Technology and Science, IndiaTao Gu, Southwest University of Science and Technology, China
Chengwen Wang, China University of Petroleum, Huadong, China
Copyright © 2022 Lian, Wu, Lei, Gao, Mei, Cai and Cheng. This is an open-access article distributed under the terms of the Creative Commons Attribution License (CC BY). The use, distribution or reproduction in other forums is permitted, provided the original author(s) and the copyright owner(s) are credited and that the original publication in this journal is cited, in accordance with accepted academic practice. No use, distribution or reproduction is permitted which does not comply with these terms.
*Correspondence: Xiaowei Cheng, Y2hlbmd4d0Bzd3B1LmVkdS5jbg==