 Jing Zhang1
 Gaojian Hu
- 1College of Safety and Emergency Management Engineering, Taiyuan University of Technology, Taiyuan, Shanxi, China
- 2Yanbao Energy, China Energy Investment, Hulun Buir, China
- 3School of Civil Engineering, Shaoxing University, Shaoxing, Zhejiang, China
- 4Key Laboratory of Rock Mechanics and Geohazards of Zhejiang Province, Shaoxing, Zhejiang, China
The secant modulus of the rock reflects the stiffness of the rock and the ability to resist deformation. There are significant differences in the secant modulus of the rock due to the different numbers of joints in the rock and the change in rock size. Therefore, it is important to obtain effectively the secant modulus of rocks with the number of parallel joints for evaluating rock deformation. In this study, the method of regression analysis is used, and 10 sets of numerical plans are set up to discuss the influence of a number of parallel joints and rock size on the secant modulus. The results show that the secant modulus decreases with the increase in a number of parallel joints, and the curve is a power function. The secant modulus decreases when the rock size increases, and the curve is an exponential function. The characteristic secant modulus and characteristic size decrease with the increase in the number of parallel joints, and their curves are an exponential function. The specific forms of these relationships are given in the article. The establishment of these relationships realizes the prediction and calculation of the rock secant modulus with the number of parallel joints, which provides a guiding significance for the rock deformation analysis.
1 Introduction
The secant modulus is the slope of the line connecting the point corresponding to the 50% compressive strength and the origin on the stress–strain curve of the rock under unidirectional stress (Briaud, 2001). It can reflect the stiffness of the rock, and its increase can reflect the increase in the material’s ability to resist deformation to a certain extent (Ahn et al., 2015). Therefore, the secant modulus is a very important parameter index, which is of great significance in analyzing the laws of rock deformation and failure, and plays an important role in guiding the design, construction, and stability of underground engineering (Wang et al., 2021).
The joints in the rock affect the secant modulus. For example, there are parallel joints in some sedimentary rocks, which significantly affect the secant modulus. At the same time, the number of parallel joints (NPJs) existing in the rock will cause the difference in the secant modulus (Li et al., 2020), for example, Zhang (2009) studied the influence of the joint number on the secant modulus based on the micro-deformation characteristics of the fractured rock mass. Scholars have studied the effects of rock temperature, confining pressure, and saturation on the secant modulus. In terms of temperature, Zhao et al. (2017) determined the empirical coefficient of the secant modulus by the inverse analysis method. Zhang et al. (2021) established the constitutive relation of the broken coal body considering the temperature by fitting the relationship between the secant modulus of the broken coal body and the temperature under the action of stress. Su et al. (2017) studied the effect of temperature and pulse angle on the secant modulus through a triaxial compression test. Erisa et al. (2021) studied the effect of loading frequency on the secant modulus of concrete and explored the source of temperature increase. In the effect of confining pressure on the secant modulus, for example, Kang et al. (2018) defined the damage coefficient according to the secant modulus attenuation characteristics and compared the influence of confining pressure on the secant modulus and damage evolution characteristics. Zhang et al. (2020) carried out numerical construction of porous coal samples and analyzed the secant modulus of porous samples considering pore density and confining pressure. Hang-Zhou and Liao (2007) analyzed the relationship between the secant modulus and internal friction angle of expansive mudstone, confining pressure. Uniaxial compression laboratory tests and numerical tests are commonly used test methods to study the secant modulus, for example, studied the uniaxial compressive strength and the secant modulus of the hardened cement slurry with different water saturation levels through a uniaxial compression test. Zhang and Zhu (2020) conducted uniaxial compression simulation experiments on prefabricated rock-like materials by Particle Flow Code (PFC) software and obtained the laws of mechanical parameters such as the secant modulus of different samples. Nouri et al. (2016) explored the effect of plastic enhancement behavior on the secant modulus in sandstone through a triaxial compression test. Asgari et al. (2015) studied the relationships between the secant modulus and UCS, curing time, and cement. The aforementioned studies have obtained the relation between the secant modulus and temperature, confining pressure, and saturation. However, there are NPJs in the rock, and the existence of parallel joints has an important influence on the strength of the rock (Hu et al., 2022a). Therefore, it is important to explore the effect of parallel joints in rocks on the secant modulus and to obtain the relationship between the two. In this regard, scholars have carried out relatively little research.
The rock has a size effect, and the change in rock size will also affect the secant modulus. For example, the change in the size of some sedimentary rocks rich in joints will affect the change in the rock secant modulus, for example, Ban et al. (2019) characterized the mechanical properties with the size effect based on the secant modulus method and the effective mode reduction method. In addition, scholars have also carried out research on the size effect of the secant modulus from the perspectives of rock aspect ratio, particle size, and joint length, for example, Sun et al. (2022) studied the aspect ratio effect of the dynamic deformation modulus of coal and found that the sensitivity of the secant modulus strain rate in the plastic section of the specimen with a large aspect ratio is stronger than that of the specimen with a small aspect ratio. Mahdevari et al. (2020) studied the effect of bulk size and bulk volume ratio on the deformation modulus by making large-scale physical samples. Davarpanah et al. (2020) studied the effect of the modulus ratio on the rock modulus and explored the validity of the mathematical model proposed by Zhu (2021) by PFC software to obtain the stress–strain curves of the substitute materials at all levels and found that there was an exponential correlation between the ratio of the secant modulus and the maximum particle size D of the sample. Liu et al. (2020) conducted uniaxial compression tests on rock samples with rough joints to study the effect of joint length on the secant modulus, cracking process, and failure mode. Majdi and Beiki (2019) proposed a prediction method to determine the deformation modulus of the rock by means of multiple regression analysis. The aforementioned research has gotten the size effect of the secant modulus from different angles, indicating that there is indeed a size effect on the rock secant modulus. Therefore, when there are parallel joints in the rock, the size effect of the secant modulus still exists. NPJs often occur in rocks, so it is particularly important in engineering to explore the size effect of the secant modulus of rocks with NPJs and to obtain the relation between the secant modulus and size. However, there is still relatively little research in this area.
Different rock sizes have an impact on the surface area of rock weathering. Therefore, it is particularly important to determine the rock’s characteristic size. The study of the rock size effect is important to prevent erosion in rivers, oceans, and glaciers and analyze bulk rock size in hilly terrain. Some scholars have carried out some research on the study of REV. For example, Loyola et al. (2021) presented a new general methodology to define the size of the REV for the geometrical and elastic moduli of fractured media. Peng et al. (2020) analyzed the size effect through PFC software and obtained a REV size of 16 m. Hu et al. (2022b) obtained the relation between the spacing of parallel joints and elastic modulus characteristic size. In the study of the secant modulus of REV, Zhang (2013) obtained the REV of the deformation parameters and strength parameters of the rock mass through numerical tests of rock mass samples of different sizes. The aforementioned studies show that there are relatively few studies on the secant modulus in terms of the REV of rock mechanical parameters, especially the secant modulus of rocks with parallel joints.
In the study, the effect of rock size and NPJs on E50 is explored. The relationships between E50 and NPJs, E50 and rock size, the characteristic size of rock E50 and NPJs, and the rock characteristic E50 and NPJs are established.
2 Numerical simulation plans
The research content is divided into two aspects: 1) influence of the NPJs on E50; NPJs are 2, 4, 6, 8, and 10, including plans 1–5; and 2) influence of rock size with NPJs on E50, whose rock sizes are 100 mm, 200 mm, 400 mm, 600 mm, and 800 mm, including plans 6–10. A two-dimensional numerical model was used in the study with a height-to-diameter ratio of 1:1. Simulation plans (Mahdevari et al., 2020) are shown in Table 1.
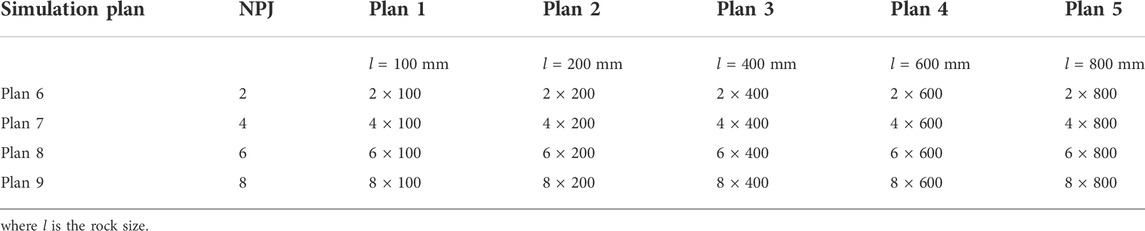
TABLE 1. Simulation plans (Mahdevari et al., 2020).
In the research, RFPA software was used to carry out uniaxial compression simulation research based on the uniaxial compression deformation theory of rocks. RFPA is a rock fracture process analysis system with elastic mechanics as the stress analysis tool and elastic damage theory and its modified Coulomb failure criterion as the medium deformation and failure analysis module. The basic principle of the program can be summarized as follows: first, the rock medium model is discretized into a numerical model composed of mesoscopic primitives. Then, it is assumed that the mechanical properties of the discretized mesoscopic primitives obey the Weibull distribution, and the connection between the mesoscopic and macroscopic media is established. Based on the linear elastic finite element analysis method, the basic element failure criterion and damage law are introduced to solve the problem, and the deformation and failure process of the rock is obtained.
Displacement loading was applied along the upper surface of the model with a loading increment of 0.01 mm, and no load was applied on both sides of the model (Mahdevari et al., 2020). The rock mechanics parameters used in the simulation are shown in Table 2. A regression analysis method was used in the study. The basic idea of regression analysis is to solve a series of secant modulus values based on numerical models, mathematically process the data values to obtain a series of parameters, and establish the corresponding regression equations.
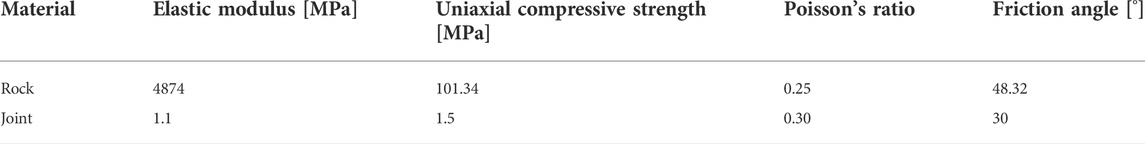
TABLE 2. Mechanical parameters of the rock (Mahdevari et al., 2020).
3 Numerical simulation results
3.1 Influence of the NPJs on E50
3.1.1 Rock stress law of different NPJs
From the research content (1), the stress–strain curves in plans 1–5 are drawn in Figure 1.
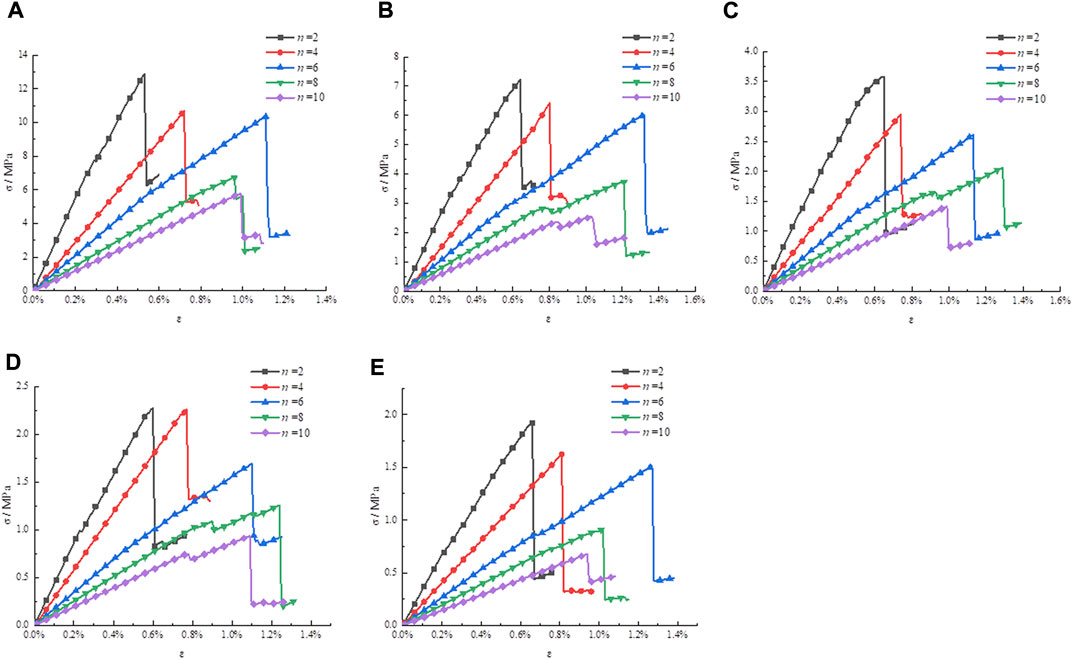
FIGURE 1. Stress–strain curves with different NPJs. (A) l = 100 mm, (B) l = 200 mm, (C) l = 400 mm, (D) l = 600 mm, and (E) l = 800 mm.
Figures 1A–E indicate that the obtained patterns of the curves do not considerably vary with the variation of rock size. Therefore, one of the pictures is chosen to describe the failure law when NPJs change.
The rock size in Figure 1B is 200 mm. In Figure 1B, when the NPJs are 2, 4, 6, 8, and 10, the obtained stress–strain curves are very similar. These curves gradually change from linear elastic deformation to plastic failure, and the curves conform to the general law of rock failure. Figure 1B shows that when the rock size is 200 mm, as the NPJs change from 2 to 10, the peak strength decreases. The main reason is that when the NPJs increase, the damage value of the rock increases under the same strain value, and the rock resistance to deformation and destruction decreases continuously. The peak strength is connected with the NPJs.
3.1.2 Fitting method for the secant modulus and NPJs
According to the stress–strain curves in Figure 1, the point of 50% compressive strength was selected, the slope of the line connecting it with the origin was calculated, and E50 of the rock under each working condition was obtained, as shown in Table 3.
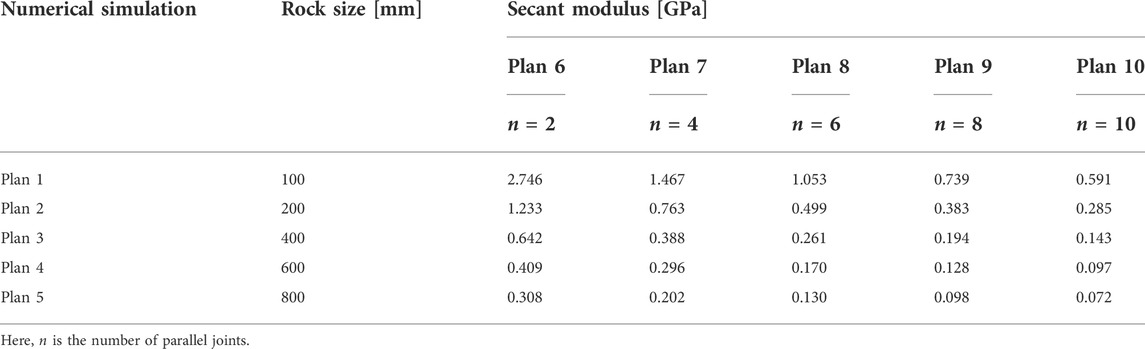
TABLE 3. Secant modulus.
A scatter plot of E50 and NPJs in Table 3 is drawn, and their fitting curves are regressed, as shown in Figure 2.
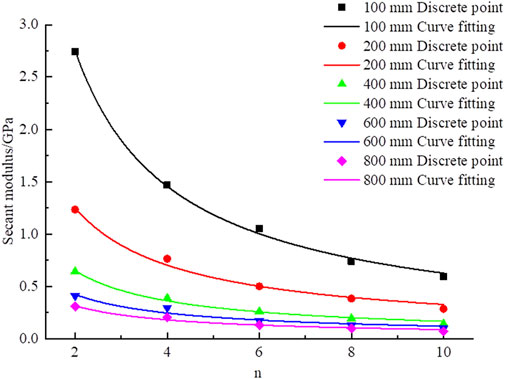
FIGURE 2. Fitting curves of the secant modulus.
Figure 2 indicates that when the NPJs is six, E50 of the rock decreases from 1.053 GPa to 0.13 GPa with the increase in the rock size from 100 mm to 800 mm, which indicates that E50 of the rock is affected by the rock size and decreases with the increase in the rock size. This law is similar even if the NPJs are different. When the rock size is 100 mm, the NPJs increase from 2 to 10, and E50 of the rock decreases from 2.746 GPa to 0.591 GPa, which indicates that rock E50 decreases with the increase in the NPJs.
The aforementioned observations show that E50 is in connection with the NPJs and rock size. In order to better illustrate this relationship, the formula of the regression curves is listed in Table 4.
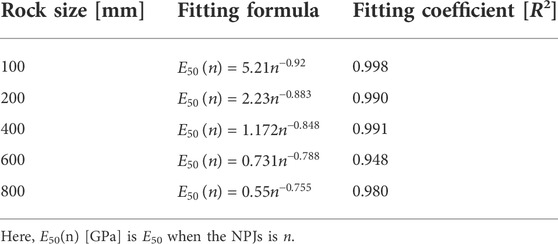
TABLE 4. Fitting relationship between the secant modulus and NPJs.
3.1.3 Relationship between the secant modulus and NPJs
From the data fitting results in Table 4, the curve trend of E50 and NPJs is a power function, and the resulting mathematical model is as follows:
where E50(n) [GPa] is E50 when the NPJs is n, n is NPJs, and a and b are parameters.
From the expressions obtained in Table 4, the parameters a and b can be extracted, and the values of each parameter are shown in Table 5. Each parameter is fitted with the rock size, and the fitting curve obtained is shown in Figure 3.
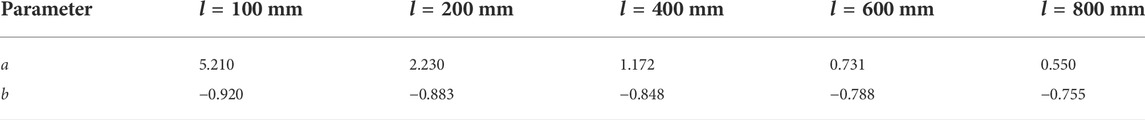
TABLE 5. Value of parameters a and b.
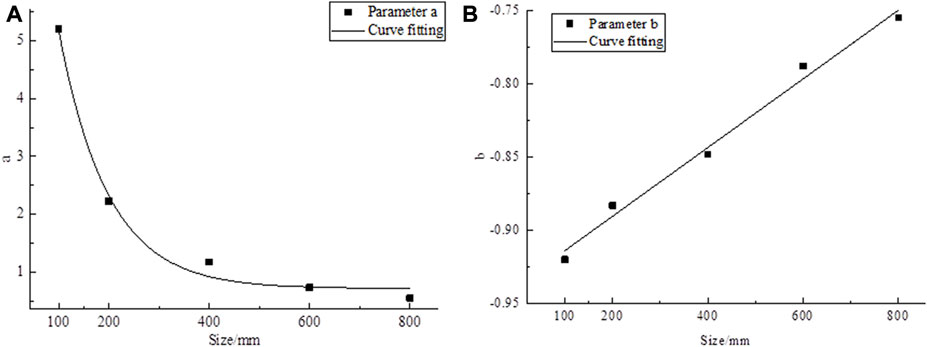
FIGURE 3. Fitting curve diagram of parameters: (A) parameter a and (B) parameter b.
From the curve obtained in Figure 3, each parameter has a certain relationship with the size, and the expression is as follows:
From Eqs 1–3, the expression between E50 and NPJs can be obtained as
Eq. 4 is a special relational formula used to solve the corresponding rock E50 when the NPJs change, and its applicable condition is a two-dimensional plane strain. For the engineering site, when the size of the rock used for research is determined, the corresponding rock E50 value can be quickly obtained according to the NPJs existing in the rock. This relationship quantifies and simplifies the solution of E50 of rocks with parallel joints.
3.2 Influence of the rock size on the rock secant modulus
3.2.1 Rock stress law of different rock sizes
From the research content (2), the stress–strain curves in plans 6–10 are drawn in Figure 4.
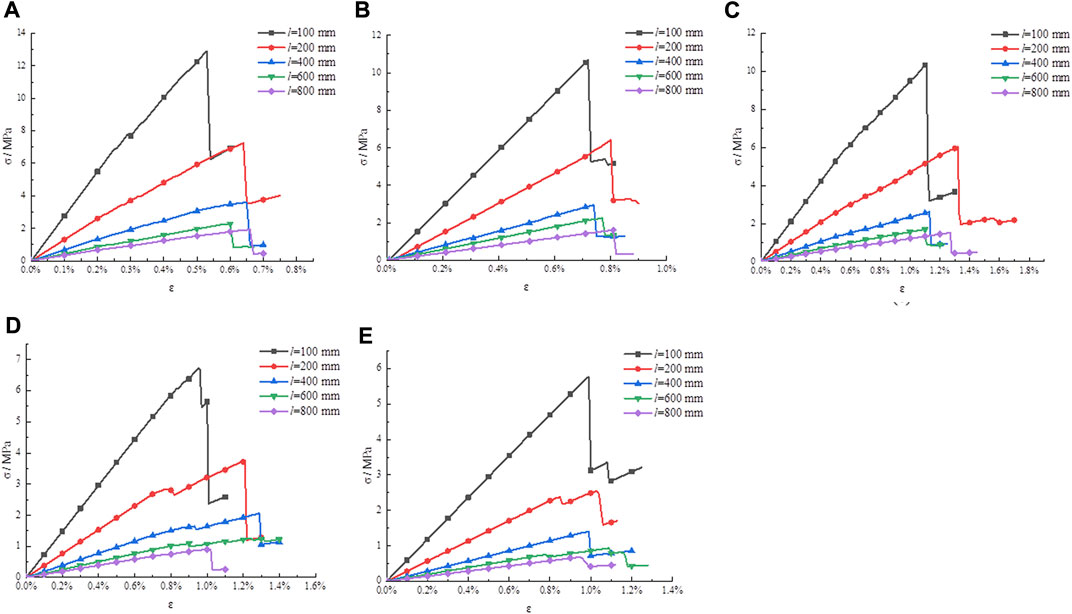
FIGURE 4. Stress–strain curves of different rock sizes. (A) N = 2, (B) n = 4, (C) n = 6, (D) n = 8, and (E) n = 10.
Figures 4A–E show that the obtained patterns of the curves do not considerably vary with the change of the NPJs. Therefore, one of the pictures is chosen to describe the failure law when the rock size changes.
The NPJs in Figure 4E is 10. In Figure 4E, when the rock size is increased from 100 mm to 800 mm, the obtained stress–strain curves have very similar regularity. These curves gradually change from linear elastic deformation to plastic failure, and the curves conform to the general law of rock failure. Figure 4E shows that the NPJs is 10; as the rock size increases from 100 mm to 800 mm, the peak strength of the rock decreases. It shows that the rock’s peak strength is connected with the rock size.
3.2.2 Fitting method for the secant modulus and rock size
From the stress–strain curves in Figure 4, the point of 50% compressive strength was selected, the slope of the line connecting it with the origin was calculated, and E50 of the rock was obtained, as shown in Table 6.
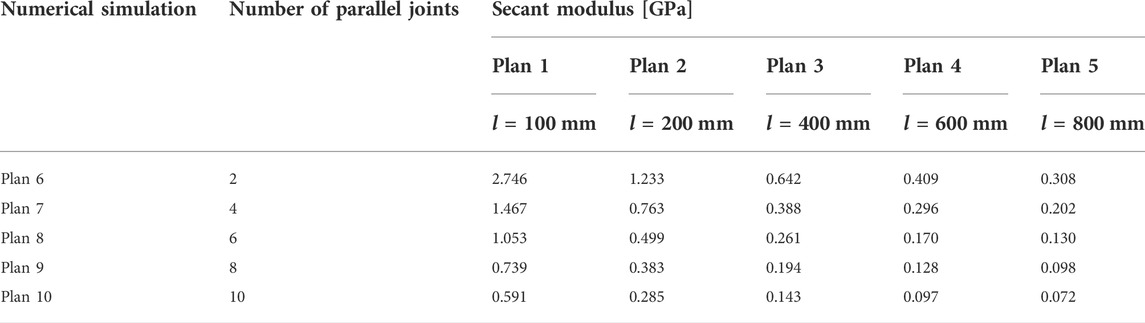
TABLE 6. Secant modulus.
A scatter diagram of E50 and rock size in Table 6 is plotted, and their fitting curves are regressed, as shown in Figure 5.
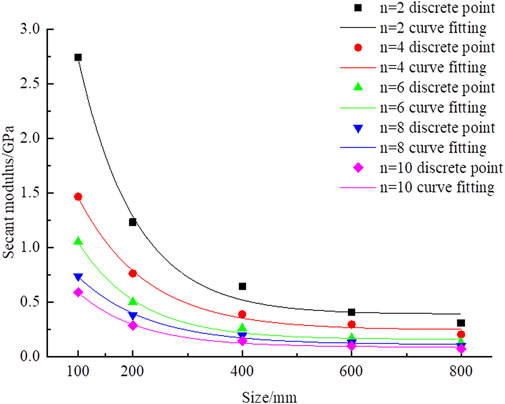
FIGURE 5. Fitting curve of the secant modulus under different rock sizes.
Figure 5 indicates that as the rock size is 100 mm, the NPJs increase from 2 to 10, and rock E50 decreases from 2.746 GPa to 0.591 GPa, which indicates that rock E50 decreases with the increase in the NPJs. This law is the same even if rock sizes become different. When the NPJs is four, E50 of rocks decreases from 1.467 GPa to 0.202 GPa with the increase in the rock size from 100 mm to 800 mm, which indicates that E50 of rocks is connected with the rock size and decreases with the increase in the rock size.
To better analyze the relation between E50 and the rock size, the functional formula of the fitting curves in Figure 5 is listed in Table 7.
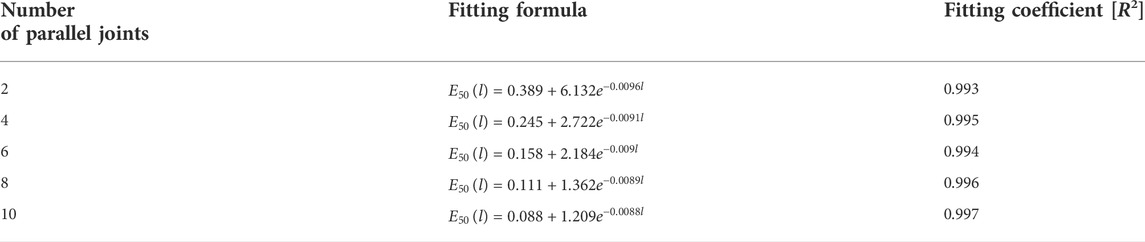
TABLE 7. Fitting relationship of the secant modulus.
3.2.3 Relationship between the secant modulus and rock size
From the data fitting results in Table 7, the curve trend of E50 and rock size is an exponential function, and the resulting mathematical model is as follows:
where E50(l) [GPa] is the E50 value of the rock when the rock size is l, l [mm] is the rock size, and d, f, and g are parameters.
From the expressions obtained in Table 7, the values of parameters d, f, and g can be extracted, and the values of each parameter are shown in Table 8. Each parameter is fitted with the NPJs, and the fitting curve obtained is shown in Figure 6.
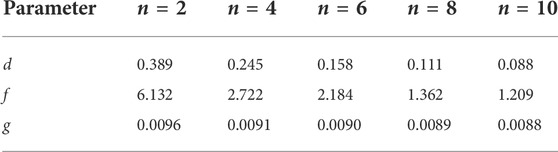
TABLE 8. Values of parameters d, f, and g.
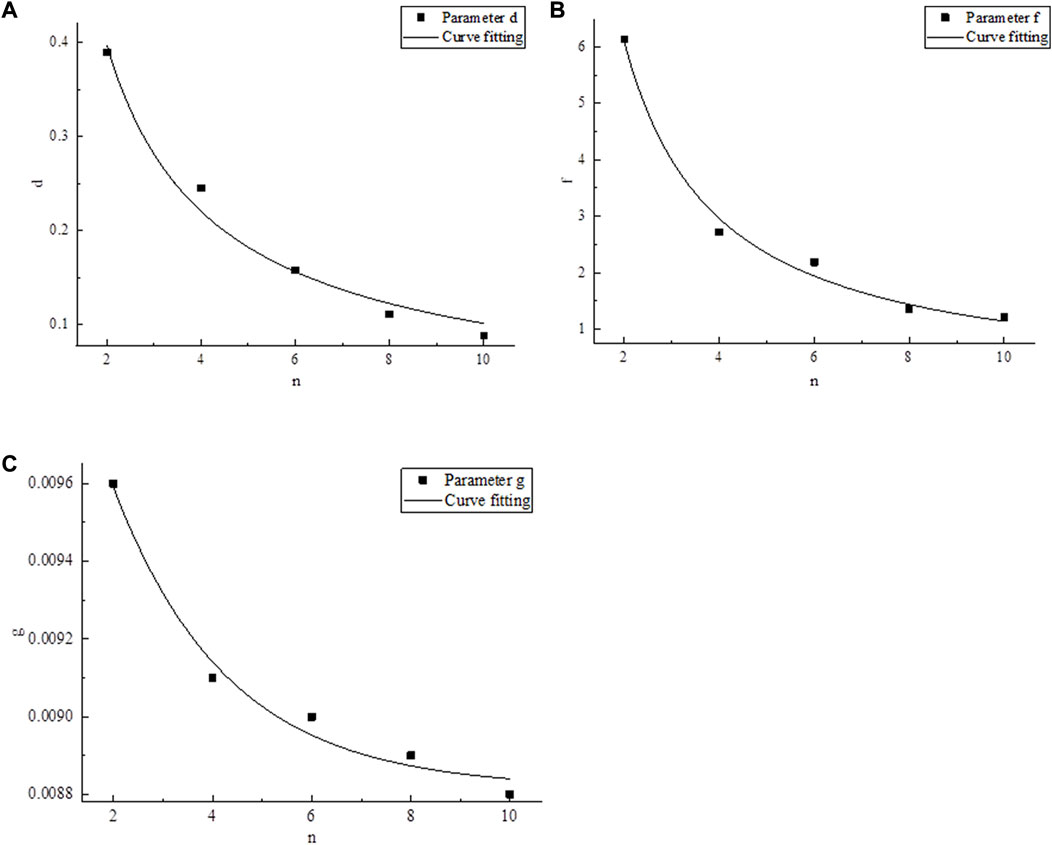
FIGURE 6. Fitting curve diagram of parameters: (A) parameter d, (B) parameter f, and (C) parameter g.
From the curve obtained in Figure 6, each parameter has a certain relationship with the NPJs, and the expression is as follows:
From Eqs 5–8, the expression between E50 and rock size can be obtained as
Eq. 9 is a special relational formula used to solve the corresponding rock E50 value when the rock size changes, and its applicable condition is a two-dimensional plane strain. When the NPJs in a rock are known, its E50 changes with the variation in the rock size. Eq. 9 gives the characteristics of this change and quantifies it and can quickly solve the E50 value of different rock sizes. For the engineering site, once the number of parallel joints contained in the rock is known, for any selected size of the rock, the secant modulus value of the rock under this size can be quickly solved.
3.3 Established relationship of CSBM, CBM, and NPJs
3.3.1 Formula of the characteristic size of E50
The size effect of E50 is usually characterized by the characteristic size of the secant modulus (CSSM). Ling et al. (2013) gave a quantitative calculation method of the characteristic size. The formula for solving the CSSM is as follows:
where γ is the acceptable absolute value of the slope.
3.3.2 Relationship between CSSM and NPJs
The CSSM is solved in Table 9 when the NPJs were 2, 4, 6, 8, and 10. Also, the regression curve of CSSM and NPJs is drawn in Figure 7.
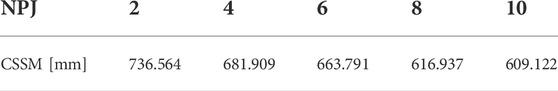
TABLE 9. Value of the characteristic size of the secant modulus.

FIGURE 7. Fitting curve between CSSM and NPJs.
Figure 7 shows that there is a relationship between the CSBM and NPJs. The function of the curve is a power function. As the NPJs increase, the CSBM decreases. The expression can be obtained as
where D(n) [mm] is the characteristic size of rock E50.
Eq. 13 is a special relational formula used to solve the corresponding rock CSSM when the NPJs changes, and its applicable condition is a two-dimensional plane strain. For the engineering site, the corresponding rock CSSM can be quickly obtained according to the NPJs existing in the rock. This relationship quantifies and simplifies the solution of CSSM with parallel joints, which has an important engineering application value.
3.3.3 Relationship between the CSM and NPJs
The value of CSSM was substituted into Eq. 5, and the characteristic secant modulus (CSM) with different NPJs is summarized in Table 10.
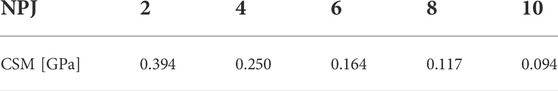
TABLE 10. Value of the characteristic secant modulus of the rock.
Figure 8 shows that the relationship between the CSM and NPJs is a power function. As the NPJs increase, the CSM gradually decreases. The relation is as follows:
where E50w(n) [GPa] is the CSM of the rock and n is the NPJs.
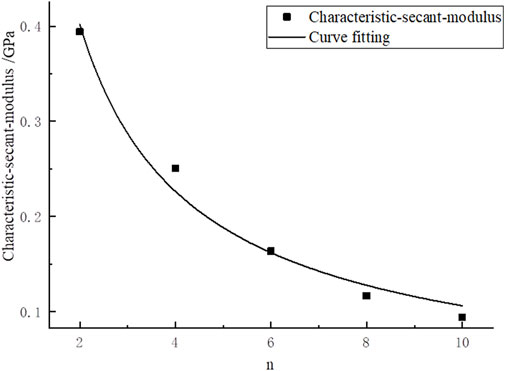
FIGURE 8. Fitting curve of the CSM and NPJs.
Equation 14 is a special relational formula used to solve the corresponding rock CSM when the NPJs changes, and its applicable condition is a two-dimensional plane strain. For the engineering site, the corresponding rock CSM can be quickly obtained according to the NPJs existing in the rock. This relationship quantifies and simplifies the solution of the CSM with NPJs.
3.4 Experimental comparison and verification analysis
To verify the general applicability of Eq. 5, Zhang (Zhang, 2011) experimental data (page 645, Table 1) are used. Rock E50 values with different sizes are listed in Table 11.
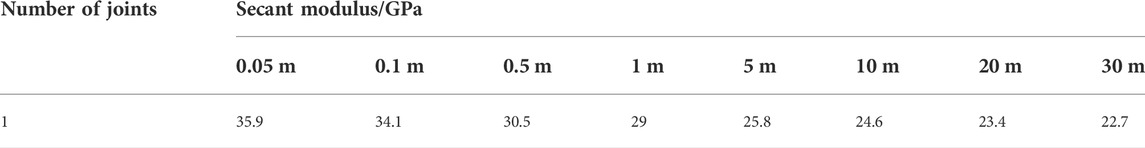
TABLE 11. Secant modulus (Liu et al., 2020).
From the data listed in Table 11, a scatter diagram of E50 and sizes is plotted, and their fitting curves are regressed, as shown in Figure 9.
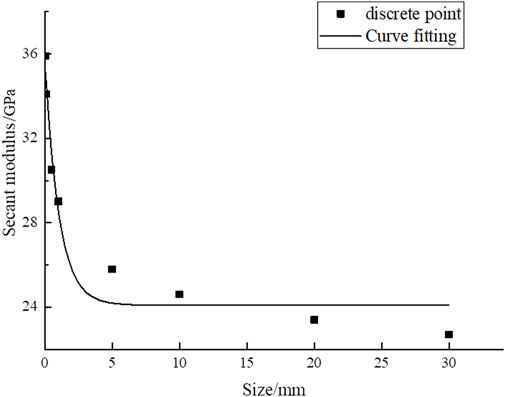
FIGURE 9. Fitting curves of the secant modulus with sizes.
The relationship between E50 and sizes is obtained in Figure 9 as follows:
where E50(l) [GPa] is the E50 value of the rock when the rock size is l and l [m] is the rock size.
The function of Eq. 15 conforms to the expression proposed in Eq. 5. Therefore, the verification is consistent with the conclusions obtained from the numerical simulations in this study. According to the verification results, the mathematical model obtained by Eq. 5 can be used to solve E50 with different sizes.
4 Discussion
There is a size effect on E50 with the NPJs. This study obtains the following relationship through research:
1) The relation between rock E50 and NPJs. The relation is proposed by analyzing the variation of E50 with the NPJs. According to previous research studies, Zhang (2009) studied the effect of the NPJs on E50 based on the meso-deformation characteristics of fractured rock mass, but he did not get the specific relational formula of E50. The relationship (4) obtained in this study quantifies and simplifies the solution of rock E50 with NPJs and can be used to solve the corresponding rock E50 value when the parallel joint changes. For the engineering site, when the size of the rock used for research is determined, the corresponding rock secant modulus value can be quickly obtained according to the number of parallel joints existing in the rock.
2) The relation between rock E50 and the rock size. This relationship is proposed by analyzing the variation of rock E50 with the rock size. According to previous research studies, scholars mostly obtained the general law of the size effect of E50 from the perspectives of the rock aspect ratio (Asgari et al., 2015), particle size (Hu et al., 2022a), and joint length (Ban et al., 2019). However, the relationship between E50 and rock size is rarely established. Eq. 9 obtained in this study quantifies the size effect of E50 and can quickly solve E50 of different rock sizes. For the engineering site, the secant modulus of the rock of any size can be obtained by the regression curve, which saves the tedious process of the on-site in situ test, and the engineering application is simple and convenient.
3) The relation between the rock CSSM, CSM, and NPJs. The relationship is proposed by analyzing the variation of the CSSM and CSM with the NPJs. In the existing research, Davarpanah et al. (2020) studied the REV of E50, but they did not get the specific relational formula of E50. The relationships (13) and (14) obtained in this study quantify and simplify the solution of the rock CSSM and CSM with parallel joints and can be used to solve the corresponding rock CSSM and CSM when the parallel joint changes. For engineering rocks, considering the influence of the size effect, when the secant modulus of the rock needs to be calculated, it is only necessary to select rocks larger than the characteristic size for testing.
5 Conclusion
The NPJs have an effect on the E50 value, and few people have explored the relationship of this effect. The expressions are obtained through numerical simulation:
(1) The relation between E50 and NPJs observes the following:
Particularly, our simulations obtained
(2) The relation between E50 and rock size with NPJs observes the following:
Particularly, our simulations obtained
(3) The CSSM is found to be related to NPJs. Their relation is as follows:
(4) The CSM is found to be related to NPJs. Their relation is as follows:
Data availability statement
The original contributions presented in the study are included in the article/Supplementary Material; further inquiries can be directed to the corresponding author.
Author contributions
JZ: data curation, investigation, funding acquisition, and writing—original draft preparation. WG: methodology and formal analysis. FUY: data curation and investigation. FEY: formal analysis and investigation. QW: formal analysis and data curation. GH: conceptualization, software, funding acquisition, and writing—original draft preparation. TW: data curation and investigation.
Funding
This work was supported by the Project: Inner Mongolia Dayan Mining Group Co., Ltd. entrusted “Research and Application of Two-way Profitable Balance Support Technology under High Stress Soft Rock Conditions in No. 3 Coal Mine (Research and Development of New Resin Anchoring Agent)” (GJNY-21-108), the Zhejiang Collaborative Innovation Center for Prevention and Control of Mountain Geological Hazards (PCMGH-2017-Y-05), and the Key Laboratory of Rock Mechanics and Geohazards of Zhejiang Province (ZGRMG-2019-07).
Conflict of interest
Authors FUY and FEY were employed by China Energy Investment.
The remaining authors declare that the research was conducted in the absence of any commercial or financial relationships that could be construed as a potential conflict of interest.
Publisher’s note
All claims expressed in this article are solely those of the authors and do not necessarily represent those of their affiliated organizations, or those of the publisher, the editors, and the reviewers. Any product that may be evaluated in this article, or claim that may be made by its manufacturer, is not guaranteed or endorsed by the publisher.
References
Ahn, J., Gabr, M., Oh, J., and Shin, H. (2015). Degraded secant modulus for permanent deformation of soils [J]. Int. J. Pavement Eng. 16 (6), 549–558.
Asgari, M. R., Baghebanzadeh Dezfuli, A., and Bayat, M. (2015). Experimental study on stabilization of a low plasticity clayey soil with cement/lime. Arab. J. Geosci. 8 (3), 1439–1452. doi:10.1007/s12517-013-1173-1
Ban, H., Yao, Y., Chen, S., and Fang, D. (2019). A new constitutive model of micro-particle reinforced metal matrix composites with damage effects. Int. J. Mech. Sci. 152, 524–534. doi:10.1016/j.ijmecsci.2019.01.024
Briaud, J. L. (2001). Introduction to soil moduli. Richmond, B.C., Canada: BiTech Publishers Ltd. Geotechnical News.
Davarpanah, S. M., Somodi, G., Kovács, L., and Vasarhelyi, B. (2020). Experimental Determination of the mechanical properties and deformation Constants of Mórágy Granitic rock formation (Hungary). Geotech. Geol. Eng. (Dordr). 38 (3), 3215–3229. doi:10.1007/s10706-020-01218-4
Erisa, M., Jérôme, S., Evelyne, P., and Mohend, C. (2021). Fatigue deterioration mechanisms of high-strength grout in compression. Constr. Build. Mater. 270, 121387. doi:10.1016/j.conbuildmat.2020.121387
Hang-Zhou, L. I., and Liao, H. J. (2007). Experimental study on Nonlinear strength deformation characteristic of Expansive mudstone [J]. Chin. J. Undergr. Space Eng. 3 (1), 19–22.
Hu, G., Ma, G., Liang, W., Song, L., and Fu, W. (2022). Influence of the number of parallel-joints on size Effect of Elastic modulus and characteristic Elastic modulus [J]. Front. Earth Sci. 10, 1–11.
Hu, G., Ma, G., Liu, J., and Qi, K. (2022). Size Effect of the number of parallel joints on uniaxial compressive strength and characteristic strength[J]. Minerals 12 (1), 1–24.
Kang, Y., Chen, J., Cheng, N., and Luo, Y. (2018). Evolution characteristics of secant modulus and its Post peak damage in three Axial compression for sandstone[J]. J. Inn. Mong. Univ. Technol. Sci. Ed. 37 (1), 35–42.
Li, B., Lan, J., Si, G., Lin, G., and Hu, L. (2020). NMR-based damage characterisation of backfill material in host rock under dynamic loading. Int. J. Min. Sci. Technol. 30 (03), 329–335. doi:10.1016/j.ijmst.2020.03.015
Ling, Z. Z., Zhang, Y. B., Tang, B., Li, L. C., and Tang, C. A. (2013). Size effect of rock masses and associated representative element properties. Chin. J. Rock Mech. Eng. 32 (6), 1157–1166.
Liu, J., Su, H., Jing, H., Hu, C., and Yin, Q. (2020). Experimental study on the fracture Evolution Processof rock-like specimens containing a Closed RoughJoint based on 3D-Printing Technology. Adv. Civ. Eng. 2020 (1), 1–16. doi:10.1155/2020/8889606
Loyola, A. C., Pereira, J. M., and Neto, M. (2021). General Statistics-based methodology for the Determination of the geometrical and mechanical representative Elementary volumes of fractured media[J]. Rock Mech. Rock Eng. 54, 1841–1861.
Mahdevari, S., Moarefvand, P., and Mohammadzamani, D. (2020). Considering the Effect of Block-to-matrix strength ratio on Geomechanical parameters of Bimrocks. Geotech. Geol. Eng. (Dordr). 38 (5), 4501–4520. doi:10.1007/s10706-020-01304-7
Majdi, A., and Beiki, M. (2019). Applying evolutionary optimization algorithms for improving fuzzy C-mean clustering performance to predict the deformation modulus of rock mass. Int. J. Rock Mech. Min. Sci. (1997). 113, 172–182. doi:10.1016/j.ijrmms.2018.10.030
Nouri, S., Nechnech, A., Lamri, B., and Lurdes Lopes, M. (2016). Triaxial test of drained sand reinforced with plastic layers. Arab. J. Geosci. 9 (1), 53. doi:10.1007/s12517-015-2017-y
Peng, C., Guo, Q., Yan, Z., Wang, M., and Pan, J. (2020). Investigating the failure mechanism of jointed rock slopes based on Discrete Element method. Adv. Civ. Eng. 2020 (9), 1–19. doi:10.1155/2020/8820158
Su, H., Jing, H., Yin, Q., Yu, L., Wang, Y., and Wu, X. (2017). Strength and deformation behaviors of veined marble specimens after vacuum heat treatment under conventional triaxial compression. Acta Mech. Sin. 33 (5), 886–898. doi:10.1007/s10409-017-0653-z
Sun, Z., Wu, Y., Sun, J., Chen, J., Fu, Y., and Shan, S. (2022). Aspect ratio effect of dynamic deformation modulus of coal under three-dimensional dynamic and static loading [J]. J. Min. Rock Form. Control Eng. 4 (04), 67–77.
Wang, X., Kang, H., and Gao, F. (2021). Numerical study on the formation of pressure arch in bolted gravel plate. Comput. Geotechnics 130 (2021), 103933. doi:10.1016/j.compgeo.2020.103933
Zhang, L., and Zhu, J. (2020). Analysis of mechanical strength and failure Morphology of prefabricated Closed cracked rock mass under uniaxial compression [J]. Geotechnical Geol. Eng. 38 (B6), 1–11.
Zhang, T., Liu, N., Pang, M., Zhang, X., Wang, X., and Zhang, X. (2021). Influence of temperature and stress on compaction deformation characteristics of broken coal and rock mass[J]. Coal Mine Saf. 52 (06), 58–64+71.
Zhang, T. (2013). Research on the anisotropy of rock mass mechanical parameter REV in underground cavern storage [D]. Wuhan: China University of Geosciences.
Zhang, Y., Xia, Z., Jiang, Y., Chen, M., Liu, J., and Yin, Q. (2020). Effect of Hole density and confining pressure on mechanical behavior of porous specimens: An Insight from Discrete Element modeling. Comput. Model. Eng. Sci. 125 (1), 259–280. doi:10.32604/cmes.2020.011076
Zhang, Z. (2011). Research on dimensional Effect of deformation modulus of underground Cavern rock mass [J]. J. Eng. Geol. 19 (05), 642–647.
Zhang, Z. (2009). Micro-characteristics of failure of non-penetrating fractured rock mass and determination method of its macro-mechanical parameters [D]. Xi’an: Xi’an University of Technology.
Zhao, L., Li, Z., Liu, G., Pang, X., and Tian, C. (2017). Study on parameter values of modified Mohr-Coulomb model for granite residual soil[J]. Railw. Constr. 17 (03), 89–92.
Keywords: size effect, characteristic size, parallel joint, secant modulus, characteristic secant modulus
Citation: Zhang J, Guo W, Fu Y, Feng Y, Wang Q, Hu G and Wang T (2022) Study on the size effect of the secant modulus of rocks containing multiple parallel joints. Front. Mater. 9:992133. doi: 10.3389/fmats.2022.992133
Received: 12 July 2022; Accepted: 03 October 2022;
Published: 24 October 2022.
Edited by:
Dongchan Jang, Korea Advanced Institute of Science and Technology (KAIST), South KoreaReviewed by:
Emanuele Reccia, University of Cagliari, ItalyJianyong Han, Shandong Jianzhu University, China
Yue Zhao, Shandong University of Science and Technology, China
Copyright © 2022 Zhang, Guo, Fu, Feng, Wang, Hu and Wang. This is an open-access article distributed under the terms of the Creative Commons Attribution License (CC BY). The use, distribution or reproduction in other forums is permitted, provided the original author(s) and the copyright owner(s) are credited and that the original publication in this journal is cited, in accordance with accepted academic practice. No use, distribution or reproduction is permitted which does not comply with these terms.
*Correspondence: Gaojian Hu, aHVnYW9qaWFuOEAxNjMuY29t