- 1School of Petroleum Engineering, China University of Petroleum (East China), Qingdao, China
- 2Ecole des Ponts ParisTech, Laboratoire Navier/CERMES, Paris, France
- 3Key Laboratory of Unconventional Oil & Gas Development (China University of Petroleum (East China)), Ministry of Education, Qingdao, China
- 4CNPC Chuanqing Drilling Engineering Co., Ltd., (CCDC), Chengdu, China
Modeling the hydration kinetics of oil well cement as a function of temperature is critical for offshore cementing projects related to natural gas hydrates. During this study, the heat release of oil well cement hydration in the temperature range between 5 and 30°C was monitored by isothermal calorimetry. The influence of the source of cement, water-to-cement (w/c) ratio, and CaCl2 on hydration kinetics was evaluated in great detail. Results indicated the temperature effect on cement hydration kinetics can be modeled by a scale factor derived from the apparent activation energy (Ea) of the cement reaction. Ea showed moderate dependence on the cement source and relatively little dependence on the w/c ratio and CaCl2 addition. By combining with previous experimental data, a function correlating Ea and temperature in a wide temperature range (5–87°C) was obtained.
Introduction
Offshore hydrocarbon resources account for 60% of global hydrocarbon resources, and 30% of these resources are distributed in deep water areas (Liu et al., 2017). Natural gas hydrate is often considered a hazard during deep-water well drilling and completion. Gas hydrate is an ice-like crystalline substance formed by natural gas and water under high pressure and low temperature (Sloan and Koh, 2007), which is mainly found in the deep-sea shallow sediments and provides mechanical integrity to the layer. However, gas hydrate stability is highly sensitive to environmental conditions, especially temperature. Offshore natural gas hydrates are usually buried at depths of 762–4,572 m (Reddy, 2008), where the formation temperature can range from 0 to 30°C (Wang et al., 2009; Wang et al., 2017). Once the temperature rises above 30°C, the gas hydrate will decompose into gas and liquid phases (Merey et al., 2021). In recent years, significant effort has been devoted to studying the potential of extracting natural gas hydrates as an energy resource. It is estimated that 90% of deep water resources exist in the form of natural gas hydrates (Chen et al., 2022). Cement slurry used in well completion can decompose natural gas hydrates due to the release of hydration heat during cement setting (Dillenbeck et al., 2003). The liberated gas molecules and high-pressure water molecules generated by the decomposition of natural gas hydrates can intrude into cement slurry to form channels, which will lead to the migration of gas and water and reduce the bonding strength between set cement and the formation. In severe cases, it will cause significant wellbore drilling accidents such as well leakage, well kick, well collapse, etc. Therefore, development of deep-water petroleum resources (building wells through gas hydrate zones) and natural gas hydrate resources (building wells into gas hydrate zones) both call for comprehensive studies on the effect of temperature on cement hydration kinetics and heat release.
Low temperature is the common feature for gas hydrate formation drilling and completion due to low seawater/seabed temperatures. For a given cement slurry, curing temperature is one of the most important factors affecting the hydration process (Lerch and Ford, 1948; Kjellsen and Detwiler, 1992; Escalante-Garcia, 2003; Mounanga et al., 2006; Elkhadiri et al., 2009; Pang et al., 2013a; Pang et al., 2013b) and the resulting microstructure (Gallucci et al., 2013; Bahafid et al., 2017; Gajewicz-Jaromin et al., 2019). The hydration rate of oil well cement is very slow at low temperatures (Lerch and Ford, 1948; Kjellsen and Detwiler, 1992; Escalante-Garcia, 2003; Mounanga et al., 2006; Elkhadiri et al., 2009), which can hinder the development of compressive strength (Reinas et al., 2011) and the static gel strength of cement paste. Slow hydration is detrimental to wellbore integrity and can increase the probability of fluid and gas migration (Tinsley et al., 1980; Sabins et al., 1982; Moon and Wang, 1999; Namkon et al., 2018). Therefore, the mechanical strength development rate of oil well cement under low temperatures is also a challenge that has to be overcome. Oil well cement accelerators can help reduce the waiting-on-cement (WOC) time during cementing and promote the strength development of cement-based materials, especially at low temperatures. Calcium chloride (CaCl2) has been used to improve the early compressive strength development of cement and shorten the setting time at low temperatures for many years, but a consensus about the mechanism of CaCl2 promoting the hydration of cement has not been reached. Pang et al. developed a scale factor model to simulate the influence of temperature on the hydration kinetics and property development of oil well cement (Pang et al., 2013c; Pang et al., 2020; Pang et al., 2021; Pang et al., 2022). It has been shown that the model can be employed to predict the temperature change of oil well cement when heat exchange with the environment is known (Pang et al., 2020). The model also worked well for cement slurries containing chloride accelerators, but the type of cement studied was relatively limited (only two API Class H cements), and the curing temperatures were all above 15°C (Pang et al., 2015). Jupe et al. (2007) observed a significant difference between the hydration of an API Class A cement and Class H cement under the effect of CaCl2 by in situ synchrotron X-ray diffraction studies. The accelerating effect of CaCl2 varied with the cement type and mineral components (Shideler, 1952; Shanahan et al., 2016).
During well cementing, cement hydration heat is the root cause of natural gas hydrate decomposition. Accurately measuring and modeling the evolution of cement hydration heat at low temperatures is of great significance for preventing gas hydrate decomposition. In recent years, many researchers have worked to develop algorithms that can accurately predict the temperature increase during cementing (Bittleston, 1990; Guillot et al., 1993; Davies et al., 1994). However, most studies only consider the heat exchange between the cement slurry and other media in the wellbore during the pumping process and ignore the key factor of cement hydration heat. Recently, Wang et al. (2019) developed a model considering the influence of cement hydration, but this model lacks low-temperature data and does not consider the effect of accelerators on hydration kinetics. Previous research on cement hydration kinetics has mainly focused on construction cement, and oil well cement hydration kinetics studies at temperatures below 30°C are relatively rare in the open literature. In addition, because of the limitations to testing equipment, few laboratories can obtain cement hydration heat data below 15°C. Therefore, obtaining data on cement hydration heat under the coupled effect of accelerators and low temperature is critical for modeling the transient temperature change of oil well cement.
In this study, a comprehensive investigation into the hydration heat release of API Class G oil well cement under low temperatures (5–30°C) was conducted by isothermal calorimetry. Effects of w/c ratios (0.3, 0.4, 0.5) and cement source (Aksu cement, Jiahua cement, and Dyckerhoff cement) on cement hydration were researched in detail. The dependence of apparent activation energy (Ea) on curing temperature, cement source, w/c ratio, and addition of CaCl2 was evaluated. Finally, the scale factor model was used to predict the effect of low temperatures on the hydration heat evolution of oil well cement with time.
Theoretical background
The hydration reaction of cement-based materials is accompanied by heat generation. The thermal power signal from cement hydration can be monitored in real time with an isothermal calorimeter. Due to the fact that the heat release rate of cement hydration is proportional to cement hydration rate, a large number of researchers have studied cement hydration by isothermal calorimetry (Pane and Hansen, 2005; Frølich et al., 2016; Sun et al., 2021a; Linderoth et al., 2021). The overall hydration degree of cement (
where
Cement hydration kinetics describe the evolution of
where Ea (apparent activation energy, kJ/mol) describes the sensitivity of the entire hydration reaction to temperature; R is the gas constant (8.314 J/(mol·K)); T refers to arbitrary temperature (K); Tr refers to the reference temperature (K). The specific method of calculating the scale factor includes the peak ratio method and the best fit method, which can be found in Pang et al. (2013c). Although Ea may be influenced by a number of different factors (Sun et al., 2021b), the use of a constant Ea with a scale factor model has been proven to be quite accurate in predicting the hydration kinetics of oil well cement systems with an error of less than 3% (Pang et al., 2021), possibly because the low C3A (3CaO·Al2O3) content reduced the system complexity.
Because the cement degree of hydration is proportional to heat evolution according to Eq. 1; the scale factor model discussed here can be directly applied to simulate the heat evolution of cement. If it is assumed that a mathematical function f can be used to describe cement hydration heat evolution under a reference curing temperature (Tr),
Then, the function of cement hydration heat at any arbitrary temperature (T) can be expressed by
where
In addition to the scale factor, a reaction rate constant (
Here, the rate constant could be parameters obtained by various cement hydration kinetics models or simply the peak hydration rate (Scherer et al., 2012; Pang and Meyer, 2016b; Pichler and Lackner, 2020; Pang et al., 2021). Previous studies found that the effect of certain accelerators and retarders (CaCl2, NaCl, KCl, and sucrose) on the cement hydration rate is similar to that of temperature and pressure, especially at relatively low concentrations (Pang et al., 2015; Sun et al., 2021b). Therefore, the hydration kinetic curve under the influence of arbitrary CaCl2 dosages can also be predicted by the scale factor model described by Eq. 3 and Eq. 4. In this case, Eq. 3 represents the hydration kinetics curve at a reference dosage of the accelerator, while Eq. 4 represents the hydration kinetics at an arbitrary dosage of accelerator. The corresponding scale factor (C) is calculated as follows:
where c is an arbitrary concentration/dosage of the accelerator; cr is the reference concentration/dosage of the accelerator;
It should be mentioned that modeling of the effect of CaCl2 on cement hydration kinetics would not be needed for simulating the transient temperature change of cement because the reference test will contain a pre-determined amount of CaCl2. The model is still given here to show that CaCl2 has a similar effect to temperature, which may be useful during the design of cement slurries used at low temperatures.
Materials and methods
Materials
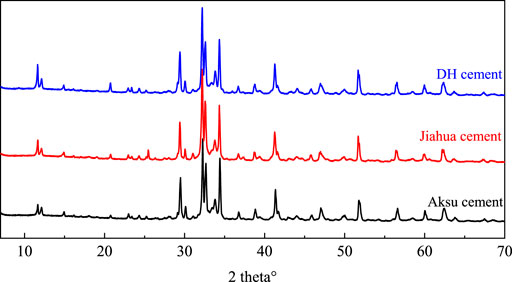
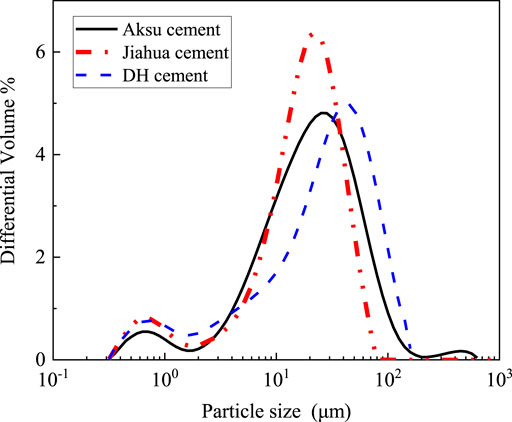
API Class G oil well cements from three different manufacturers were used in this study: Aksu (A) cement was purchased from Aksu cement factory, Xinjiang, China; Jiahua (J) cement was purchased from Jiahua Special Cement Co., Ltd., Sichuan, China; Dyckerhoff (DH) cement was provided by Dyckerhoff Deutschland-Buzzi Unicem company, Wiesbaden, Germany. The mineral composition of the three cements by X-ray diffraction (XRD, Rietveld analysis) is listed in Table 1, and the XRD profiles are shown in Figure 1. The particle size distribution (PSD) diagram for different cements based on the ethanol dispersion method by using a laser particle size analyzer (Model: 2000, Malvern, UK) is shown in Figure 2. The results of the median particle size and specific surface area (SSA) estimated by the PSD measurements for different cements are summarized in Table 1. Aksu cement has the smallest median particle size compared to the other two cements. There is little difference in the SSA of cements from different manufacturers. The theoretical hydration heat (Q0) of fully reacted cements calculated using a previously developed method shown by Eq. 8 (Taylor, 1997) is also listed in the Table.
where pi is the original weight fraction of phase i in the anhydrous cement.

TABLE 1. Estimated main compound compositions (mass percentage) and other properties of different types of cements.
During this study, CaCl2 (provided by Sinopharm Group Chemical Reagent Co., Ltd.) was added as an accelerator to promote low-temperature hydration. To ensure that the cement slurry has good sedimentation stability and good mixability, small amounts of several other chemical additives were added to the slurry, which included the suspension aid (diutan gum), dispersant (20% activity, BCD-210 L), and defoamer (G603). More detailed information about these additives can be found in our recent study (Pang et al., 2021).
Slurry preparation
Slurries used in this study were prepared using a Waring laboratory blender (Model: NHJJ, by Nithons Technology Co., Ltd.) with tap water, according to the American Petroleum Institute standard procedure (API RP10B-2) at room temperature (approximately 25°C) (API RP 10B-2, 2013). For both Aksu cement and Jiahua cement, the w/c ratios studied included 0.3, 0.4, and 0.5; for Dyckerhoff cement, the w/c ratio was 0.4. Detailed slurry compositions are shown in Table 2, where the w/c ratio is indicated by the slurry name for easy identification. For example, “A3” stands for Aksu cement slurry with a w/c ratio of 0.3.
Isothermal calorimetry test
An isothermal calorimeter (purchased from USA Calmetrix, model: I-Cal Ultra) was used to measure the thermal power evolution of a cement slurry at curing temperatures of 15, 20, 25, and 30°C, respectively, following standard test procedures (ASTM C1679-09) (ASTM C1679, 2009). The calorimeter was calibrated using inert samples (about 5 g of deionized water), following standard procedures for each new temperature. The calibration derives the proportionality constant and the baseline, which are automatically applied during subsequent tests. The test sample was transferred to a plastic vial and placed inside the calorimeter within 5 min after the dry cement materials and water were mixed during each test. The mass of the sample to be added in the plastic vial varied with w/c to ensure the total heat capacity was balanced with the reference. In other words, the mass of the sample was approximately 13.5 g for 0.3 w/c slurry, 12.0 g for 0.4 w/c slurry, and 11.0 g for 0.5 w/c slurry. For this type of sample, the calorimeter has a time constant of approximately 300 s, which is much smaller than the time scale of the main cement hydration peak (at least 10 h). The data obtained during the first 1 h of the IC test were removed to account for the time needed to reach the temperature equilibrium between the sample and the testing instrument. It is known that the hydration heat generated during this period is also very small (Pang et al., 2015).
During this study, a calorimeter for low temperature testing (MicroDSC by Setaram™, France) was employed to monitor the cement hydration heat release at 5°C. The equipment contains a test cell and a reference cell made of stainless steel. A cement slurry sample of approximately 0.5 g was introduced into a secondary container (a small glass test tube) before being loaded into the test cell and sealed with an O-ring. In the reference cell, the glass test tube was filled with about 0.18 g water instead. A baseline test was run with both glass test tubes (in the test cell and the reference cell) filled with water using the same testing procedures as a real test. The baseline was manually subtracted from the thermal power test data. More detailed information about sample preparation and instrument operation can be found in our recent study (Pang et al., 2021).
Results and discussion
Heat evolution of cement for different manufacturers at low temperatures
As most previous studies of oil well cement hydration kinetics focused on high curing temperatures (Pang et al., 2013a; Pang et al., 2013b; Pang et al., 2013c), the effect of temperature on the hydration of oil well cement at temperatures below 30°C needs to be further studied. The thermal power evolution for different cement slurries with a w/c ratio of 0.4 (i.e., A4, J4, and DH4) in the range from 5°C to 30°C is shown in Figure 3. As expected, higher temperatures promote the growth of the main peak and shorten the duration of the acceleration period. This phenomenon is similar to previous findings on the effect of temperature (15–60°C) on cement hydration without CaCl2 (Pang et al., 2021).
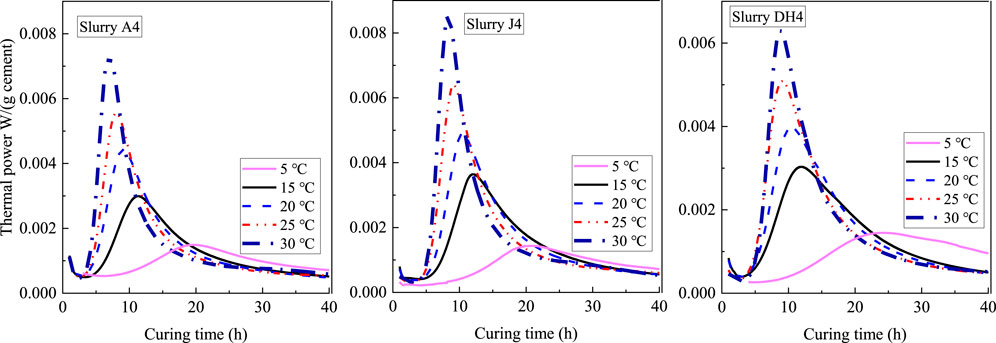
FIGURE 3. Thermal power evolution for different cements under low temperatures (dosage CaCl2=1%, w/c=0.4).
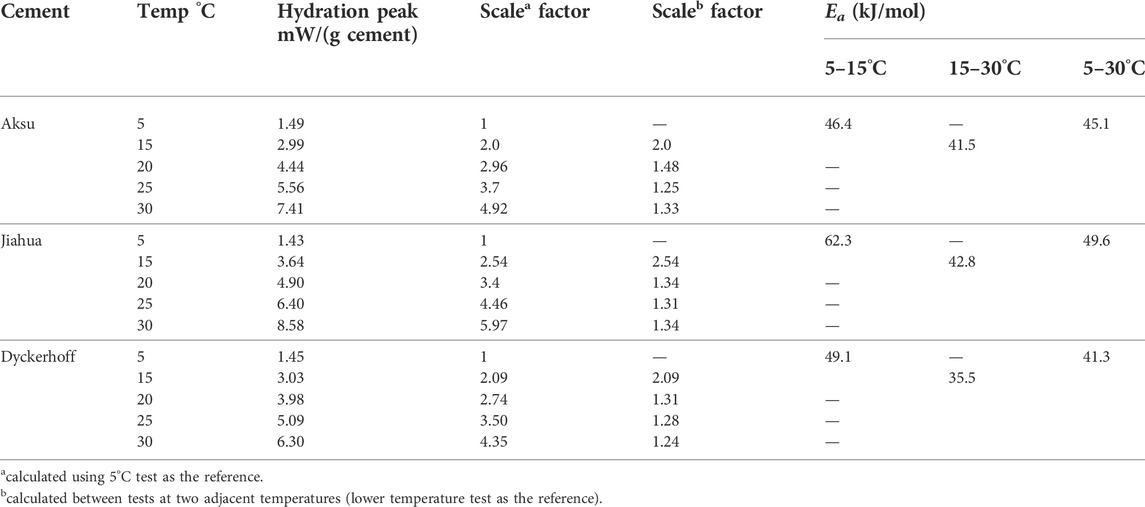
As mentioned earlier, the heat evolution curves under an arbitrary temperature can be predicted by using a reference curve and a scale factor. In this study, the scale factors were obtained by calculating the ratios of the hydration peak between two different tests. Table 3 lists the peak hydration rates and the scale factor model parameters under low temperatures for different slurries with CaCl2, where the scale factors were derived using both a constant reference and a variable reference. It should be noted that any test may be selected as the reference test. If the test results at 15°C were selected as the reference, the scale factors (C) derived for different cements at 25°C varied within a very small range from 1.68 to 1.85. These values were almost equal to previous studies of Class H cement (C=1.75), when the same temperature range and the same dosage of the CaCl2 (1% by weight of cement) accelerator were considered (Pang et al., 2015).
The apparent activation energy (Ea) is a useful parameter for correlating temperature and cement hydration kinetics because it can provide information about the sensitivity of the rate of the cement hydration reaction to temperature. Table 3 also lists Ea estimates for different cements in the temperature range from 5 to 30°C. Ea between 5°C and 15°C was directly calculated from the scale factor according to Eq. 2. Ea in wider temperature ranges (15–30°C and 5–30°C) was estimated by linear regression analysis using multiple data points based on Eq. 5 (Figure 4). In the temperature range from 15 to 30°C, the Ea of Aksu cement and Jiahua cement showed excellent agreement with each other and with the values in the literature (Pang et al., 2021), while the Ea of Dyckerhoff cement was obviously lower. When test results at 5°C were also considered, the Ea calculated by linear regression analysis increased for all three cements tested. The magnitude of increase was more significant for Jiahua cement and Dyckerhoff cement than that for Aksu cement. In the temperature range from 5 to 15°C, the difference in Ea between Aksu cement and Dyckerhoff cement was relatively small, while the Ea of Jiahua cement was obviously higher, and the Ea calculated from different cements was significantly higher than that obtained in the range of 15–30°C. These test results suggest that Ea decreases with increasing curing temperature, which is consistent with many previous studies about cement without CaCl2 (Pang et al., 2013b; Pang et al., 2013c; Pang et al., 2021). The results also indicate that the sources of cement have little to moderate influence on Ea, when similar temperature ranges are considered. The most significant difference was observed for Jiahua cement in the temperature range of 5–15°C.
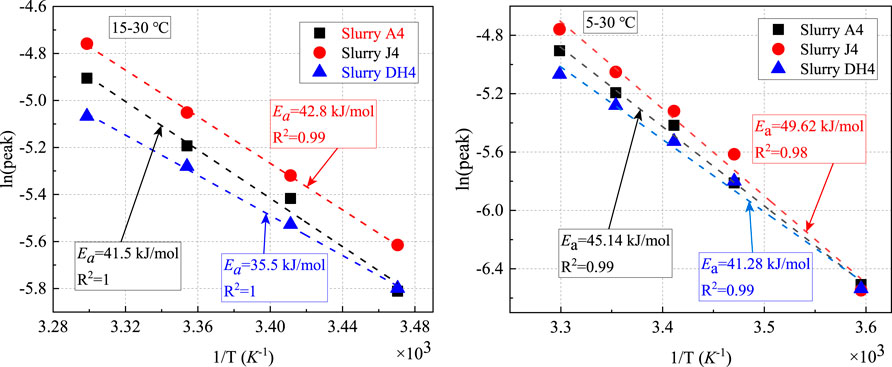
FIGURE 4. Ea obtained by linear regression analysis using hydration peak data under low temperatures (w/c=0.4, CaCl2 dosages=1.0%).
The cumulative heat evolution curves of different cement slurries under the effect of low temperatures are shown in Figure 5. For the same slurry, the cumulative heat hydration at any given time generally increased with the increasing curing temperature during the entire test period. At curing temperatures of 25 and 30°C, the cumulative hydration heat was near constant at the end of 7 days, while at lower curing temperatures, hydration still progressed at significant rates at the end of the tests.
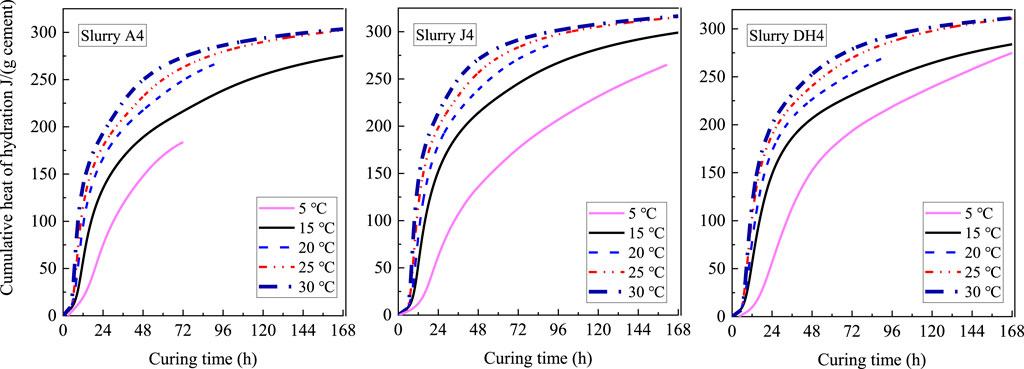
FIGURE 5. Influence of low temperatures on cumulative heat evolution of cements from different manufacturers. (w/c=0.4).
The influence of low temperature on the ultimate cumulative heat (curing time=7 d) for different cement slurries is presented in Figure 6. The cumulative hydration heat at 30°C and 7 days for different cements varied within a very small range from 303.4 J/(g cement) to 316.5 J/(g cement). The degree of hydration calculated by Eq. 1 was within the range of 71.5 ± 1.5% for different cements (Taylor, 1997; Pang et al., 2022). For the same cement, the differences between cumulative hydration heat at 25°C and that at 30°C were less than 0.4% at the end of 7 days. However, relatively significant increases in cumulative hydration heat (at 7 d) with increasing temperature were observed from 5°C to 15°C and from 15°C to 25°C, and the amount of increase varied widely between different cements. Combined with Figure 3, Figure 5, and Figure 6, it can be inferred that the effect of temperature can significantly increase the peak of thermal power in the temperature range considered in this study but has little effect on the cumulative hydration heat for the later hydration stage when the temperature is higher than 15°C. This effect was similar to that of CaCl2, which mainly affects the peak of the heat release rate and had little effect on the long-term strength of cement, as observed in previous studies (Thomas et al., 2009; Cheung et al., 2011; Chen et al., 2020).
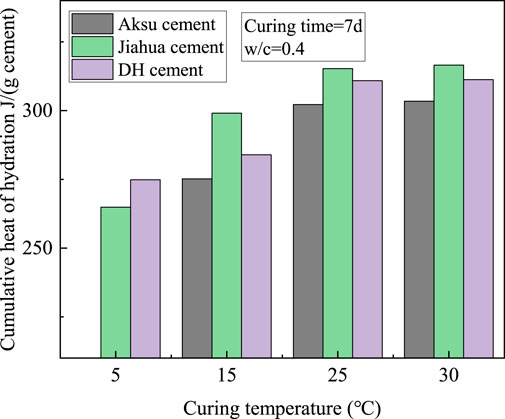
FIGURE 6. Coupled influence of temperature and the CaCl2 accelerator on cumulative heat (curing time=7 days) for different cements.
The assumption of the scale factor model is that the shape of the hydration mechanism profile (thermal power vs. cumulative hydration heat) under different curing conditions for a given slurry is similar (Pang et al., 2013a). Therefore, the effect of low temperatures on the hydration kinetics of different cements can be more clearly understood by analyzing the hydration mechanism profiles. It can be seen from Figure 7 (left) that the hydration mechanism profiles under various temperatures have similar shapes for a given cement; after normalizing the thermal power by its peak, it can be seen that the curves drawn by normalized thermal power and cumulative heat of hydration almost overlap during the acceleration period but deviate slightly from each other during the deceleration period (see in Figure 7 (right)). Interestingly, the hydration mechanism curves of Jiahua cement agree with those of Dyckerhoff cement.
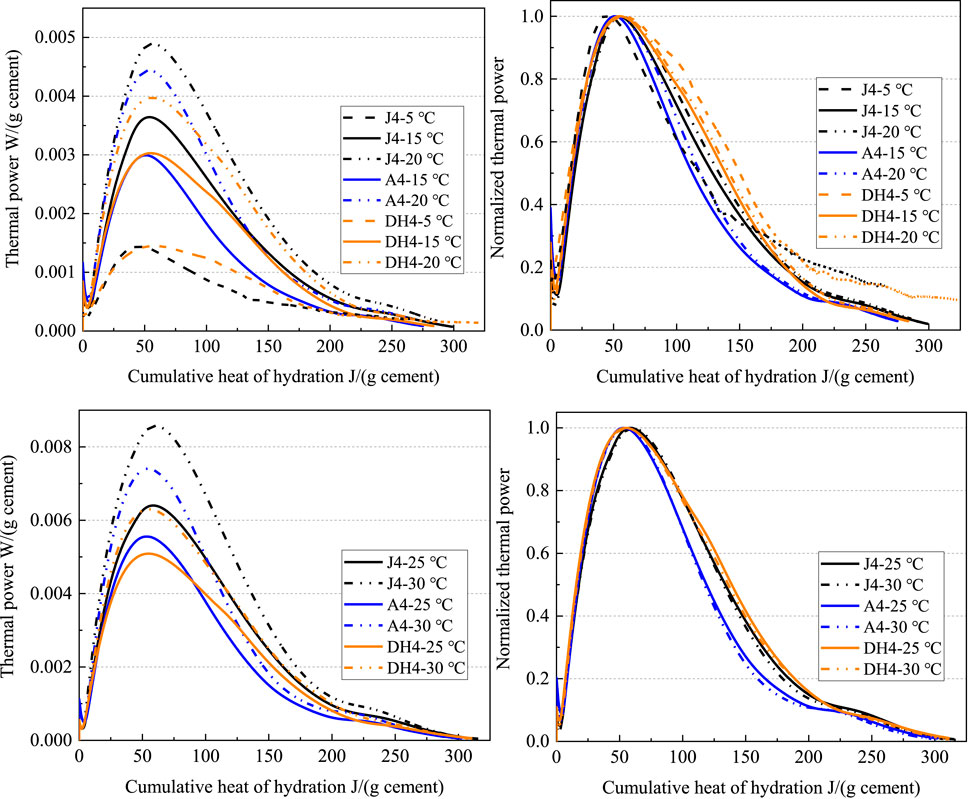
FIGURE 7. Thermal power vs. cumulative hydration heat before (left) and after (right) normalized different Class G cements.
Heat evolution behavior of cements with different w/c ratios
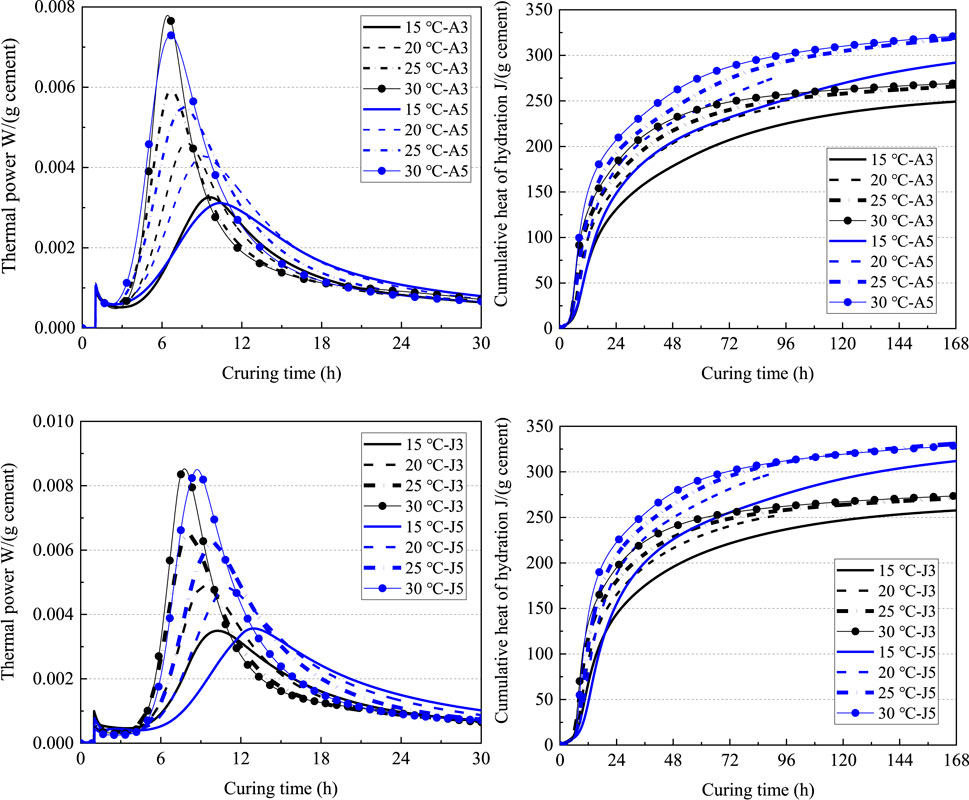
In offshore cementing operations, with the increase of the wellbore depth, the cement slurry undergoes a low-high-low temperature change, and its density needs to be adjusted according to the wellbore condition. If the density of the cement slurry is too low, it cannot balance the formation pressure, which will cause wellbore collapse; if the density is too high, it is likely to cause leakage of the wellbore by fracturing the formation. Adjusting the density of the cement slurry is generally achieved by tuning w/c ratios. Figure 8 presents heat evolution from cements with different w/c ratios in the range of 15–30°C. The cement slurry was prepared based on the formula in previous studies (Pang et al., 2021; Pang et al., 2022) but using CaCl2 as the accelerator. As shown in Figure 8, with the increase in the w/c ratio, the time it took for the heat release rate to reach the peak decreased slightly. The cumulative heat of hydration at the end of the curing period (168 h) increased with increasing water content in the slurry, and the percentage of increase ranged between 17 and 22% when the w/c ratio was increased from 0.3 to 0.5.
Figure 9 shows the hydration mechanism profiles for different w/c ratios overlapped below 25 J/(g cement). With further hydration, the hydration mechanism profiles with a higher w/c ratio shift to the right, and this shift becomes greater after the main peak. As can be observed from Figure 8, the heat release rate of the slurry with a higher w/c ratio decreases more slowly during the deceleration stage, which eventually leads to the higher cumulative hydration heat at a longer time. The reasons for this are as follows: 1) the water in the slurry is gradually consumed during the hydration, and the slurry with a lower w/c ratio has less free water to meet the demand of further reaction; 2) with the growth of hydration products, the slurry with a lower w/c ratio has much less available space for growth.
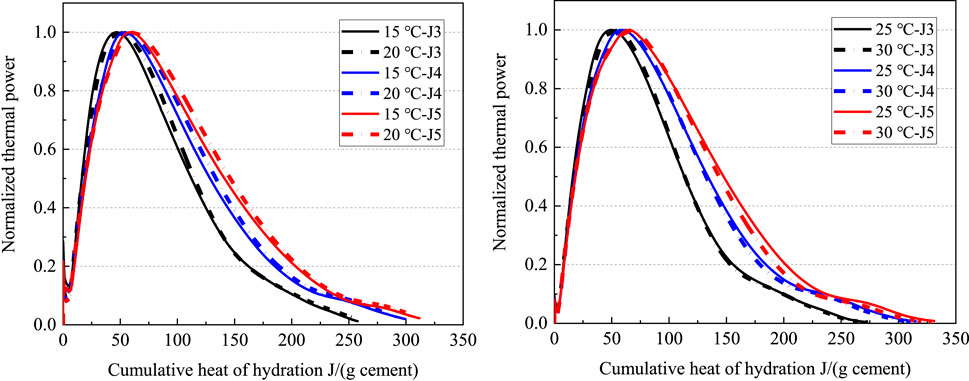
FIGURE 9. Thermal power vs. cumulative heat of hydration after normalization (Jiahua Class G cement).
Figure 10 shows the dependence between w/c ratios and Ea obtained from linear regression analysis based on Eq. 2 for different cements in the temperature range from 15 to 30°C. Figure 10A shows that Ea are almost equal for cements with different w/c ratios, at the same temperature and the same dosage of CaCl2. Similarly, w/c ratios had almost no influence on Ea of Jiahua cement (see Figure 10B). Ea calculated by linear regression analysis ranged from 41.5 kJ/mol to 43.0 kJ/mol for Jiahua cement and from 40.7 kJ/mol to 42.8 kJ/mol for Aksu cement. In summary, the w/c ratios of the cement slurry have little to no influence on Ea.
Influences of CaCl2 dosages on hydration kinetics
Figure 11 illustrates the difference in hydration curves for Aksu cement with w/c ratios from 0.3 to 0.5 at 15 and 30°C before and after adding CaCl2. With the addition of CaCl2, while a similar increase in the hydration peak was observed at all test conditions (different w/c ratios and different temperatures), the cumulative heat evolution exhibited different behaviors; the increase in cumulative heat evolution was apparently more dramatic at higher w/c ratios and 15°C due to continuously accelerated hydration at later stages. CaCl2 had almost no effect on final heat evolution at 30°C and 7 days because the curves plateaued earlier.
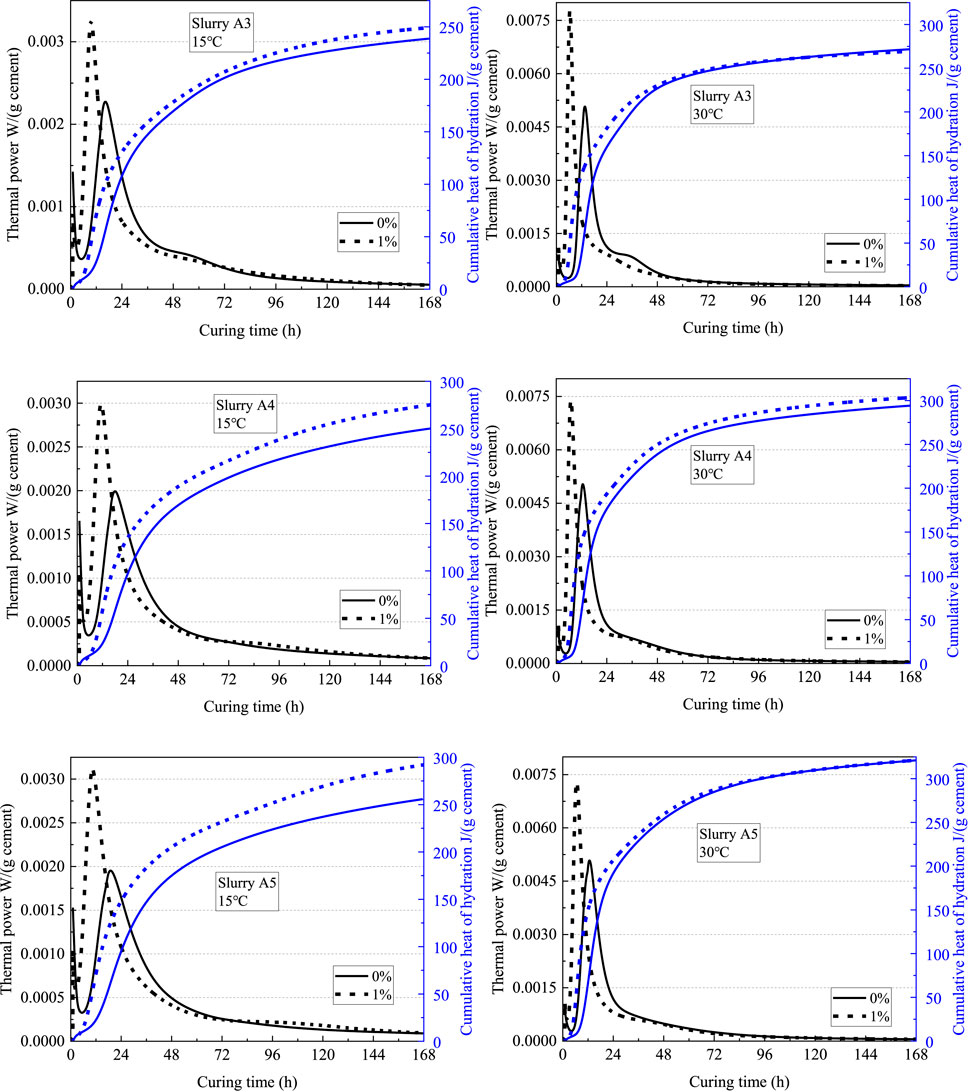
FIGURE 11. Effect of CaCl2 dosages on the heat evolution curve for Aksu cement (left: 15°C; right: 30°C).
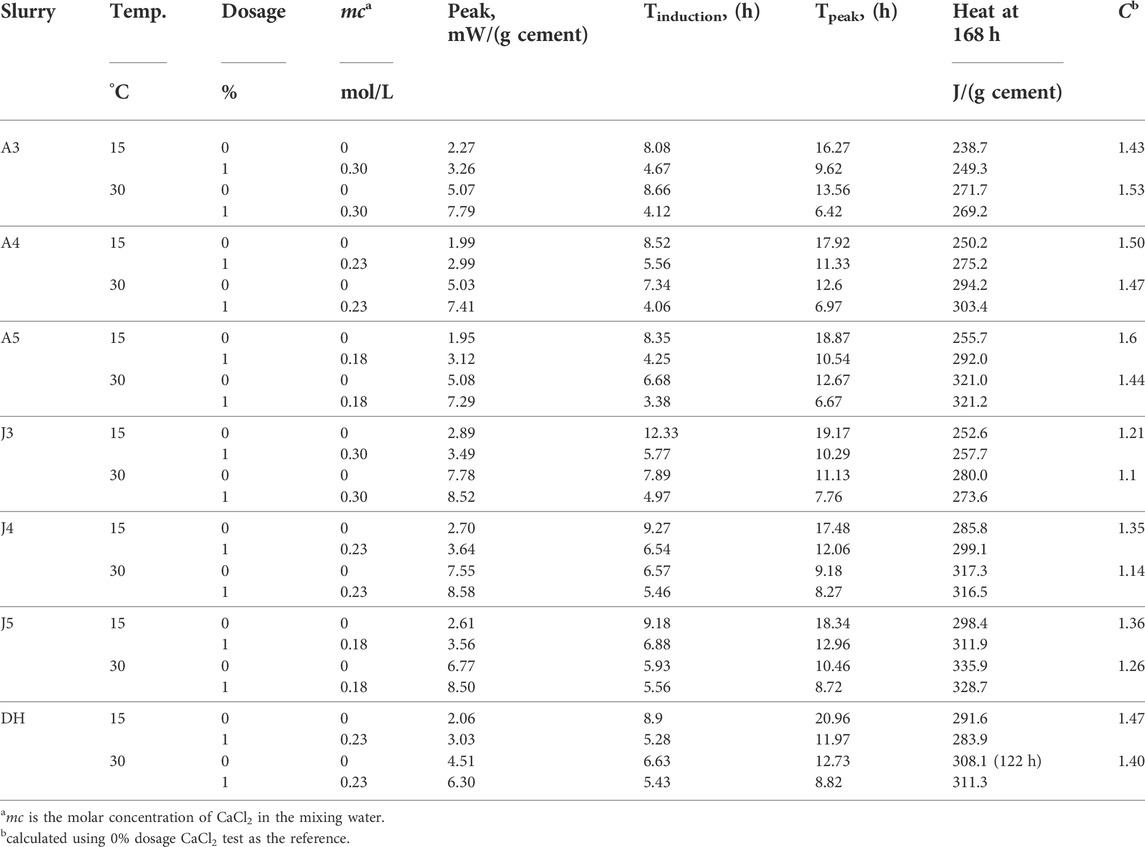
Table 4 and Figure 12 show the effects of cement source, w/c ratios, and CaCl2 dosages on hydration kinetic parameters. tI (induction time) and tP (time to main peak) of all slurries decreased significantly when the CaCl2 dosage was increased from 0.0% up to 1.0%. Induction time was determined by the intercept of two tangent lines obtained from the heat rate data: one during the induction period and the other during the early stage of the acceleration period (Pang et al., 2021). For Aksu cement, the reductions in tI and tP with the addition of CaCl2 showed very little dependence on the curing temperature and w/c ratio and averaged out to 3.6 and 6.7 h, respectively; for Jiahua and Dyckerhoff cements, the reductions in tI and tP with the addition of CaCl2 decreased significantly with curing temperature, and a strong dependence on the w/c ratio was also observed. The scale factor equals the ratio of the thermal power peaks and measures the strength of acceleration caused by CaCl2. As shown in Table 4, the scale factor associated with CaCl2 acceleration was found to be dependent on the cement source but generally independent of the curing temperature and w/c ratio (C = 1.50 ± 0.06 for Aksu cement, 1.24 ± 0.11 for Jiahua cement, and 1.44 ± 0.05 for Dyckerhoff cement). However, an apparent decrease in C with temperature was observed for Jiahua cement at all three w/c ratios studied. In a previous study, the scale factor was found to be mainly a function of the molar concentration of CaCl2 (Pang et al., 2015), while in this study, it seemed to be more closely related to CaCl2 dosage by weight of cement. The addition of CaCl2 increased the cumulative heat evolution at 15°C/7 days (the amount of change increased with increasing w/c) but had very little effect on the cumulative heat evolution at 30°C/7 days.
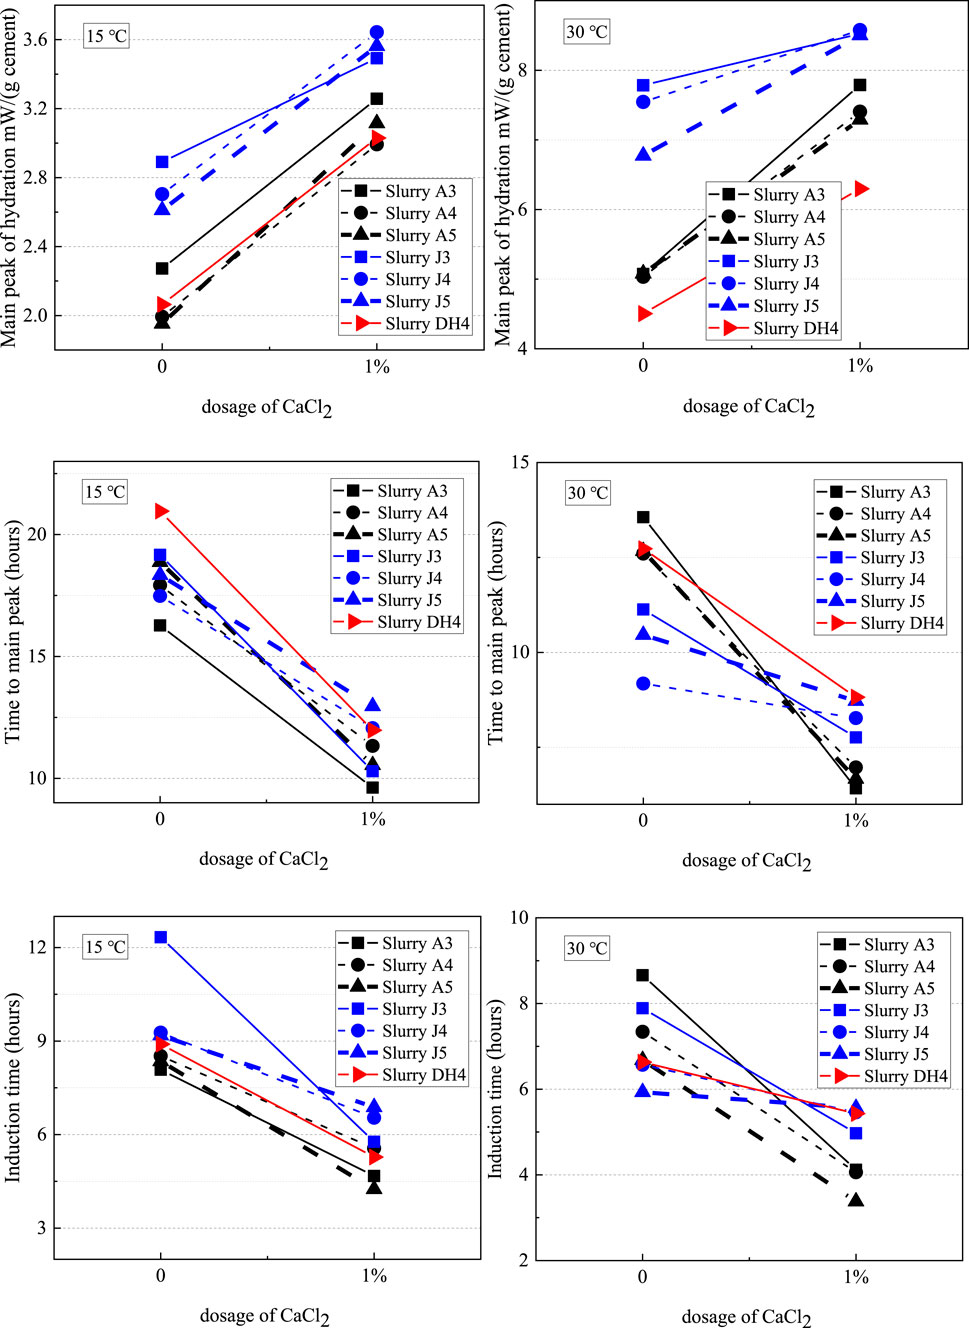
FIGURE 12. Effects of the cement source, w/c ratios, and CaCl2 dosages on hydration kinetic parameters.
Figure 13 shows the hydration mechanism profiles of different cement slurries before and after adding calcium chloride. After the addition of CaCl2, the normalized rate decreased at a faster speed after the peak as the hydration reaction proceeded, which is consistent with our previous study (Pang et al., 2015). Such a change in hydration behavior seemed to be more significant for Dyckerhoff cement than for Aksu cement and Jiahua cement; the shoulder peak typically associated with sulfate depletion was completely removed by the addition of CaCl2. Therefore, this phenomenon of reduced relative rate during the post peak period may be associated with delayed or advanced (reacted during the pre-induction period) reactions of the aluminate phases. Figure 13 also shows the hydration mechanism profiles during the acceleration stage nearly overlapped for different curing temperatures and for different w/c ratios, suggesting that cement hydration followed the same mechanism during this stage. However, the peaks and hydration mechanism profiles of the deceleration period shifted slightly to the right at higher temperatures as well as for higher w/c ratios, which were consistent with previous studies of Aksu cement without CaCl2 (Pang et al., 2021).
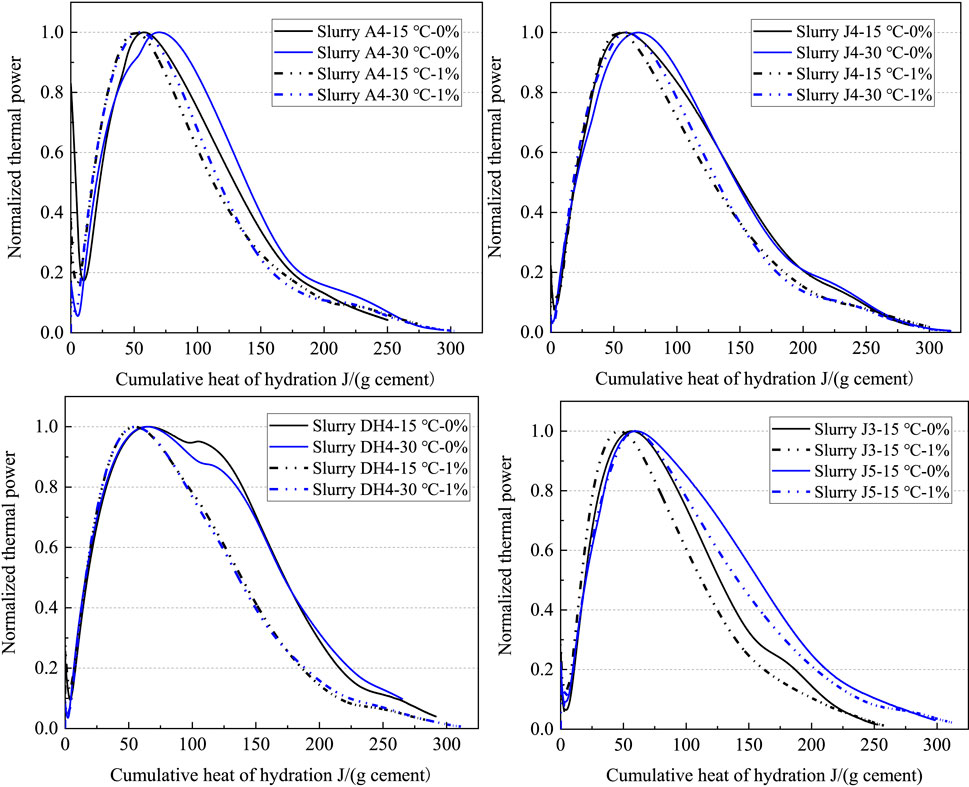
FIGURE 13. Influence of the CaCl2 accelerator concentration on the hydration mechanism profiles for different slurries (solid line: 0.0%; dotted line: 1.0%).
Model application
Examples of using the scale factor model (expressed by Eq. 3 and Eq. 4) to simulate the cumulative heat evolution curves for different cements (with a w/c ratio of 0.4 and 1.0% of CaCl2 dosage) in the range from 5°C to 30°C are provided in Figure 14. The cumulative heat release curves predicted using experimental curves at 15°C of the same slurry agreed very well with the measured curves, especially during the early stages. The errors in the cumulative heat evolution between experimental data and predicted data for all temperature tests at the end of the tests were within 2.2%, except for 5°C (for which the error was 6.0–13.4%). It seemed that the model tended to underestimate the long-term hydration extent at 5°C, which may be caused by more significant changes in the hydration mechanism between the temperature range of 5°C and 15°C.
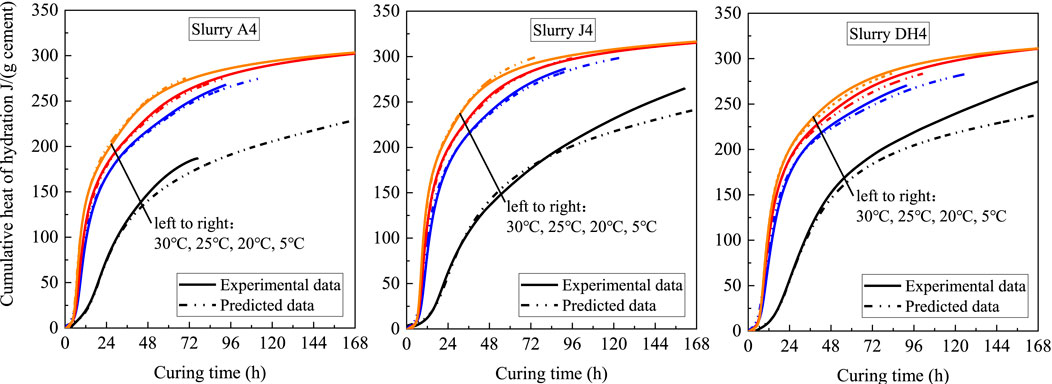
FIGURE 14. Experimental and predicted hydration heat evolution curves of different cements under low temperatures (15°C tests as references).
Figure 15 shows the predicted experimental results under the influence of CaCl2 using the hydration kinetics curve without an accelerator as a reference curve, according to the scale factor model (Eqs 3, 4, and 6). The experimental and predicted cumulative heat evolution curves agreed very well at both temperatures. Compared with the predicted results under the influence of temperatures, there were more significant differences between experimental and predicted cumulative heat evolution curves during the deceleration period. It can be inferred that CaCl2 changes the hydration mechanism of cement during the deceleration stage of hydration. The hydration mechanism profiles under the effect of CaCl2 dosage presented in Figure 13 also prove this conjecture.
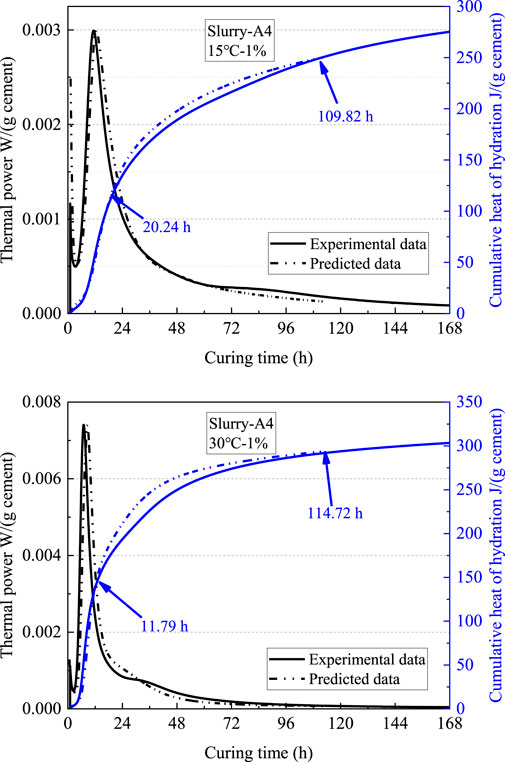
FIGURE 15. Experimental and predicted cement hydration heat evolution under the effect of CaCl2 for Aksu cement (w/c=0.4).
Dependences of Ea on curing temperature
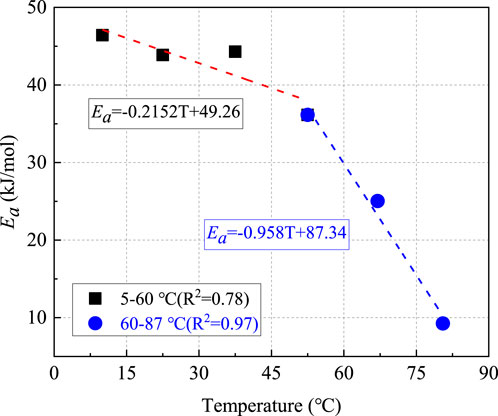
Since Ea is one of the most important parameters of the scale factor model, it is highly critical to evaluate its dependence on curing temperatures. As mentioned in Heat evolution behavior of cements with different w/c ratios Section, the addition of CaCl2 had little effect on the sensitivity of hydration to temperature. Therefore, the correlations between Ea and curing temperatures in a wider temperature range can be further investigated using experimental results obtained in this study and those obtained from a previous study (without the addition of CaCl2) (Pang et al., 2021). Figure 16 showed the relationship between Ea obtained by Eq. 5 and the curing temperature of Aksu cement in the range from 5°C to 87°C. Apparently, Ea decreased with increasing curing temperature, suggesting that the temperature sensitivity of the overall cement hydration reaction became weaker with the increase in curing temperature. The analysis of the effect of temperature on Ea was divided into two intervals: 5–60°C and 60–87°C. For both intervals, approximate linear correlations were obtained between Ea and curing temperatures. The rate of reduction (i.e., the slope of the linear fit) in Ea was relatively small (0.215 kJ/mol/°C) in the lower temperature interval of 5–60°C, which was more than quadrupled (0.958 kJ/mol/°C) in the higher temperature interval of 60–87°C. The rate of reduction in the lower temperature range is in reasonable agreement with that used by Hernandez-Bautista et al. (2016) in the temperature range of 23–60°C (0.189 kJ/mol/°C). The dependence of Ea on curing temperature is known from a number of previous studies (Pang et al., 2013a; Pang et al., 2013b; Pang et al., 2013c; Sun et al., 2021a; Pang et al., 2021; Pang et al., 2022). Generally, a constant Ea is convenient (and often accurate enough) to simulate cement hydration kinetics variations in a narrow temperature range (Matthieu et al., 2012; Pang et al., 2013a; Pang et al., 2013b; Martinelli et al., 2013; Maruyama and Lura, 2019; Sun et al., 2021a; Pang et al., 2022), a variable Ea (Pang et al., 2021), or a reference test at variable temperatures (Pang et al., 2020) would be required to simulate cement hydration kinetics variations in a wide temperature range.
Conclusion
The influences of curing temperature, water-to-cement (w/c) ratio, CaCl2, and sources of cement on the hydration of Class G oil well cement were investigated experimentally by isothermal calorimetry. The influences of curing temperature and CaCl2 on hydration kinetics were simulated based on a scale factor model developed previously. The following conclusions can be drawn:
1) The changes in induction time (tI) and time to hydration peak (tP) with the addition of CaCl2 showed strong dependence on the cement source; the scale factor associated with CaCl2 acceleration was also dependent on the cement source but generally independent of curing temperature and w/c ratios;
2) In addition to increasing the reaction rate, CaCl2 has little influence on the hydration mechanism of cement during the acceleration stage but changes the reaction mechanism significantly during the deceleration stage of hydration;
3) The apparent activation energy (Ea) of the cement hydration reaction, which represents the temperature sensitivity of the hydration reaction rate, decreased with increasing curing temperature; the rate of decrease is about 0.215 kJ/mol/°C between 5°C and 60°C, which increased to 0.958 kJ/mol/°C between 60 and 87°C.
4) Within the range investigated during this study, w/c ratios and addition of CaCl2 all appear to have little to no influence on Ea of the cement, while the cement source has a moderate influence on Ea.
Data availability statement
The original contributions presented in the study are included in the article/Supplementary Material; further inquiries can be directed to the corresponding author.
Author contributions
LS: investigation, formal analysis, data curation, writing—original draft, and project administration. XP: conceptualization, methodology, writing—review and editing, supervision, and funding acquisition. HY: investigation and writing—review and editing.
Funding
Financial support comes from the China National Natural Science Foundation (No. 51974352) and from the China University of Petroleum (East China) (Nos. 2018000025 and 2019000011).
Conflict of interest
HY was employed by the company CNPC Chuanqing Drilling Engineering Co., Ltd., (CCDC).
The remaining authors declare that the research was conducted in the absence of any commercial or financial relationships that could be construed as a potential conflict of interest.
Publisher’s note
All claims expressed in this article are solely those of the authors and do not necessarily represent those of their affiliated organizations, or those of the publisher, the editors, and the reviewers. Any product that may be evaluated in this article, or claim that may be made by its manufacturer, is not guaranteed or endorsed by the publisher.
References
ASTM C1679 (2009). Standard practice for measuring hydration kinetics of hydraulic cementitious mixtures using isothermal calorimetry. West Conshohocken, PA: ASTM International.
Bahafid, S., Ghabezloo, S., Duc, M., Faure, P., and Sulem, J. (2017). Effect of the hydration temperature on the microstructure of Class G cement: C-S-H composition and density. Cem. Concr. Res. 95, 270–281. doi:10.1016/j.cemconres.2017.02.008
Bittleston, S. H. (1990). “A two-dimensional simulator to predict circulating temperatures during cementing operations,” in SPE annual technical conference and exhibition (New Orleans: Louisiana), 23–26.
Chen, H., Feng, P., Ye, S., Li, Q., Hou, P., and Cheng, X. (2020). The influence of inorganic admixtures on early cement hydration from the point of view of thermodynamics. Constr. Build. Mater. 259, 119777. doi:10.1016/j.conbuildmat.2020.119777
Chen, Y., Li, Y., and Zhang, H. (2022). “Novel cementing Technology for deepwater hydrate layer,” in Offshore Technology Conference Asia, Kuala Lumpur, Malaysia, March 22–25, 2022.
Cheung, J., Jeknavorian, A., Roberts, L., and Silva, D. (2011). Impact of admixtures on the hydration kinetics of Portland cement. Cem. Concr. Res. 41 (12), 1289–1309. doi:10.1016/j.cemconres.2011.03.005
Davies, S. N., Gunningham, M. M., Bittleston, S. H., Guillot, F., and Swanson, B. W. (1994). Field studies of circulating temperatures under cementing conditions. SPE Drill. Complet. 9, 12–16. doi:10.2118/21973-pa
Dillenbeck, R. L., Heinold, T., Rogers, M. J., and Mombourquette, I. G. (2003). The effect of cement heat of hydration on the maximum annular temperature of oil and gas wellsect of cement heat of hydration on the maximum annular temperature of oil and gas wells. SPE Drill. Complet. 18, 284–292. doi:10.2118/87326-pa
Elkhadiri, I., Palacios, M., and Puertas, F. (2009). Effect of curing temperature on cement hydration. Cearmics 53 (2), 65–75.
Escalante-Garcia, J. I. (2003). Nonevaporable water from neat OPC and replacement materials in composite cements hydrated at different temperatures. Cem. Concr. Res. 33 (11), 1883–1888. doi:10.1016/s0008-8846(03)00208-4
Frølich, L., Wadsö, L., and Sandberg, P. (2016). Using isothermal calorimetry to predict one day mortar strengths. Cem. Concr. Res. 88, 108–113. doi:10.1016/j.cemconres.2016.06.009
Gajewicz-Jaromin, A. M., McDonald, P. J., and Scrivener, K. L. (2019). Influence of curing temperature on cement paste microstructure measured by 1HNMR relaxometry. Cem. Concr. Res. 122, 147–156. doi:10.1016/j.cemconres.2019.05.002
Gallucci, E., Zhang, X., and Scrivener, K. L. (2013). Effect of temperature on the microstructure of calcium silicate hydrate (C-S-H). Cem. Concr. Res. 53, 185–195. doi:10.1016/j.cemconres.2013.06.008
Guillot, F., Boisnault, J. M., and Hujeux, J. E. (1993). “A cementing temperature simulator to improve field practice,” in SPE/IADC drilling conference, Amsterdam, Netherlands, 22–25.
Hernandez-Bautista, E., Bentz, D. P., Sandoval-Torres, S., and Cano-Barrita, P. d. J. (2016). Numerical simulation of heat and mass transport during hydration of Portland cement mortar in semi-adiabatic and steam curing conditions. Cem. Concr. Compos. 69, 38–48. doi:10.1016/j.cemconcomp.2015.10.014
Jupe, A. C., Wilkinson, A. P., Luke, K., and Funkhouser, G. P. (2007). Slurry consistency and in-situ synchrotron X-ray diffraction during the early hydration of Portland cements with calcium chloride. J. Am. Ceram. Soc. 90, 2595–2602. doi:10.1111/j.1551-2916.2007.01806.x
Karakosta, E., Lagkaditi, L., ElHardalo, S., Biotaki, A., Kelessidis, V., Fardis, M., et al. (2015). Pore structure evolution and strength development of G-type elastic oil well cement. A combined 1H NMR and ultrasonic study. Cem. Concr. Res. 72, 90–97. doi:10.1016/j.cemconres.2015.02.018
Kjellsen, K. O., and Detwiler, R. J. (1992). Reaction kinetics of Portland cement mortars hydrated at different temperatures. Cem. Concr. Res. 22 (1), 112–120. doi:10.1016/0008-8846(92)90141-h
Lerch, W., and Ford, C. L. (1948). Long-time study of cement performance in concrete. J. Proc. 44 (4), 745–796.
Linderoth, O., Wadsö, L., and Jansen, D. (2021). Long-term cement hydration studies with isothermal calorimetry. Cem. Concr. Res. 141, 106344. doi:10.1016/j.cemconres.2020.106344
Liu, H., Li, Z., and Huang, Y. (2017). “Ultra deepwater cementing development and field applications in Western south china sea,” in SPE Middle East oil & gas show and conference.
Ma, S., and Kawashima, S. (2019). A rheological approach to study the early-age hydration of oil well cement: Effect of temperature, pressure and nanoclay. Constr. Build. Mater. 215, 119–127. doi:10.1016/j.conbuildmat.2019.04.177
Martinelli, E., Koenders, E. A. B., and Caggiano, A. (2013). A numerical recipe for modelling hydration and heat flow in hardening concrete. Cem. Concr. Compos. 40, 48–58. doi:10.1016/j.cemconcomp.2013.04.004
Maruyama, I., and Lura, P. (2019). Properties of early-age concrete relevant to cracking in massive concrete. Cem. Concr. Res. 123, 105770. doi:10.1016/j.cemconres.2019.05.015
Matthieu, B., Farid, B., Jean-Michel, T., and Georges, N. (2012). Analysis of semi-adiabiatic tests for the prediction of early-age behavior of massive concrete structures. Cem. Concr. Compos. 34 (5), 634–641. doi:10.1016/j.cemconcomp.2011.09.001
Merey, S., Eren, T., and Polat, C. (2021). SPE europec featured at 82nd EAGE conference and exhibition.Numerical analysis of the behavior of gas hydrate layers after cementing operations
Moon, J., and Wang, S. (1999). “Acoustic method for determining the static gel strength of slurries,” in Proceedings of the SPE rocky mountain regional meeting (Gillette, Wyoming: Society of Petroleum Engineers), 519–528.
Mounanga, P., Baroghel-Bouny, V., Loukili, A., and Khelidj, A. (2006). Autogenous deformations of cement pastes: Part I. Temperature effects at early age and micro–macro correlations. Cem. Concr. Res. 36 (1), 110–122. doi:10.1016/j.cemconres.2004.10.019
Namkon, L., Abhinav, P., Gary, O. K. C., Juhyuk, M., Min-Hong, Z., Arthur, C. C. H., et al. (2018). Experimental design of a well cement slurry for rapid gel strength development. Constr. Build. Mater. 191, 1093–1102. doi:10.1016/j.conbuildmat.2018.10.074
Pane, I., and Hansen, W. (2005). Investigation of blended cement hydration by isothermal calorimetry and thermal analysis. Cem. Concr. Res. 35 (6), 1155–1164. doi:10.1016/j.cemconres.2004.10.027
Pang, X., Bentz, D. P., Meyer, C., Funkhouser, G. P., and Darbe, R. (2013c). A comparison study of Portland cement hydration kinetics as measured by chemical shrinkage and isothermal calorimetry. Cem. Concr. Compos. 39, 23–32. doi:10.1016/j.cemconcomp.2013.03.007
Pang, X., Boul, P., and Jimenez, W. C. (2015). Isothermal calorimetry study of the effect of chloride accelerators on the hydration kinetics of oil well cement. Constr. Build. Mater. 77, 260–269. doi:10.1016/j.conbuildmat.2014.12.077
Pang, X., Cuello, J. W., and Iverson, B. J. (2013b). Hydration kinetics modeling of the effect of curing temperature and pressure on the heat evolution of oil well cement. Cem. Concr. Res. 54, 69–76. doi:10.1016/j.cemconres.2013.08.014
Pang, X., Jimenez, W. C., and Singh, J. P. (2020). Measuring and modeling cement hydration kinetics at variable temperature conditions. Constr. Build. Mater. 262, 120788. doi:10.1016/j.conbuildmat.2020.120788
Pang, X., Meyer, C., and Darbe, R. (2013a). Modeling the effect of curing temperature and pressure on cement hydration kinetics. ACI Mater. J. 110 (2), 137–148.
Pang, X., and Meyer, C. (2016a). Modeling cement hydration by connecting a nucleation and growth mechanism with a diffusion mechanism Part I: C3S hydration in dilute suspensions. Sci. Eng. Compos. Mater. 23 (3), 345–356. doi:10.1515/secm-2013-0258
Pang, X., and Meyer, C. (2016b). Modeling cement hydration by connecting a nucleation and growth mechanism with a diffusion mechanism Part II: Portland cement paste hydration. Sci. Eng. Compos. Mater. 23 (6), 605–615. doi:10.1515/secm-2013-0259
Pang, X., Sun, L., Chen, M., Xian, M., Cheng, G., Liu, Y., et al. (2022). Influence of curing temperature on the hydration and strength development of Class G Portland cement. Cem. Concr. Res. 156, 106776. doi:10.1016/j.cemconres.2022.106776
Pang, X., Sun, L., Sun, F., Zhang, G., Guo, S., and Bu, Y. (2021). Cement hydration kinetics study in the temperature range from 15 ˚C to 95 ˚C. Cem. Concr. Res. 148, 106552. doi:10.1016/j.cemconres.2021.106552
Pichler, C., and Lackner, R. (2020). Post-peak decelerating reaction of Portland cement: Monitoring by heat flow calorimetry, modelling by Elovich-Landsberg model and reaction order model. Constr. Build. Mater. 231, 117107. doi:10.1016/j.conbuildmat.2019.117107
Reddy, B. R. (2008). CIPC/SPE gas Technology symposium 2008 joint conference.Novel low heat-of-hydration cement compositions for cementing gas hydrate zones
Reinas, L., Hodne, H., and Turkel, M. A. (2011). “Hindered strength development in oilwell cement due to low curing temperature,” in SPE arctic and extreme environments conference and exhibition (Moscow, Russia: SPE), 149687.
Sabins, F. L., Tinsley, J. M., and Sutton, D. L. (1982). Transition time of cement slurries between the fluid and set states. Soc. Petroleum Eng. J. 22 (6), 875–882. doi:10.2118/9285-pa
Scherer, G. W., Zhang, J., and Thomas, J. J. (2012). Nucleation and growth models for hydration of cement. Cem. Concr. Res. 42 (7), 982–993. doi:10.1016/j.cemconres.2012.03.019
Shanahan, N., Sedaghat, A., and Zayed, A. (2016). Effect of cement mineralogy on the effectiveness of chloride-based accelerator. Cem. Concr. Compos. 73, 226–234. doi:10.1016/j.cemconcomp.2016.07.015
Sloan, D. E., and Koh, C. A. (2007). Clathrate hydrates of natural gases. 3rd ed. Boca Raton: CRC Press.
Sun, L., Pang, X., and Bu, Y. (2021a). “Experimental study of the effect of curing temperature and pressure on the property evolution of oilwell cement[C],” in The ARMA 55th US rock mechanics/geomechanics symposium Houston, Texas. 20–23 June.
Sun, L., Pang, X., and Guo, S. (2021b). Simulations of hydration kinetics of portland cement by scale factor method. J. Chin. Ceram. Soc. 49 (5), 1–10. (in Chinese).
Thomas, J. J., Allen, A. J., and Jennings, H. M. (2009). Hydration kinetics and microstructure development of normal and CaCl2-accelerated tricalcium silicate pastes. J. Phys. Chem. C 113, 19836–19844. doi:10.1021/jp907078u
Tinsley, J. M., Miller, E. C., Sabins, F. L., and Sutton, D. L. (1980). Study of factors causing annular gas flow following primary cementing. J. Petroleum Technol. 32 (8), 1427–1437. doi:10.2118/8257-pa
Wang, C., Wang, R., and Bu, Y. (2009). “A unique cement slurry overcoming low temperature, shallow water/gas flows in deepwater cementing,” in Middle East Drilling Technology Conference & Exhibition, Manama, Bahrain, October 26–28, 2009.
Wang, C., Chen, X., and Wang, R. (2017). Do chlorides qualify as accelerators for the cement of deepwater oil wells at low temperature. Constr. Build. Mater. 133, 482–494. doi:10.1016/j.conbuildmat.2016.12.089
Keywords: gas hydrate, activation energy, isothermal calorimetry, water-to-cement ratio, calcium chloride
Citation: Sun L, Pang X and Yan H (2022) Hydration kinetics of oil well cement in the temperature range between 5 and 30°C. Front. Mater. 9:985332. doi: 10.3389/fmats.2022.985332
Received: 03 July 2022; Accepted: 18 August 2022;
Published: 15 September 2022.
Edited by:
João Reis, Fluminense Federal University, BrazilReviewed by:
Felipe Do Carmo Amorim, Federal Center for Technological Education Celso Suckow da Fonseca, BrazilChristian Pichler, University of Innsbruck, Austria
Copyright © 2022 Sun, Pang and Yan. This is an open-access article distributed under the terms of the Creative Commons Attribution License (CC BY). The use, distribution or reproduction in other forums is permitted, provided the original author(s) and the copyright owner(s) are credited and that the original publication in this journal is cited, in accordance with accepted academic practice. No use, distribution or reproduction is permitted which does not comply with these terms.
*Correspondence: Xueyu Pang, eC5wYW5nQHVwYy5lZHUuY24=
 Lijun Sun
 Xueyu Pang
 Haibing Yan4