 Jiankun Qin
 Xueyu Pang
 Hailong Li1
94% of researchers rate our articles as excellent or good
Learn more about the work of our research integrity team to safeguard the quality of each article we publish.
Find out more
ORIGINAL RESEARCH article
Front. Mater. , 19 October 2022
Sec. Polymeric and Composite Materials
Volume 9 - 2022 | https://doi.org/10.3389/fmats.2022.982192
This article is part of the Research Topic Advances in Wellbore Servicing Fluids and Materials View all 6 articles
In order to clarify on the driving force of cement long-term strength retrogression, a comprehensive quantitative X-ray diffraction (XRD) analysis were conducted on silica-enriched (60%–80% by weight of cement) cement samples set and cured under the condition of 200°C and 50 MPa with a maximum duration of 180 days. The phase content evolution with time was determined by three different methods on the average of three specimens: the external standard method; the partial or no known crystal structure (PONKCS) method; and the hybrid method. Although the specific phase content estimated by different methods varied slightly, the overall trend of change of all phases were similar. The phase transformation in set cement at high temperature condition is dependent on the slurry composition. In silica-deficient system, tobermorite and amorphous C-S-H were transformed to xonotlite; while in silica-sufficient system, tobermorite and amorphous C-S-H were transformed to gyrolite. These phase transformations involve gradual structural changes of cement hydration products, which may be the driving force of long-term strength retrogression. However, such structural changes can only be detected by XRD once the transformation is complete.
Cement strength retrogression, defined as the deterioration in strength and other properties at high curing temperatures (Craft et al., 1935; Swayze, 1954; Hesse et al., 2009), challenge the design of cementing slurries for high pressure and high temperature (HPHT) wells. Above 110°C, calcium–silicate–hydrates (C–S–H) gel in cement slurry can be transformed into crystalline phases, resulting in a decrease in strength and an increase in permeability (Richardson, 2008; Bahafid et al., 2017; Jeong et al., 2018; Mabeyo, 2021; Kuzielová et al., 2022), which is believed to be the main cause of high temperature strength retrogression of cementitious materials. In the petroleum industry, various materials, such as silica flour, silica fume, rice husk ash, konilite, and basalt, have been added to the cement slurry to address the strength retrogression problem under high temperature (Ge et al., 2018; Paiva et al., 2019; Jiang et al., 2021; Santiago et al., 2021). Among these materials, silica flour is the most commonly used anti-strength retrogression agent and it has been proven to be quite effective for thermal recovery wells where the cement was set at a low temperature before high temperature exposure (Jiang et al., 2021; Santiago et al., 2021). However, several of our recent studies (Pang et al., 2021; Liu et al., 2022; Qin et al., 2022) have shown that silica flour is ineffective in preventing long-term strength retrogression at deep well conditions where the cement was set and cured both at 200°C. While it is clear that the long-term strength retrogression is accompanied by cement microstructure coarsening, some inconsistent conclusions have been drawn with regard to what caused microstructure coarsening, primarily due to uncertainties in X-ray diffraction analysis. For example, based on the work of Pang et al. (2021), it appears that transformation of amorphous C-S-H to tobermorite and xonotlite was the driving force of strength retrogression. However, based on the work of Qin et al. (2022), it appears that the transformation of tobermorite to xonotlite and possibly structural change of amorphous C-S-H itself may be the driving force of strength retrogression. Therefore, this study will investigate different methods of performing quantitative X-ray diffraction (QXRD) analysis on cement cured at HPHT conditions and the influence factors of analysis results to further clarify the long-term phase changes in set cement and the driving mechanism of cement high temperature strength retrogression.
The Rietveld method (Rietveld, 1969) is one of the most commonly used method for the quantification of powdered mixtures using X-ray diffraction data. O’Connor and Raven, 1988 used Rietveld method to quantify the mass fraction of each crystal phase in an unknown mixture using the entire X-ray diffraction (XRD) profile. However, QXRD analysis of set cement based on Rietveld method is difficult in general because the main hydrated phase C-S-H typically exhibits poor crystallinity and short-range order of its atoms, and thus does not offer defined Bragg reflections like crystalline materials, where the normalization condition may no longer hold (Taylor, 1992; Viseshchitra et al., 2021). In this case, the correct mass fraction of each phase is generally calculated by using a known amount of the internal or external standard (Hesse et al., 2011; Jansen and Goetz-Neunhoeffer, 2012; Bergold et al., 2013; Snellings et al., 2014a; Snellings et al., 2014b). When internal standard is used, the overlap of the diffraction peaks of standard material and mixture phases and uneven mixing of the two materials pose some problems to QXRD analysis, sometimes leading to inaccurate results. The external standard method does not require adding the standard material into the sample, which can simplify the sample preparation and reduce the chance of peak overlap.
The internal or external standard methods can be used to estimate the total amount of amorphous phases but not the individual amount of different amorphous phases (Snellings et al., 2010; Snellings et al., 2014a). A partial or no known crystal structure (PONKCS) method (Scarlett and Madsen, 2006) was developed to quantify the content of a specific amorphous material with a known X-ray diffraction pattern (usually consisting of hump peaks). The method generally involves constructing a pseudo-structure for the amorphous material by fitting its diffraction pattern and using an internal standard to determine its formula mass. The PONKCS method has the advantage of using a calibrated XRD profile of each amorphous phase, which is easily implemented in standard Rietveld refinement software to determine the specific amorphous phase content. Williams et al. (2011) used the PONKCS method to assess the reaction extent of metakaolin in alkali-activated metakaolin systems. Snellings et al. (2014b) used the PONKCS method to quantify the content of individual amorphous supplementary cementitious materials in anhydrous and hydrated blended cement; Bergold et al. (2013) used the PONKCS and G-factor methods to directly quantify C–S–H gel in cementitious pastes. Snellings proposed a hybrid quantification approach, which, in some sense, combines the external standard method and the PONKCS method. However, in this hybrid approach, it is not necessary to determine the pesduo formula mass for C-S-H gel, because the amorphous C-S-H gel is merely refined as a so-called “peaks phase” for pattern decomposition. The total content of amorphous phase is still determined by the external standard. Pang et al. (2022) successfully applied the hybrid approach to determine the phase compositions of hydrated cement at various curing times (5–914 h) and temperatures (15°C–87°C) and the calculated overall degrees of cement hydration were found to agree well with those estimated from the heat of hydration and nonevaporable water content test methods.
In this study, a more comprehensive evaluation of the long-term phase evolution of oil well cement systems set and cured under HPHT condition was performed. A total of four silica-enriched cement slurries from our previous publications were selected for such evaluation. These slurries were cured at 200°C and 50 MPa for various durations ranging from 2 days to 180 days. Three duplicate samples of each formulation were prepared and evaluated per test condition to obtain the experimental errors in XRD analysis. Three different quantitative methods (i.e. the external standard method, the PONKCS method, and the hybrid method) were employed to analyze and compare the phase quantification results of each sample. By combining these analysis results, the driving force of strength retrogression were discussed.
Aksu cement factory provided Aksu Class G oil well cement with a median particle size of 14.3 μm. The compound proportions of C3S, C2S, C3A, C4AF, gypsum, and hemihydrate were 63.19%, 15.03%, 3.70%, 12.91%, 2.05% and 0.82%, respectively. Huli drilling mud material factory provided cement mineral admixtures including silica fume and 53-μm silica flour; Huashuo Mineral factory provided 16-μm silica flour. Tongbai factory supplied silica with a particle size of 6-μm. Beijing Deke Daojin Science and Technology Co., Ltd. supplied colloidal iron oxide with 30% activity. OMAX Oilfield Technology Co., LTD. supplied the latex fiber. Tianjin PetroChina Boxing Technology Co., Ltd. supplied retarder (BCR-300L), fluid loss agent (BXF-200L), dispersant (BCD-210L), defoaming agent (G603), and high-temperature suspension agent (BCJ-300S). Most of the liquid additives (BCR-300L, BXF-200L, and BCD-210L) were 20% percent active water suspensions of synthetic AMPS polymers. Table 1 shows the cement slurry design. The slurries were divided into two groups: coarse silica (53 μm and 16 μm) and fine silica (6 μm). “CS” was used to represent the slurries with coarse silica and “FS” was used to represent the slurries with fine silica.
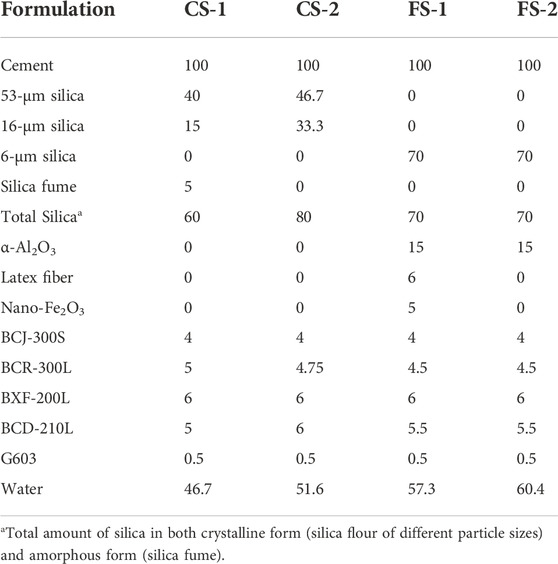
TABLE 1. Slurry composition designs (based on the weight of cement).
The cement slurry was prepared using a laboratory blender in accordance with (API Recommended Practice 10B-2, 2013) (add the dry material at 4,000 rpm until completely introduced, and then mix at 12,000 rpm for 35 s). The slurry was then poured into the prepared molds and puddled with a glass rod to eliminate air bubbles. The filled molds were put in an HPHT curing autoclave (made by Hai’an Petroleum Instrument Co., Ltd.), and the autoclave’s temperature and pressure were ramped up to 200°C/50 MPa and held for a predetermined time. The temperature and pressure of the autoclave were then decreased to ambient temperature and pressure by natural cooling, which took about 48 h. More detailed information about the sample curing method can be found in our two previous publications (Pang et al., 2021; Qin et al., 2022).
After a designated curing time, set cement samples were first dried by vacuum at room temperature for about 1 week and then ground to a fine powder using an agate mortar for the XRD test. A Malvern PANalytical X-ray diffractometer (Model AerisX) with a voltage of 40 kV and a current of 15 mA was applied to get the XRD data. The scan range was from 7° to 70° (2θ angle) with a rate of 2° per minute and a step size of 0.01°, resulting in 30 min of total measurement time for each scan. The back-loading method was used for sample preparation to mitigate the effect of preferred orientation.
All three QXRD analysis methods require the use of an external standard and Rietvled refinement, which can be implemented in a commercial XRD analysis software package. The HighScore Plus 5.0 (by PANalytical) was employed in this particular study. A monocrystalline silicon was ground into fine powders and used as the external standard. In the external standard method, Eq. 1 as shown below is used to calculate the phase content of a sample.
where
In the external standard method, it is assumed that the scale factor of the standard material (i.e.
FIGURE 1. Crystallinity analysis of monocrystalline silicon using the external standard method. (A–D) in different test date.
The mechanical property test results of the slurries have been comprehensively analyzed in our previous publications (Pang et al., 2021; Liu et al., 2022). The compressive strength test results are summarized in Table 2, where it can be seen that all slurries exhibit significant long-term strength retrogression. Figure 2 shows representative XRD profiles of samples cured under HPHT conditions from 2 to 142/180 days. From a qualitative analysis standardpoint, it appeared that slurries FS-1 and FS-2 showed higher crystalinity than slurries CS-1 and CS-2 during early age (2 days), as indicated by higher and sharper peaks between 28.5° and 30.5°. However, after long term curing (142 days–180 days), similar diffraction patterns were obtained. Slurry CS-1 appeared to had produced significantly more xonotlite phase in the long term compared with the other slurries, which may explain its faster strength retrogression rate (Table 2). A new phase (gyrolite) with a main peak at 28.3° was observed in slurries CS-2, FS-1 and FS-2 after long term curing, but it was not seen in slurry CS-1. The unique peak of the tobermorite phase at 7.9° were observed in all slurries, which also appeared to increase gradually with increasing curing time. However, the peak width at half height at 7.9°, which is closely related to the tobermorite crystallite size, was significantly different between different slurries. The tobermorite crystallite size of 2 days CS-1 calculated by Scherrer calculator in Highscore 5.0 was only 12.4 nm, which was much lower than other samples in 2 days (about 40 nm); with the increase of curing time, the tobermorite crystallite size of all slurries significantly increased to 80–100 nm.
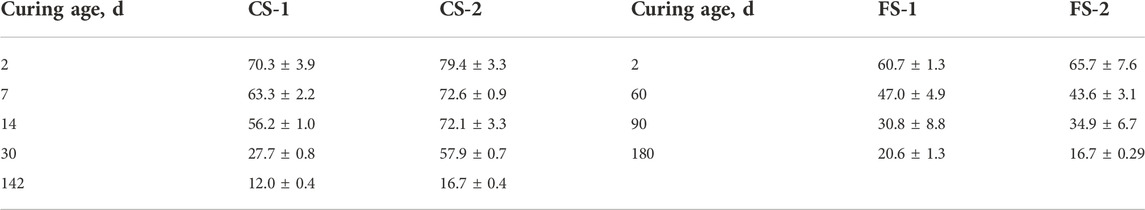
TABLE 2. Compressive strength of slurries cured under 200°C and 50 MPa (Pang et al., 2021; Liu et al., 2022), MPa.
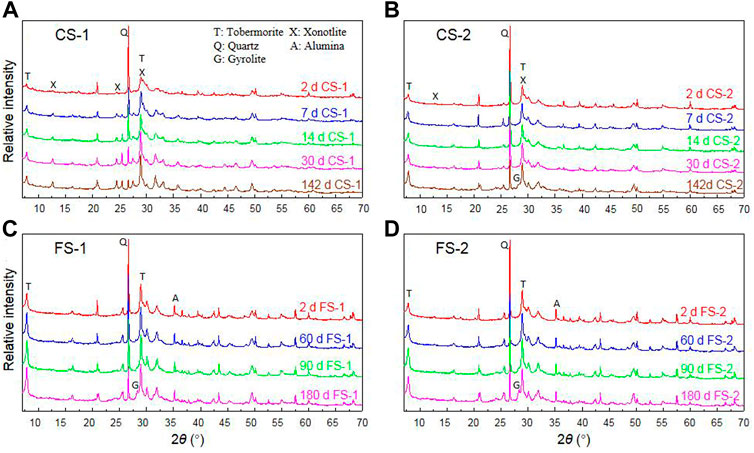
FIGURE 2. X-ray diffraction curves of sample cured under high-pressure and high-temperature conditions: (A) slurry CS-1, (B) slurry CS-2, (C) slurry FS-1, and (D) slurry FS-2.
Figure 3 show detailed XRD profile comparisons between long-term cured samples of different slurries. Clearly, slurry CS-1 had very little unreacted crystalline silica left after 142 days of curing, which can be considered as a silica-deficient system, considering that large silica particles may never get to fully react, as indicated by previous SEM-EDS analysis results. In the short-term curing analysis, it has been shown that xonotlite phase tend to dominate in the silica-deficient system, leading to significantly poor physical and mechanical properties (Qin et al., 2021). The long-term curing test results presented here appear to confirm these previous findings. However, the long-term physical and mechanical properties were deteriorated in the silica-sufficient systems as well (at a slower rate compared with the silica-insufficent system, see Table 2) even though relatively little xonotlite phase was produced. Slurry FS-1 exhibited almost the same mineral composition as slurry FS-2, and the slight improvement of its long-term (180 days) mechanical property was primarily due to the addition of latex fiber, which might have provided physical bridging effects to mitigate microstructure coarsening and strength retrogression.
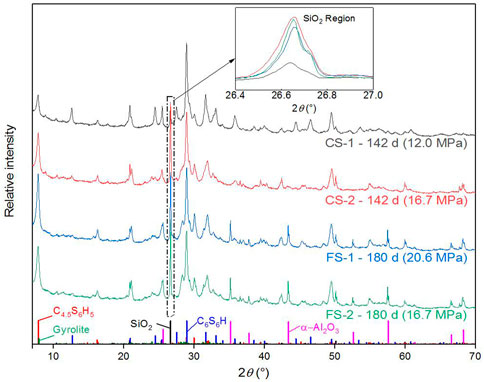
FIGURE 3. X-ray diffraction analysis of slurries cured under 200°C and 50 MPa for the long-term (the data in the brackets is the compressive strength of the sample).
The set cement composition was first analyzed by the general external standard method, where only crystalline peaks were considered and the weak hump peaks generated by the amorphous phases were ignored during XRD profile refinement. The average refinement results are shown in Figure 4. In this method, the quantities of the crystalline phases were determined based on their scale factors (Eq. 1) obtained by profile fitting while the quantity of the amorphous phase was calculated by subtracting all quantified crystalline phases from 100%. Figures 4A–D show the QXRD compositions of the hydrated cement using the external standard method. A total of three powder samples were produced for each formulation to calculate the experimental errors. The standard deviations of various phase contents were all less than 2%. Specifically, the standard deviations of quartz content in slurry CS-1, CS-2, FS-1 and FS-2 were 0.3%, 0.7%, 0.6% and 0.1%, respectively, while the standard deviations of the amorphous content in slurry CS-1, CS-2, FS-1 and FS-2 were 1.3%, 1.5%, 1.3% and 1.0%, respectively, indicating relatively small experimental errors. No trace of unreacted cement clinkers, such as C3S, C2S, and C4AF, was observed in the refinement results, suggesting that the cement was completely hydrated after 2-day curing at HPHT conditions.
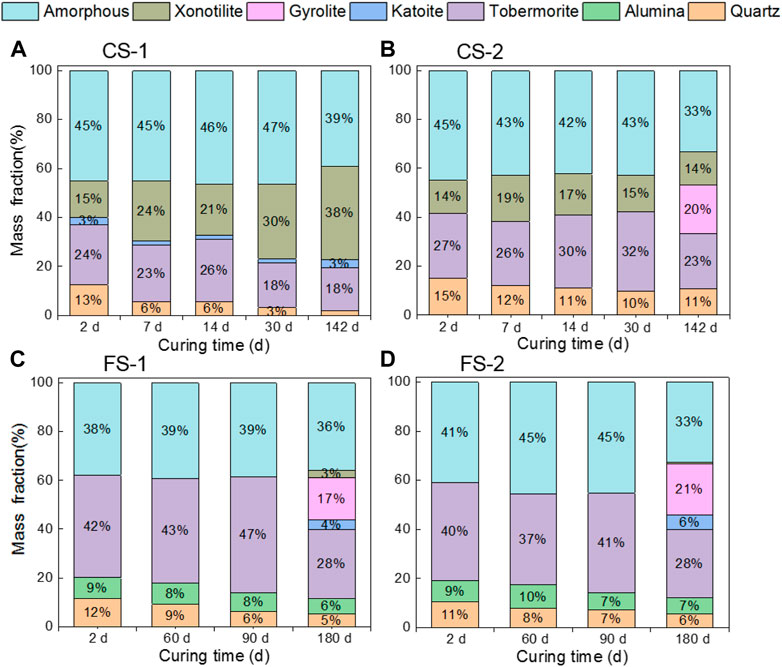
FIGURE 4. (A–D) Phase compositions of hydrated cement quantified using the external standard method at various curing times.
Amorphous phase content, referring to mainly amorphous C–S–H, decreased in slurries CS-1, CS-2, and FS-2 but remained steady in slurry FS-1 with latex fiber. The formation of xonotlite was inhibited in slurries FS-1 and FS-2 during the first 90 days of curing, possibly due to the use of large quantities of 6 μm fine silica. Alumina added to slurries FS-1 and FS-2 appeared to almost not react at all during the entire curing process. Significantly more xonotlite phase was produced in slurry CS-1 than the other slurries possibly due to the insufficient amount of silica, as discussed previously. It appeared that both amorphous C-S-H and tobermorite can be transformed to other phases during long-term curing. In the silica-deficient system (CS-1), both phases can be gradually transformed to xonotlite. In the silica-sufficient systems (CS-2 and FS-2), both phases can be transformed to gyrolite after long-term curing (142 days and 180 days). In the silica-sufficient system containing laxte fiber (FS-1), primarily tobermorite was transformed to gyrolite, while the amorphous phase remained relatively constant.
The application of the PONKCS method first requires the development of an XRD pseudo-structural model for the amorphous C-S-H phase. It is difficult to seperate the C–S–H profile from the XRD test results of the HPHT cured sample due to the peak overlap between crystalline tobermorite, xonotlite and amorphous C–S–H gel. Therefore, the C–S–H profile used in the PONKCS method was obtained from the deconvolution of the XRD profile of a set cement sample cured for 1 year at water-saturated condition under 25°C and atmospheric pressure. Figure 5 shows the deconvoluted C–S–H profile and comparisons with other studies. Apparently, the position of the peaks were aligned, but the C–S–H profile of synthetic C–S–H exhibited higher crystallinity (more pronounced peaks) than those deconvoluted from hydrated cement. The C–S–H profile obtained from this study exhibit wide hump peaks that are similar to the 7-year-hydrated white cement sample.
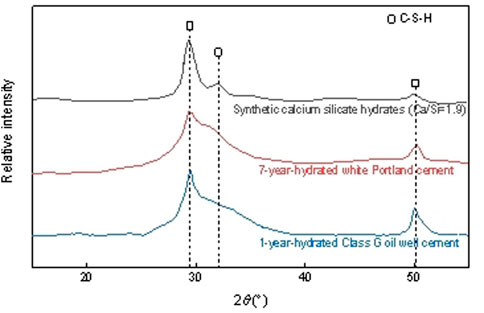
FIGURE 5. X-ray diffraction patterns for C–S–H (normalized data) (Red curve: ref. Snellings et al., 2014b; Black curve: ref. Harris et al., 2022).
The tetragonal crystal system (space group number is 75) and Pawley method was used to fit the C-S-H profile obtained in Figure 5 (1-year hydrated Class G oil well cement) and create a PONKCS pseudo-structural model. The C-S-H PONKCS model was created as an independent phase during Reitveld refinement to evaluate the amorphous C-S-H content in set cement cured under both ambient condition and HPHT condition. Figure 6 shows the application of the C–S–H model in the sample cured under ambient condition (25°C, atmospheric pressure) for 1 year. The pseudo-formula mass of the C-S-H PONKCS model was adjusted to make the amorphous content determined by the external standard method equal to zero, assuming that all amorphous phases were accounted for in the diffraction pattern of the PONKCS model. The test and fit curves overlapped with each other very well, indicating that the applicability of the C–S–H PONKCS model was reasonable for the sample cured under low temperature. After the C–S–H model profile and its pseudo-formula mass were established, the C–S–H model was applied to the sample cured under HPHT conditions during Rietveld refinement as shown in Figure 7 with no applied standard (i.e. contents of all refined phases add up to 100%).
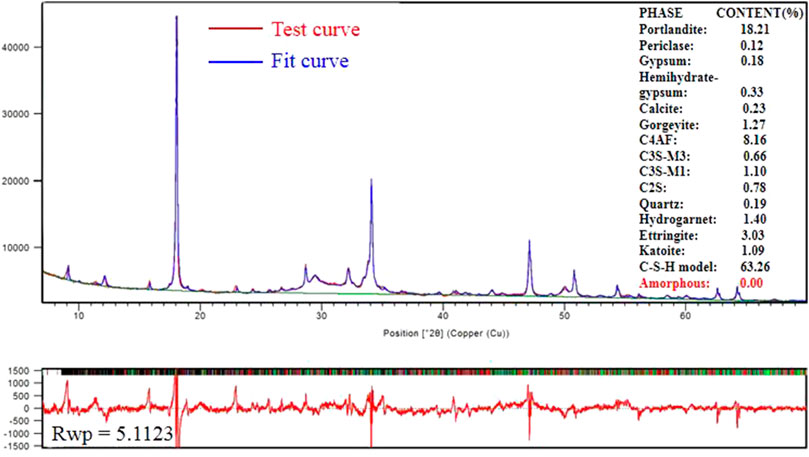
FIGURE 6. Establishing the calcium–silicate–hydrates model through the partial or no known crystal structure method.
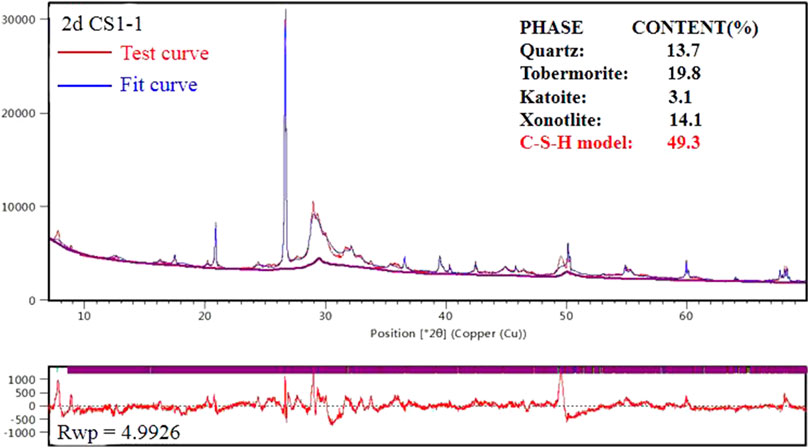
FIGURE 7. Application of calcium–silicate–hydrates model in representative sample.
In summary, the preparation and application of the C-S-H model (PONKCS method) consists of the following four main steps: 1) Data separation: subtract the crystalline phase from the XRD profile of the 1-year-cured set cement sample to obtain the diffraction pattern of the amorphous C-S-H gel. 2) Model construction: fit the diffraction pattern of C-S-H obtained from step 1 and build a PONKCS psedo-structure model for C-S-H as an independent phase. 3) Model refinement: Perform Rietveld refinement (with external standard method) on XRD profile of the 1-year-cured set cement using the C-S-H model developed in step 2 and calibrate the “psedo formula mass” of the C-S-H model such that the “amorphous content” estimated by the external standard method is zero (i.e. assuming all amorphous phases are accounted for by the PONKCS model). 4) Model application: Apply the obtained C-S-H model as a PONKCS phase during Rietveld refinement of other set cement samples.
Figure 8 shows a comparison of the phase composition analysis results obtained by the external standard method and the PONKCS method. The amorphous phase content determined by the external standard method were all assumed to be C-S-H and compared with the C-S-H content refined as a phase using the PONKCS method. Despite the fact that the C–S–H model in the PONKCS method was separated from a sample cured under ambient condition, it can be seen that the QXRD results obtained using the two different methods agreed reasonably well with each other, especially for slurry CS-1, suggesting that the XRD profile of C–S–H possibly do not vary significantly with temperature. This agrees with our previous findings within a limited temperature range of 15–87°C, where the shapes of C-S-H profiles obtained at different curing temperatures were qualitatively compared (Pang et al., 2022). However, the overlap of C-S-H hump peak and crystalline peak in the range of 28.5°–30.5° may result in some C-S-H phases to be mistaken for crystalline phases in the external standard method. In the external standard method, the content of the amorphous phase is obtained by subtracting the content of crystal phase from the 100%. Therefore, by ignoring the hump peaks of the amorphous phase, the external standard method can overestimate the content of crystalline material and underestimate the content of amorphous phase in the cement sample, which were indeed observed in certain samples (slurries CS-2, FS-1 and FS-2 at almost all test ages).
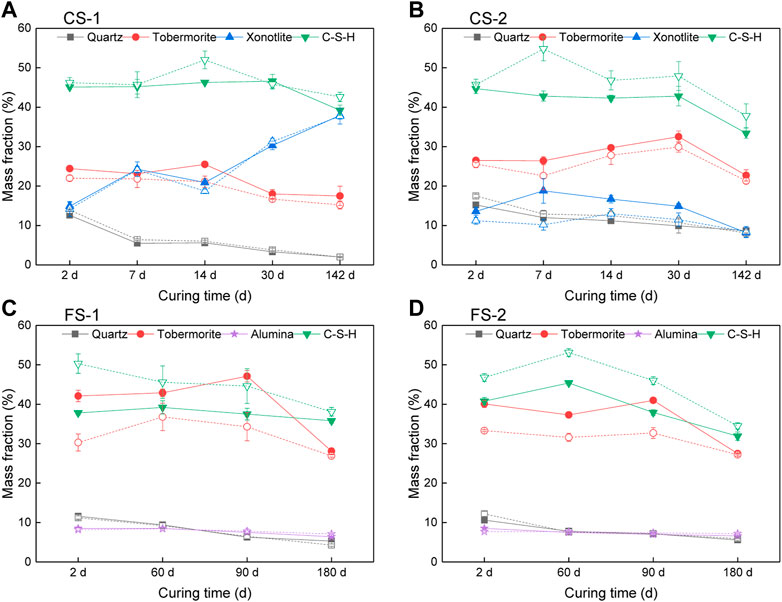
FIGURE 8. Quantitative X-ray diffraction analysis of hydrated cement using the external standard method (filled symbols linked by solid curves) and the PONKCS method (hollow symbols linked by dash curves). (A) slurry CS-1 (B) slurry CS-2 (C) slurry FS-1 (D) slurry FS-2.
Since the C-S-H PONKCS model was developed based on a cement sample hydrated at a low curing temperature, it is possible that some parameters can be changed at high curing temperatures. We can apply the C-S-H model along with the external standard method to account for some of these changes. A hybrid application means that the C–S–H model obtained using the PONKCS method is applied in the external standard analysis as an independent phase. Figure 9 shows the QXRD compositions of the hydrated cement using the hybrid method. The analysis results of the hybrid method also had good repeatability, and its standard deviation for each phase was less than 2%. The development trends of phase content for each slurry obtained by the hybrid method were similar to those obtained by the external standard method and the PONKCS method. However, the definition of the amorphous phase in the hybrid method has changed. In the comparison between external standard method and the PONKCS method, it was assumed that the amorphouse phase content equal to the amorphous C-S-H gel content. In the hybrid method, the total amorphous content is the sum of the amorphous content directly derived by the external standard method (values presented in Figure 9) plus the C-S-H content refined from the C-S-H model. Such treatement can account for possible changes in C-S-H with curing temperature, such as its pseudo-formula mass. When the amorphous content directly derived by the external standard method is close zero, then it generally means the hybrid method agrees with the PONKCS method. It appears that changes in C-S-H model parameters was more probable in the systems with relatively coarse silica flour (CS-1 and CS-2) as well as in the systems with fine silica flour after long-term curing (FS-1 and FS-2 at 180 days).
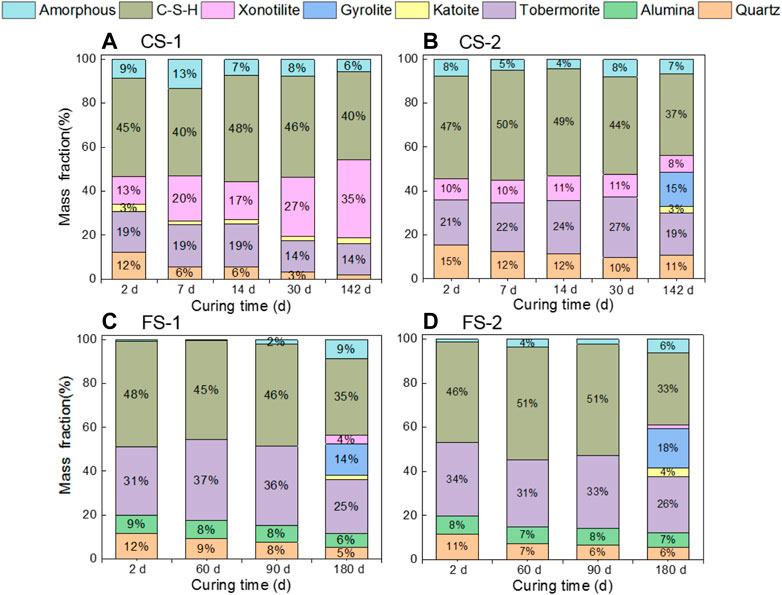
FIGURE 9. (A–D) Phase compositions of hydrated cement quantified using the hybrid method at various curing times.
Figures 10, 11 show the comparison of analysis results of the three QXRD methods. In general, the amorphous phase content determined by the PONKCS method was higher than that determined by the external standard method and lower than that determined by the hybrid method. In the systems with fine silica, the amorphous phase content determined by the hybrid method agree well with that determined by the PONKCS method (slurries FS-1 and FS-2), while in the systems with coarse silica, the amorphous phase content determined by the hybrid method was higer than that determined by the PONKCS method (slurries CS-1 and CS-2). This may indicate that in the systems with fine silica, the amorphous C-S-H produced at high curing temperature has a similar XRD profile and pseudo-formula mass as the C-S-H generated at room temperature. However, the overall trend of varation with time were the same for all three methods and the differences between amorphous contents estimated by different methods were generally less than 10%. The contents of crystalline phases determined by the hybrid method agreed well with those determined by the PONKCS method. Due to the overlap of the diffraction peaks, the contents of main crystalline hydration product phases (tobermorite and xonotlite) determined by the hybrid method were lower than those determined by the external standard method.
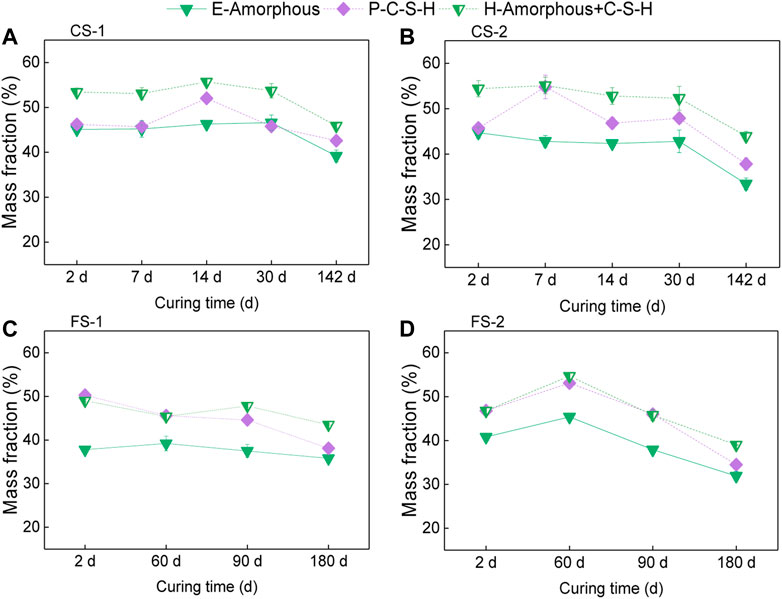
FIGURE 10. Comparison of the amorphous phase content obtained by different methods. (E: the external standard method; P: the PONKCS methods; H: the hybrid method). (A) slurry CS-1 (B) slurry CS-2 (C) slurry FS-1 (D) slurry FS-2.
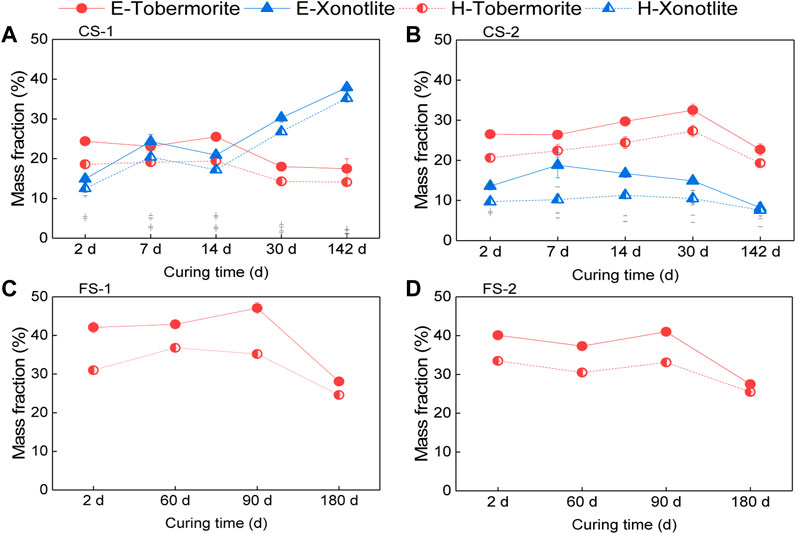
FIGURE 11. Comparison of the crystalline phase contents obtained by different methods. (E: the external standard method; P: the PONKCS methods; H: the hybrid method). (A) slurry CS-1 (B) slurry CS-2 (C) slurry FS-1 (D) slurry FS-2.
In summary, it appeared that the QXRD test results obtained by the three different methods in this study were in reasonable agreement. While there are some differences in the estimated contents of specific phases, the overall trend of development with time were very similar. By comparing the phase content evolutions with the compressive strength test results presented in Table 2, it can be concluded that phase transformation can apparently cause strength retrogression, but strength reduction is not always accompanied by phase transformation. For example, the various phase contents remained relatively stable in slurry CS-2 during the first 30 days, and in slurries FS-1 and FS-2 during the first 90 days, but severe strength retrogression were observed during these periods. It is apparent that the transformation of one phase to another may take a very long time. The transformation of tobermorite to xonotlite in slurry CS-1 primarily happened from 14 days to 30 days, while the transformation of amorphous C-S-H to xonolite the same slurry primarily happened from 30 days to 142 days; the transformation of tobermorite and amorphous C-S-H to gyrolite in slurries CS-2, FS-1 and FS-2 primarily happened from 90 days to 180 days. It is postulated that structural changes of these phases (including possible crystallite size changes as discussed in Section 3.2) happens gradually and continuously during long-term curing (hence causing gradual deterioration in physical and mechanical properties) but these changes can only be detected by XRD once some critical points have been reached. Due to these limitations, X-ray diffraction analyses cannot give the complete details with regard to the strength retrogression process and one can only make hypotheses based on observations. Other advanced analytical techniques, such as solid-sate nuclear magnetic resonance that can probe the structure of hydration products in more details, may be needed to further advance our understanding with regard to the driving mechanism of long-term strength retrogression of silica-enriched Portland cement systems.
This study investigated the long-term phase changes of silica-enriched oil well cement cured at 200°C and 50 MPa by using three different Rietveld methods for quantitative X-ray diffraction analysis. The following main conclusions can be drawn:
(1) When there is insufficient amount of silica, tobermorite and amorphous C-S-H hydration products transforms into xonotlite over long-term curing; when there is sufficient amount of silica, the same hydration products (tobermorite and amorphous C-S-H) transforms into gyrolite instead. The crystallite size of tobermorite is observed to increase with curing time regardless of the sufficiency of silica, though the increase is more dramatic for the silica-deficient system. These gradual structural changes of hydration products (which may only be detectable by XRD until some critical points are reached) are possibly the driving force of strength retrogression. Additional testing by other analytical methods are needed to verify this conjecture.
(2) The external standard method might slightly overestimate the contents of crystalline phases while underestimating the content of amorphous phase in the set cement due to the effect of the amorphous phase hump peaks. The PONKCS method can be used to directly determine the C-S-H content in set cement but its accuracy is limited by the precision of the derived pseudo-formula mass and C-S-H XRD profile.
(3) The phase contents of set cement analized by the three different QXRD methods show similar overall trend of change with time. The hybrid method is considered as the most accurate one due to its ability to account for slight changes in PONKCS model of C-S-H. However, no significant change in C-S-H PONKCS model were observed between low temperature cured cement and high temperature cured cement (especially slurries FS-1 and FS-2).
The original contributions presented in the study are included in the article/Supplementary Material; further inquiries can be directed to the corresponding author.
JQ: Investigation, Writing—original draft, Project administration, Formal analysis, Data curation, Writing—reviewing and; editing. XP: Conceptualization, Methodology, Writing—original draft, Supervision, Fund acquisition. HL: Investigation, Writing—reviewing and; editing. ZZ: Investigation, Writing—reviewing and; editing.
Financial support comes from China National Natural Science Foundation (Grant No. 51974352) as well as from China University of Petroleum (East China) (Grant Nos. 2018000025 and 2019000011).
The authors would like to also thank Petro China Tarim Oilfield Company for providing raw test materials for this study.
The authors declare that the research was conducted in the absence of any commercial or financial relationships that could be construed as a potential conflict of interest.
All claims expressed in this article are solely those of the authors and do not necessarily represent those of their affiliated organizations, or those of the publisher, the editors and the reviewers. Any product that may be evaluated in this article, or claim that may be made by its manufacturer, is not guaranteed or endorsed by the publisher.
API Recommended Practice 10B-2 (2013). Recommended practice for testing well cements. Second Edition.
Bahafid, S., Ghabezloo, S., Duc, M., Faure, P., and Sulem, J. (2017). Effect of the hydration temperature on the microstructure of class G cement: C-S-H composition and density. Cem. Concr. Res. 95, 270–281. doi:10.1016/j.cemconres.2017.02.008
Bergold, S. T., Goetz-Neunhoeffer, F., and Neubauer, J. (2013). Quantitative analysis of C-S-H in hydrating alite pastes by in-situ XRD. Cem. Concr. Res. 53, 119–126. doi:10.1016/j.cemconres.2013.06.001
Craft, B. C., Johnson, T. J., and Kirkpatrick, H. L. (1935). Effects of temperature, pressure andwater-cement ratio on the setting time and strength of cement. Trans. AIME 114 (1), 62–68. doi:10.2118/935062-g
Ge, Z., Yao, X., Wang, X., Zhang, W., and Yang, T. (2018). Thermal performance and microstructure of oil well cement paste containing subsphaeroidal konilite flour in HTHP conditions. Constr. Build. Mater. 172, 787–794. doi:10.1016/j.conbuildmat.2018.03.268
Harris, M., Simpson, G., Scrivener, K., and Bowen, P. (2022). A method for the reliable and reproducible precipitation of phase pure high ca/si ratio (>1.5) synthetic calcium silicate hydrates (C-S-H). Cem. Concr. Res. 151 (106623), 106623. doi:10.1016/j.cemconres.2021.106623
Hesse, C., Goetz-Neunhoeffer, F., and Neubauer, J. (2011). A new approach in quantitative in-situ XRD of cement pastes: Correlation of heat flow curves with early hydration reactions. Cem. Concr. Res. 41 (1), 123–128. doi:10.1016/j.cemconres.2010.09.014
Hesse, C., Goetz-Neunhoeffer, F., Neubauer, J., Braeu, M., and Gaeberlein, P. (2009). Quantitative in situ x-ray diffraction analysis of early hydration of portland cement at defined temperatures. Powder Diffr. 24 (2), 112–115. doi:10.1154/1.3120603
Jansen, D., Goetz-Neunhoeffer, F., Lothenbach, B., and Neubauer, J. (2012). The early hydration of Ordinary Portland Cement (OPC): An approach comparing measured heat flow with calculated heat flow from QXRD. Cem. Concr. Res. 42, 134–138. doi:10.1016/j.cemconres.2011.09.001
Jansen, D., Goetz-Neunhoeffer, F., Stabler, C., and Neubauer, J. (2011). A remastered external standard method applied to the quantification of early OPC hydration. Cem. Concr. Res. 41 (6), 602–608. doi:10.1016/j.cemconres.2011.03.004
Jeong, Y. J., Youm, K. S., and Yun, T. S. (2018). Effect of nano-silica and curing conditions on the reaction rate of class G well cement exposed to geological CO2-sequestration conditions. Cem. Concr. Res. 109, 208–216. doi:10.1016/j.cemconres.2018.05.001
Jiang, T., Geng, C., Yao, X., Song, W., Dai, D., and Yang, T. (2021). Long-term thermal performance of oil well cement modified by silica flour with different particle sizes in HTHP environment. Constr. Build. Mater. 296 (123701), 123701. doi:10.1016/j.conbuildmat.2021.123701
Kuzielová, E., Slaný, M., Žemlička, M., Masilko, J., Siler, P., and Palou, M. T. (2022). Thermal stability of the phases developed at high-pressure hydrothermal curing of class G cement with different pozzolanic and latent hydraulic additives. J. Therm. Anal. Calorim. 2022, 9891–9902. doi:10.1007/s10973-022-11254-2
Liu, H., Qin, J., Zhou, B., Liu, Z., Yuan, Z., Zhang, Z., et al. (2022). Effects of curing pressure on the long-term strength retrogression of oil well cement cured under 200 °C. Energies 15 (16), 6071. doi:10.3390/en15166071
Mabeyo, P. E. (2021). Improving oil well cement strengths through the coupling of metakaolin and nanosilica. Upstream Oil Gas Technol. 7, 100048. doi:10.1016/j.upstre.2021.100048
O'Connor, B. H., and Raven, M. D. (1988). Application of the Rietveld refinement procedure in assaying powdered mixtures. Powder Diffr. 3 (1), 2–6. doi:10.1017/s0885715600013026
Paiva, L. C. M., Ferreira, I. M., Martinelli, A. E., Freitas, J. C. d. O., and Bezerra, U. T. (2019). Milled basalt fiber reinforced Portland slurries for oil well applications. J. Petroleum Sci. Eng. 175, 184–189. doi:10.1016/j.petrol.2018.11.068
Pang, X., Qin, J., Sun, L., Zhang, G., and Wang, H. (2021). Long-term strength retrogression of silica-enriched oil well cement: A comprehensive multi-approach analysis. Cem. Concr. Res. 144, 106424. doi:10.1016/j.cemconres.2021.106424
Pang, X., Sun, L., Chen, M., Xian, M., Cheng, G., Liu, Y., et al. (2022). Influence of curing temperature on the hydration and strength development of Class G Portland cement. Cem. Concr. Res. 156, 106776. doi:10.1016/j.cemconres.2022.106776
Qin, J., Pang, X., Cheng, G., Bu, Y., and Liu, H. (2021). Influences of different admixtures on the properties of oil well cement systems at HPHT conditions. Cem. Concr. Compos. 123, 104202. doi:10.1016/j.cemconcomp.2021.104202
Qin, J., Pang, X., Santra, A., Cheng, G., and Li, H. (2022). Various admixtures to mitigate the long-term strength retrogression of Portland cement cured under high pressure and high temperature conditions. J. Rock Mech. Geotechnical Eng. doi:10.1016/j.jrmge.2022.02.005
Richardson, I. G. (2008). The calcium silicate hydrates. Cem. Concr. Res. 38 (2), 137–158. doi:10.1016/j.cemconres.2007.11.005
Rietveld, H. M. (1969). A profile refinement method for nuclear and magnetic structures. J. Appl. Crystallogr. 2, 65–71. doi:10.1107/s0021889869006558
Santiago, R. C., Costa, B. L. S., Silva, F. P. F., Medeiros, R., Nascimento, R., Aum, P., et al. (2021). Sustainable cement blends for oil well steam injection using rice husk ash. J. Petroleum Sci. Eng. 199, 108281. doi:10.1016/j.petrol.2020.108281
Scarlett, N. V. Y., and Madsen, I. C. (2006). Quantification of phases with partial or no known crystal structures. Powder Diffr. 21 (4), 278–284. doi:10.1154/1.2362855
Snellings, R., Bazzoni, A., and Scrivener, K. (2014a). The existence of amorphous phase in portland cements: Physical factors affecting Rietveld quantitative phase analysis. Cem. Concr. Res. 59, 139–146. doi:10.1016/j.cemconres.2014.03.002
Snellings, R., Machiels, L., Mertens, G., and Elsen, J. (2010). Rietveld refinement strategy for quantitative phase analysis of partially amorphous zeolitized tuffaceous rocks. Geol. Belg., 183–196.
Snellings, R., Salze, A., and Scrivener, K. L. (2014b). Use of x-ray diffraction to quantify amorphous supplementary cementitious materials in anhydrous and hydrated blended cements. Cem. Concr. Res. 64, 89–98. doi:10.1016/j.cemconres.2014.06.011
Swayze, M. A. (1954). “Effects of high pressures and temperatures on strength of oil-well cements,” in API spring meeting of the mid-continent district, division of production. API-54-07.
Taylor, H. F. W. (1992). Tobermorite, jennite, and cement gel. Z. fur Kristallogr. 202, 41–50. doi:10.1524/zkri.1992.202.1-2.41
Viseshchitra, P., Ercius, P., Monteiro, P. J. M., Scott, M., Ushizima, D., Li, J., et al. (2021). 3D Nanotomography of calcium silicate hydrates by transmission electron microscopy. J. Am. Ceram. Soc. 104 (4), 1852–1862. doi:10.1111/jace.17593
Keywords: quantitative X-ray diffraction analysis, external standard, partial or no known crystal structure, strength retrogression, oil well cement
Citation: Qin J, Pang X, Li H and Zhang Z (2022) Mechanism of long-term strength retrogression of silica-enriched Portland cement assessed by quantitative X-ray diffraction analysis. Front. Mater. 9:982192. doi: 10.3389/fmats.2022.982192
Received: 30 June 2022; Accepted: 10 October 2022;
Published: 19 October 2022.
Edited by:
Xiaming Feng, Chongqing University, ChinaReviewed by:
Yuri Sotero Bomfim Fraga, Universidade Federal do Acre, BrazilCopyright © 2022 Qin, Pang, Li and Zhang. This is an open-access article distributed under the terms of the Creative Commons Attribution License (CC BY). The use, distribution or reproduction in other forums is permitted, provided the original author(s) and the copyright owner(s) are credited and that the original publication in this journal is cited, in accordance with accepted academic practice. No use, distribution or reproduction is permitted which does not comply with these terms.
*Correspondence: Xueyu Pang, eC5wYW5nQHVwYy5lZHUuY24=
Disclaimer: All claims expressed in this article are solely those of the authors and do not necessarily represent those of their affiliated organizations, or those of the publisher, the editors and the reviewers. Any product that may be evaluated in this article or claim that may be made by its manufacturer is not guaranteed or endorsed by the publisher.
Research integrity at Frontiers
Learn more about the work of our research integrity team to safeguard the quality of each article we publish.