
95% of researchers rate our articles as excellent or good
Learn more about the work of our research integrity team to safeguard the quality of each article we publish.
Find out more
ORIGINAL RESEARCH article
Front. Mater. , 18 July 2022
Sec. Structural Materials
Volume 9 - 2022 | https://doi.org/10.3389/fmats.2022.972811
 Liangqin Jiang1
 Weichen Wang1
 Jing Ji1,2*Hongguo Ren3*Qingqin Wang4Ruohan Sun3*Chenyu Yu1Huiling Zhang1Gan Luo1
In order to study the bearing capacity of high-performance concrete-filled high-strength steel tube (HCHST) composite stub columns subjected to eccentrical load, 22 HCHST composite stub columns, 4 concrete-filled steel tube (CFST) composite stub columns and 8 high-performance concrete-filled steel tube (HCST) composite stub columns were designed with the cubic compressive strength of concrete (fcu), the yield strength of steel tube (fy), the thickness of tube wall (t), the eccentricity (e) and slenderness ratio (λ) as the main parameters. Considering the nonlinear constitutive model of concrete and simplified constitutive model of steel, the finite element (FE) model of HCHST composite stub columns was established by ABAQUS software. By comparison with the existing test results, the rationality of the constitutive model and boundary conditions was verified. The variation of ultimate bearing capacity and the typical failure modes of HCHST composite stub columns under different parameters was analyzed. The results show that the specimens exhibit obvious bulge outward at the end of the steel tube and shear failure at the end of concrete. High-performance concrete (HPC) can significantly improve the ultimate eccentrical compression bearing capacity of composite columns, and high-strength steel tubes have better restraint effect on HPC. With the increasing of t, the ultimate eccentrical compression bearing capacity and the load-holding capacity of HCHST columns increases gradually, while the ultimate eccentrical compression bearing capacity decreases gradually with the increasing of λ and e. By introducing the reduction coefficient of eccentricity (
Concrete-filled steel tube (CFST) composite columns have been widely used in various building structures for their high bearing capacity, excellent plasticity and seismic performance (Wang et al., 2019; Ji et al., 2021a; Ji et al., 2021b). With the development of concrete materials (Cai et al., 2021; Ji et al., 2021c; Ding et al., 2021), high-performance concrete (HPC) (Yoo et al., 2012) has been commonly used in engineering for its self-compactness, high strength, high permeability and long service life (Huang et al., 2009; Sung et al., 2012; Wang and Liang, 2012; Yoon and Jang, 2015). The combination of HPC and high-strength steel tube (HST) has become a new trend in the development of composite structures (Yang et al., 2009). HPC-filled HST (HCHST) composite columns can not only bring into play the advantages of high strength and self-compacting of HPC, but also improve significantly the ultimate bearing capacity and the ductility of the composite columns.
A large number of studies were carried out on mechanical properties of HPC-filled steel tube (HCST) composite columns (Han and Yao, 2004; Guler et al., 2013; Ho et al., 2013; Ekmekyapar and Alhatmey, 2019). Static tests on 10 HCST composite stub columns under axial load were carried out by Gu et al. (1991), and the working mechanism and damage pattern of this kind of composite short columns were obtained, finally the calculation formula of axial bearing capacity of HCST composite short columns was proposed. Yu et al. (2002) carried out tests on 28 short columns of HCST composite stub columns under axial load, and the formulae for calculating the stress-strain curves of HCST composite short columns under axial load were proposed based on the experimental data. Tests on 8 ordinary CFST composite columns and 20 HCST composite columns subjected to axial and eccentrical loads were carried out by Yu et al. (2007), and the results showed that the main failure mode of HCST composite stub columns was the shear failure of concrete, and the ultimate bearing capacity formulae of HCST composite columns under axial and eccentrical loads given in the codes AISC, EC4 and DBJ13-51-2003 were reasonable. In 2010, tests on 18 steel reinforced self-compacting HPC-filled square steel tube composite columns under axial load were carried out by Zhu et al. (2010), and the variation regularity of the ultimate bearing capacity of this kind of composite columns with different parameters was obtained, and the calculation formula of the axial bearing capacity of composite columns was proposed based on the test data. In 2016, tests of 8 high-strength concrete-filled high-strength square steel tube composite columns under bending load were carried out by Li et al. (2019), and the results showed that the ultimate bearing capacity of composite columns under pure bending load increased gradually with the increasing of steel ratio and yield strength of steel tube, and the ultimate bearing capacity of composite columns obtained by finite element (FE) analysis was in good agreement with the calculations of EC4. In 2020, Tests and FE analysis on ultra-HPC-filled round high-strength steel tube composite stub columns subjected to axial load were conducted by Wei et al. (2019),and the results showed that high-strength steel tubes provided more effective restraint for ultra-HPC, so high-strength steel tube was a better match with ultra-HPC. In 2021, FE analysis on the bearing capacity of hollow GFRP pipe-concrete-steel tube composite long columns subjected to eccentrical load was carried out by Ji et al. (2021d), and the results showed that with the increasing of thickness of GFRP tube, steel tube, and cubic compressive strength of concrete, the ultimate eccentrical compression bearing capacity increased gradually, finally a formula for the bearing capacity of such composite columns under eccentrical load was proposed by statistical regression.
So far, the research on HPC-filled high-strength steel tube (HCHST) composite stub columns have mainly focused on the axial compression bearing capacity, however, there are few studies on bearing capacity of the composite columns subjected to eccentrical load, therefore, it is essential to carry out the research on the mechanical performance of HCHST composite columns subjected to eccentrical load. Based on the nonlinear constitutive model of concrete and simplified constitutive model of steel, the mechanical behavior of HCHST composite columns with different parameters is analyzed by ABAQUS software. The formula on bearing capacity of this kind of composite columns subjected to eccentrical load is proposed by statistical regression.
To study the mechanical behavior of HCHST composite stub columns subjected to eccentrical load, 22 HPC-filled high-strength steel tube (HCHST) composite stub columns, four CFST composite stub columns and eight HCST stub columns are designed with the cubic compressive strength of concrete (fcu), the yield strength of steel tube (fy), the wall thickness of steel tube (t), the eccentricity (e) and the slenderness ratio (λ) as the main parameters. The schematic diagram and specific parameters of the specimens are shown in Figure 1; Table 1. λ is equal to L/D in Table 1.
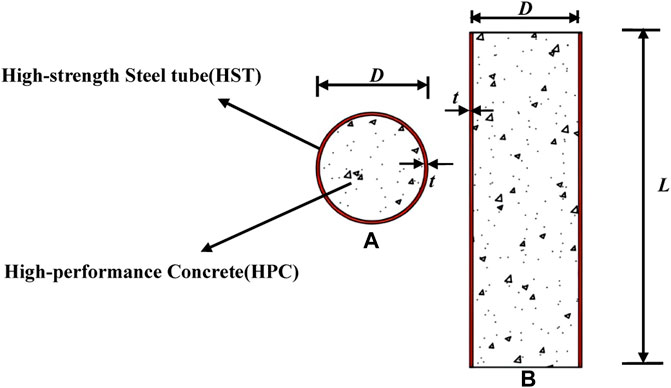
FIGURE 1. The schematic diagram and physical meaning of variables for specimens. (A) Cross section; (B) Longitudinal section.
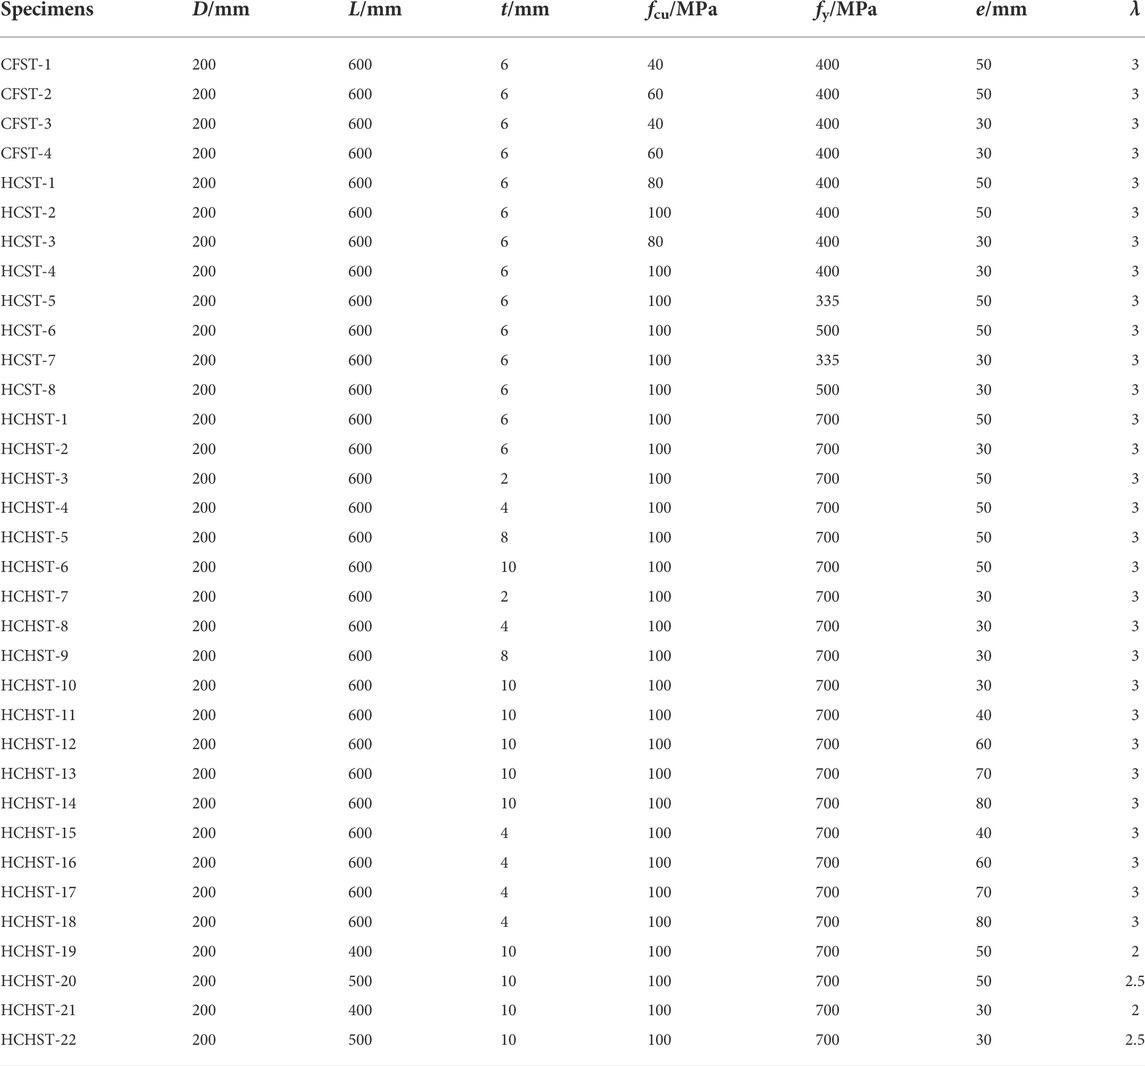
TABLE 1. Specific parameters of 22 HCHST composite columns, 4 CFST composite columns and 8 HCST composite columns.
The simplified double-broken line model is adopted as the constitutive model (CM) for steel, and 2.06
The constitutive models of concrete have been given by Han (2007), Mander et al. (1988), Teng et al. (2006), Ghorbi et al. (2013), Tao et al. (2013), Pagoulatou et al. (2014) and Qian et al. (2002) respectively, and the comparison of different constitutive models is shown in Figure 2. Yu et al. (2009) have confirmed that the constitutive model of concrete proposed by Han (2007). is applicable to high-performance concrete without fiber reinforcement, so the constitutive model of confined concrete proposed by Han (2007) is adopted here. Plastic damage model of concrete is selected accordingly during finite element modeling of ABAQUS.
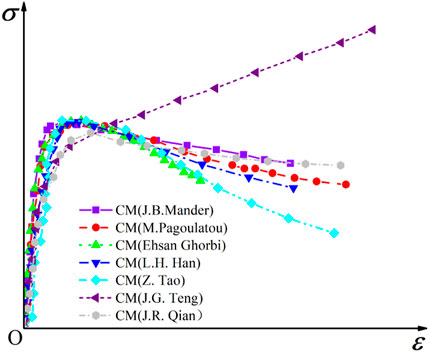
FIGURE 2. Comparison for different constitutive models of concrete.
The stress-strain relationship of concrete under uniaxial compression:
Where
The stress-strain relationship of concrete under uniaxial tension:
Where
The FE models of 34 specimens were established by ABAQUS software as shown in Figure 3. The eight-joint hexahedral element type (C3D8R) were adopted to simulate the steel tube and concrete. The nonlinear symmetrical contact between steel tube and concrete was simplified as normal hard contact and tangential friction contact, and the Coulomb friction coefficient (μ) was set as 0.6. Two reference points were set near the upper and lower surfaces of the columns, namely RP1 and RP2. The reference points were, respectively, coupled with the top end and the bottom end of the columns. The displacements (Ux, Uy, URx, URz) of the top end for columns were constrained by RP1, and the displacements (Ux, Uy, Uz, URx, URz) of the bottom end for columns were constrained accordingly by RP2.
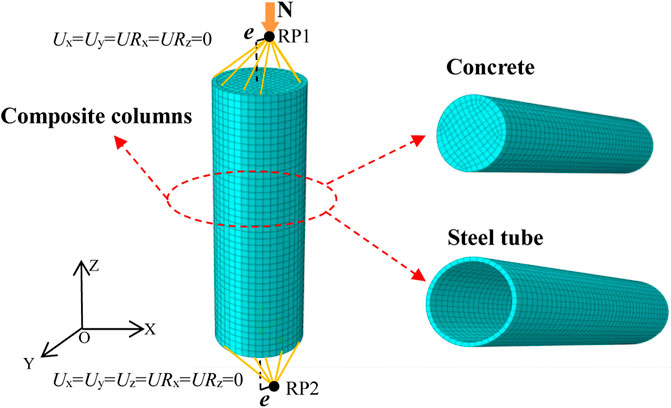
FIGURE 3. The finite element model of 34 specimens.
In order to verify the rationality of the FE models, nine groups of HPC-filled steel tube composite stub columns subjected to axial load (Wang et al., 2013) and seven groups of CFST composite columns subjected to eccentrical load (Lee et al., 2019; Yu et al., 2007; Han 2007) were selected. The specific parameters of all specimens were shown in Table 2. FE simulation analysis on 16 existing test specimens was carried out based on above FE modeling method, and the vertical load (N)-displacement (Δ) curves and mid-span load (N)-deflection (µm) curves of composite columns were obtained as shown in Figure 4. By comparing with the test curves, it could be seen from Figure 4 that the FE simulation curves were basically consistent with the test curves. The comparison between the simulated bearing capacity (
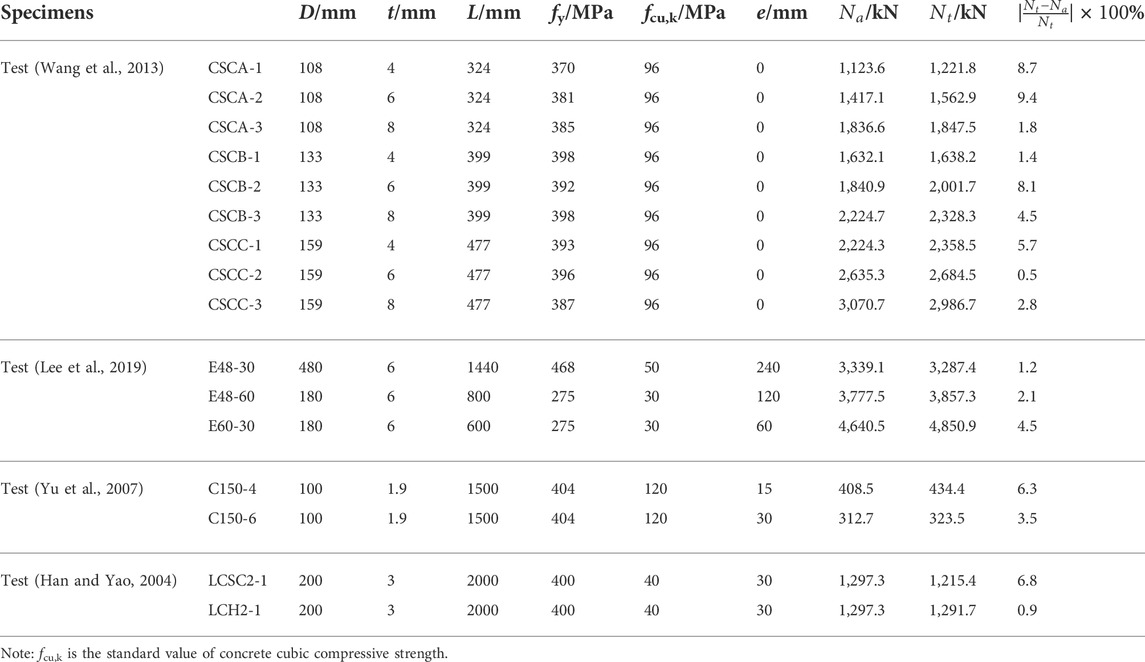
TABLE 2. Comparison between
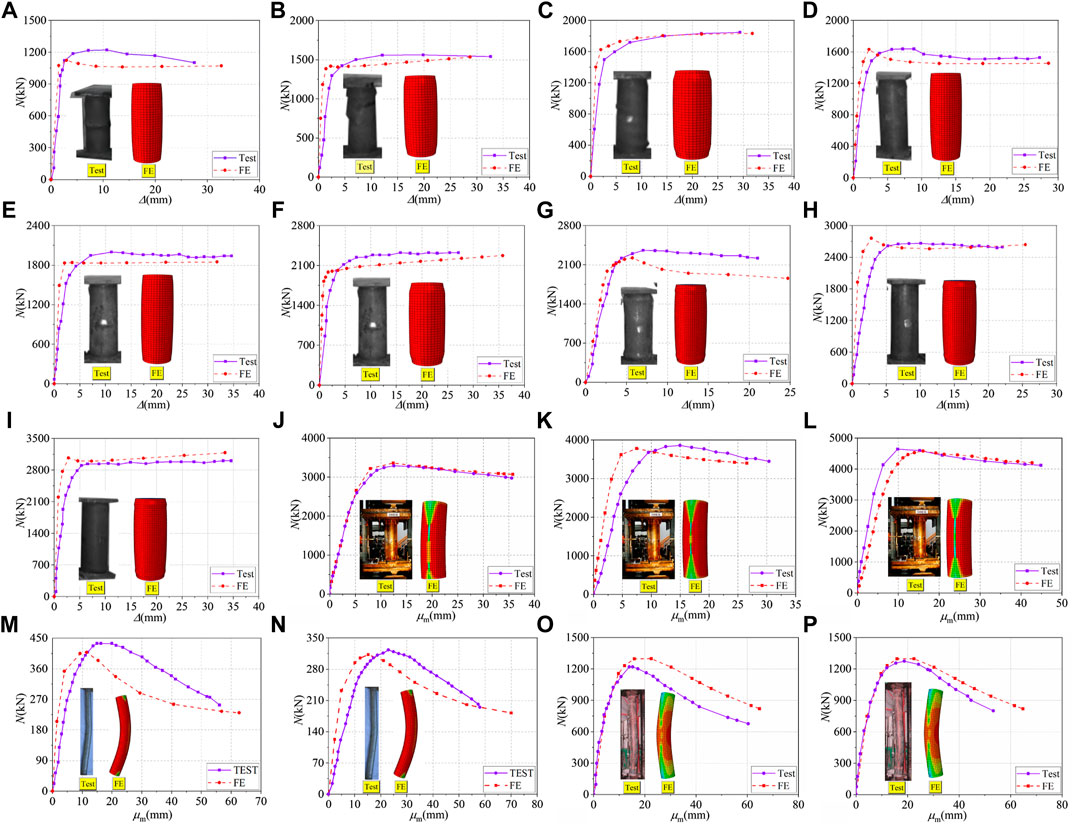
FIGURE 4. Compression for N-Δ and N-µm curves between simulation and test results: (A) CSCA-1; (B) CSCA-2; (C) CSCA-3; (D) CSCB-1; (E) CSCB-2; (F) CSCB-3; (G) CSCC-1; (H) CSCC-2; (I) CSCC-3; (J) E40-30; (K) E40-60; (L) E60-30; (M) C150-4; (N) C150-6; (O) LCSC2-1; (P) LCH2-1.
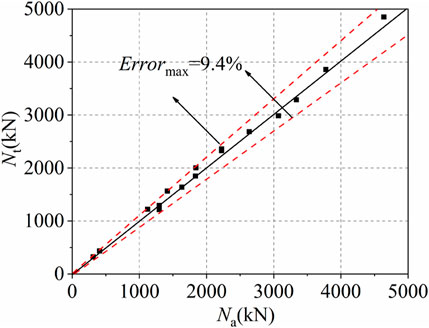
FIGURE 5. Comparsion between
FE analysis on 34 specimens (including 22 HCHST composite columns, 4 CFST composite columns and 8 HCST composite columns) subjected to eccentrical compression load are carried out by ABAQUS software. The effects of different parameters on the N-μm curves are discussed. The main parameters varied in this paper are: 1) the cubic compressive strength of concrete (fcu); 2) the yield strength of steel tube (fy); 3) the thickness of tube wall (t); 4) eccentricity (e); 5) the slenderness ratio (λ).
The comparison of N-μm curves for specimens with different fcu when the eccentricity is 30 mm and 50 mm is shown in Figures 6A,B, respectively. The ultimate eccentrical compression bearing capacity (Na) and mid-span deflection with different fcu are summarized in Table 3. We can see from Figure 6A; Table 3, when an eccentricity is equal to 50 mm, and fcu increases from 40 to 60 Mpa, 80 and 100 MPa, respectively, Na of specimens increases from 1,603.26 to 1,704.57 kN, 1,890.17 and 2,015.58 kN in turn, which increases by 6.3%, 15.2%, 21.5%, respectively. On the contrary the mid-span deflection decreases from 40.01 to 39.94 mm, 39.62 and 39.31 mm in turn, which decreases by 0.2%, 1.0%, and 1.8%, respectively. As shown in Figure 6B; Table 3, when an eccentricity is equal to 30 mm, and fcu increases from 40 to 60 Mpa, 80 and 100 MPa, respectively, Na of specimens increases from 2,015.23 to 2,116.48 kN, 2,351.03 and 2,506.09 kN in turn, which increases by 4.8%, 15.3%, and 19.6%, respectively. On the contrary the mid-span deflection decreases from 41.76 to 41.69 mm, 41.57 and 41.52 mm in turn, which decreases by 0.2%, 0.5%, and 0.6%, respectively. It can be concluded that compared with the specimens adopting ordinary concrete, Na of specimens using HPC is improved significantly, and the curves drop faster after peak load, while it has little effect on the lateral stiffness of the specimens for using HPC.
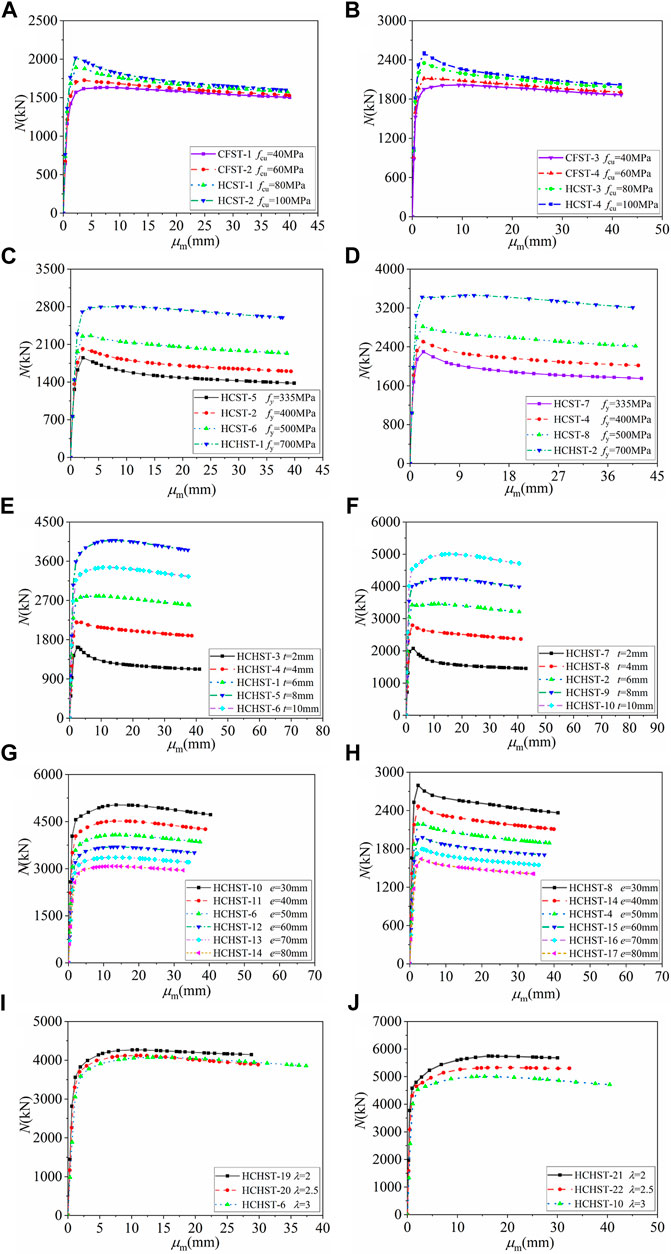
FIGURE 6. Comparison of N-μm curves with different parameters. (A) Different fcu when e = 30 mm; (B) Different fcu when e = 50 mm; (C) Different fy when e = 30 mm; (D) Different fy when e = 50 mm; (E) Different t when e = 30 mm; (F) Different t when e = 50 mm; (G) Different e when t = 4 mm; (H) Different e when t = 10 mm; (I) Different λ when e = 30 mm; (J) Different λ when e = 50 mm.
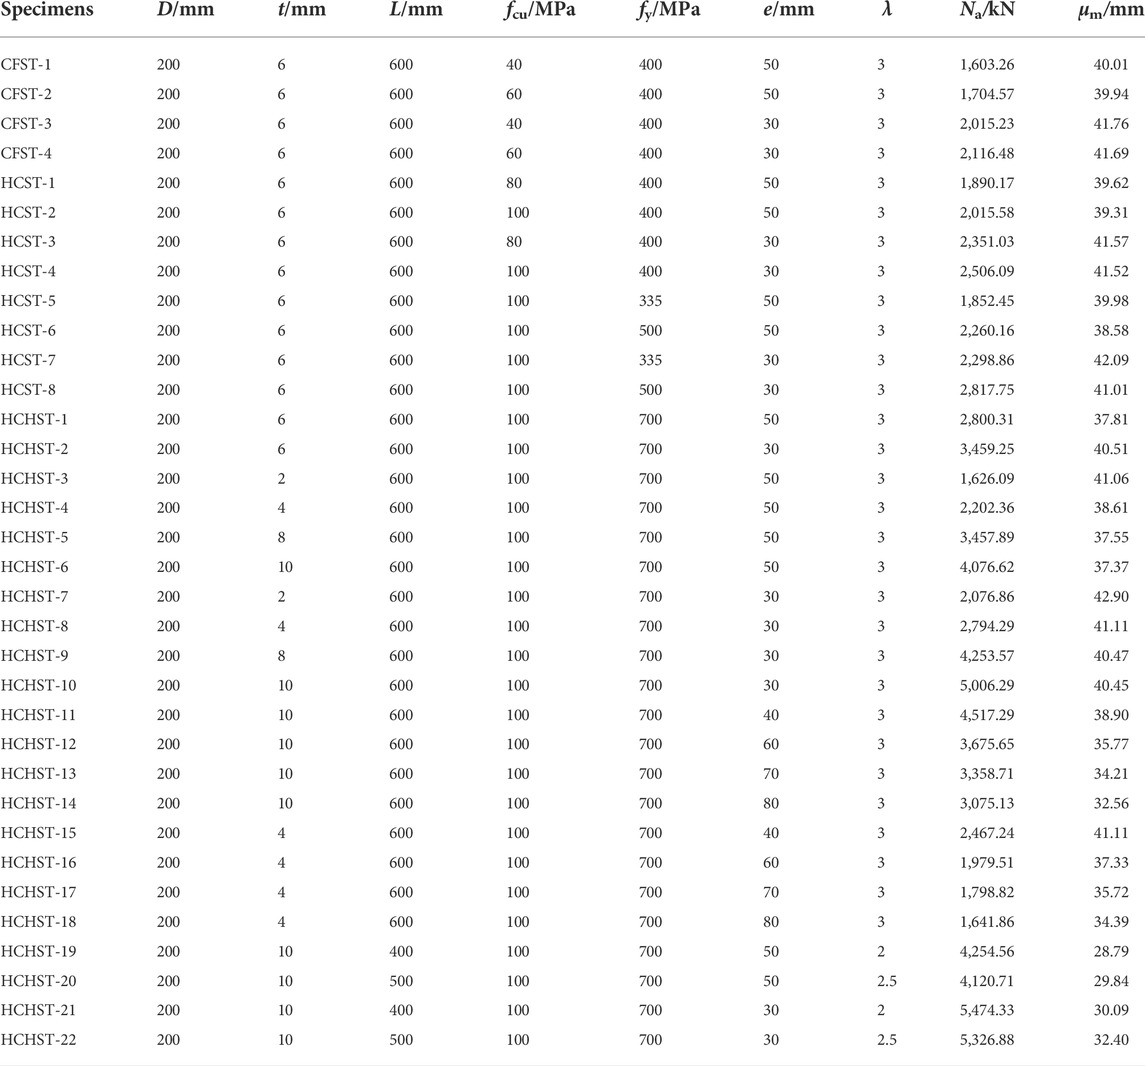
TABLE 3. The ultimate eccentrical compression bearing capacity and mid-span lateral deflection of 34 specimens.
The comparison of N-μm curves for specimens with the different fy when the eccentricity is 30 and 50 mm is shown in Figures 6C,D, respectively. Na and mid-span deflection with different fy are summarized in Table 3. As shown in Figure 6C; Table 3, when an eccentricity is equal to 50 mm, and fy increases from 335 to 400 MPa, 500 and 700 MPa, respectively, Na of specimens increases from 1,852.45 to 2,015.58 kN, 2,260.16 and 2,800.31 kN in turn, which increases by 8.1%, 18.1%, and 33.9%, respectively. On the contrary the mid-span deflection decreases from 39.98 to 39.31 mm, 38.58 and 37.81 mm in turn, which decreases by 1.7%, 3.6%, and 5.5%, respectively. As shown in Figure 6D; Table 3, when an eccentricity is equal to 30 mm, and fy increases from 335 to 400 MPa, 500 and 700 MPa, respectively, Na of specimens increases from 2,298.86 to 2,506.09 kN, 2,817.75 and 3,459.25 kN in turn, which increases by 8.2%, 18.5%, and 33.6%, respectively. On the contrary the mid-span deflection decreases from 42.09 to 41.52 mm, 41.01 and 40.51 mm in turn, which decreases by 1.4%, 2.6%, and 3.8%, respectively. It can be concluded that compared with the specimens using ordinary steel tube, Na of specimens using HST is improved significantly, and the curves drop more slowly after peak load, and the load-holding (Ji et al., 2020) capacity increases gradually, while it has little effect on the lateral stiffness of the specimens for using HST. The restraint effect of HST on concrete is stronger than ordinary steel tube.
The comparison of N-μm curves for specimens with different t when the eccentricity is 30 and 50 mm is shown in Figures 6E,F, respectively. Na and mid-span deflection with different t are summarized in Table 3. As shown in Figure 6E; Table 3, when an eccentricity is equal to 50 mm, and t increases from 2 to 4 mm, 6 mm, 8 mm, and 10 mm, respectively, Na of specimens enhances from 1,626.09 to 2,202.36 kN, 2,800.31 kN, 3,457.89 kN, and 4076.62 kN in turn, which increases by 26.2%, 34.9%, 53%, and 61%, respectively. On the contrary the mid-span deflections decreases from 41.06 to 38.61 mm, 37.81 mm, 37.55 mm, and 37.37 mm in turn, which decreases by 5.9%, 8.0%, 8.5%, and 8.9%, respectively. As shown in Figure 6F; Table 3, when an eccentricity is equal to 30 mm, and t increases from 2 to 4 mm, 6 mm, 8 mm, and 10 mm, respectively, Na of specimens enhances from 2,076.86 to 2,794.29 kN, 3,424.41 kN, 4,253.57 kN, and 5,006.29 kN in turn, which increases by 26.7%, 39.5%, 51.2%, and 59.6%, respectively. On the contrary the mid-span deflections decreases from 42.90 to 41.11 mm, 40.51 mm, 40.47 mm, and 40.45 mm in turn, which decreases by 4.2%, 5.6%, 5.7%, and 5.8%, respectively. It can be concluded that with the increasing of t, Na of the HCHST composite columns increases obviously, and the curves drop more slowly after peak load, and the load-holding capacity increases progressively, while mid-span deflection reduces gradually, so the lateral stiffness (Ji et al., 2022) of the specimens can be improved by increasing t.
The comparison of N-μm curves for specimens with different e when t is 4 and 10 mm is shown in Figures 6G,H, respectively. Na and mid-span deflection with different e are summarized in Table 3. As shown in Figure 6G; Table 3, when t is equal to 10 mm, and e increases from 30 to 40 mm, 50 mm, 60 mm, 70 mm, and 80 mm, respectively, Na of specimens decreases from 5,006.29 to 4,517.29 kN, 4,076.62 kN, 3,675.65 kN, 3,358.71 kN, and 3,078.13 kN in turn, which decreases by 11.2%, 19.1%, 27.3%, 34.2%, and 39.5% ,respectively. The mid-span deflection decreases from 40.45 to 38.90 mm, 37.37 mm, 35.77 mm, 34.21 mm, and 32.56 mm in turn, which decreases by 3.7%, 7.5%, 11.4%, 14.3%, and 19.4%, respectively. As shown in Figure 6H; Table 3, when t is equal to 4 mm, and e increases from 30 to 40 mm, 50 mm, 60 mm, 70 mm, and 80 mm, respectively, Na of specimens decreases from 2,794.29 to 2,467.24 kN, 2,202.36 kN, 1,979.51 kN, 1,798.82 kN, and 1641.86 kN in turn, which decreases by 11.8%, 21.9%, 28.5%, 35.7%, and 39.5%, respectively. The mid-span deflection decreases from 41.11 to 39.97 mm, 38.61 mm, 37.33 mm, 35.72 mm, and 34.39 mm in turn, which decreases by 2.8%, 5.9%, 8.8%, 13.2%, and 16.4%, respectively. It can be concluded that with the increasing of e, Na of the HCHST composite columns decreases gradually, and mid-span deflection decreases accordingly.
The comparison of N-μm curves for specimens with different λ when e is 30 and 50 mm is shown in Figures 6I,J, respectively. Na and mid-span deflection with different λ are summarized in Table 3. As shown in Figure 6I; Table 3, when e is equal to 50 mm, and λ increases from 2 to 2.5 and 3 in turn, Na decreases from 4,254.56 to 4,120.71 kN, 4,076.62 kN, respectively, which decreases by 3.2% and 4.2%, respectively. While the mid-span deflection increases from 28.79 to 29.84 mm and 37.37 mm in turn, which increases by 3.6% and 18.8%, respectively. As shown in Figure 6J; Table 3, when e is equal to 30 mm, and λ increases from 2 to 2.5 and 3 in turn, Na decreases from 5,474.33 to 5,326.68 kN, 5,001.72 kN, respectively, which decreases by 2.8%, 8.7%, respectively. While the mid-span deflection increases from 30.09 to 32.40 mm and 40.45 mm in turn, which increases by 7.2% and 25.7%, respectively. It can be concluded that with the increasing of λ, Na of the HCHST composite columns decreases gradually, on the contrary the lateral deflection increases obviously.
Lateral deflection curves of three typical specimens [HCHST-10 (e = 50 mm), HCHST-6 (e = 30 mm) and HCHST-14 (e = 80 mm)] are shown in Figure 7. It can be seen that when the load increases gradually from zero to 0.92
Where
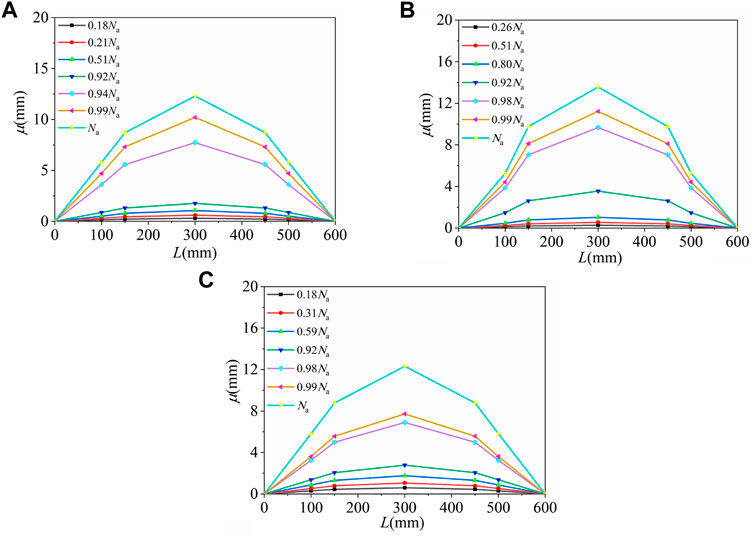
FIGURE 7. Lateral deflection curves for three typical specimens. (A) HCHST-10; (B) HCHST-6; (C) HCHST-14.
The load (N) versus strain (ε) relationships of the mid-span section for three typical specimens [HCHST-10 (e = 50 mm), HCHST-6 (e = 30 mm) and HCHST-14 (e = 80 mm)] are shown in Figure 8. In this paper, it is asummed that the tensile strain is positive and the compressive strain is negative. It can be seen that in the initial of loading, the strain of each parts of HCHST composite columns changed linearly, thereby indicating that the composite columns were at the elastic stage. When the load increased to 80% of the peak load, the longitudinal strain begins to grow non-linearly. When the load increases to the peak load, the steel tube reaches yield strength, and then the strain increases rapidly until the specimen is damaged. As shown in Figure 8, with the increasing of the eccentricity, the decline rate of the load-strain curves after peak load decreases gradually. High-strength steel tubes of each specimen can reach yield strength, and the high-strength steel tubes can make full use of the restraint effect when the HCHST composite columns are subjected to the eccentric compression load.
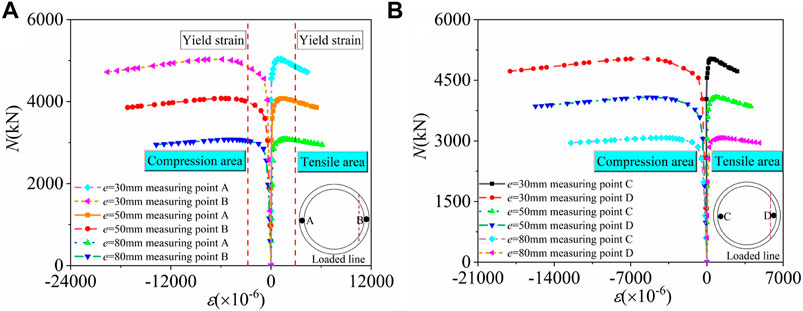
FIGURE 8. N-ε curves with different eccentricity: (A) Load-strain curves of steel tube; (B) Load-strain curves of concrete.
In order to make clear whether the HCHST composite columns satisfy the plane cross-section assumption. Three typical specimens [HCHST-10 (e = 50 mm), HCHST-6 (e = 30 mm) and HCHST-14 (e = 80 mm)] are selected from 22 HCHST composite columns, and the longitudinal strain distribution curves of its mid-span section are drawn as shown in Figure 9. It can be seen that longitudinal strain curves of the mid-span section show insignificant differences with the gradual increase of load. The strain varies linearly along with the height of the section, which shows that the mid-span section accords with the plane cross-section assumption.
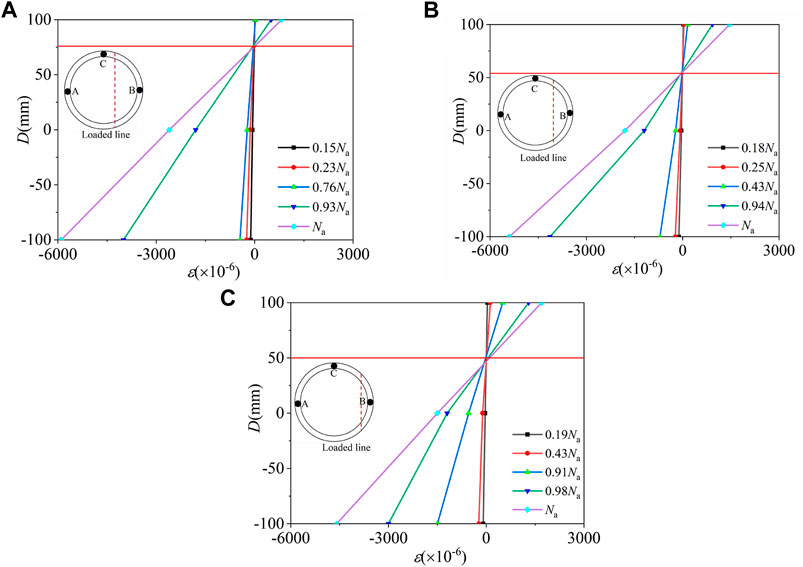
FIGURE 9. Longitudinal strain distribution curves of mid-span sections for three typical specimens: (A) HCHST-10; (B) HCHST-6; (C) HCHST-14.
The lateral deflection curve of the HCHST composite columns presents sinusoidal half-wave distribution. The stiffness of HCHST composite columns subjected to eccentrical compression load can be expressed as:
Where
The HCHST composite columns are accompanied by material destruction in the loading process, resulting in a gradual decrease in the effective stress area of the cross-section of the composite columns and the comprehensive deformation modulus of materials. So the flexural stiffness of composite columns cannot keep a constant value but decreases gradually with the increasing of lateral deflection. According to Eq. 4, stiffness degradation curves of specimens with different parameters are given in Figure 10. The vertical ordinate in the Figure 10 is the ratio of secant stiffness (EI) to initial stiffness (EI0). It can be seen from Figure 10 that the element is in the elastic location at the initial loading stage, and the stiffness does not vary. With the increasing of
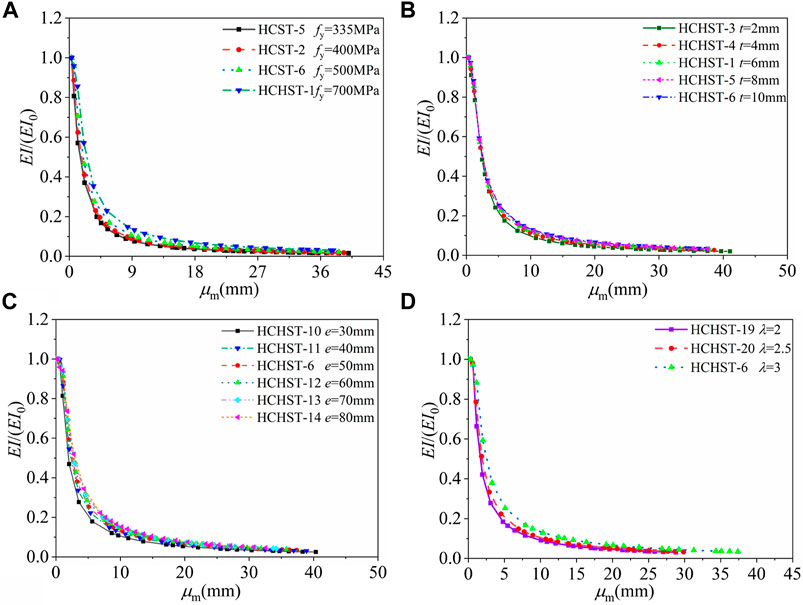
FIGURE 10. Stiffness degradation curves with different parameters: (A) Stiffness degradation curves with different fy; (B) Stiffness degradation curves with different t; (C) Stiffness degradation curves with different e; (D) Stiffness degradation curves with different λ.
The longitudinal stress distribution and longitudinal strain distribution diagram of concrete and steel tube in each loading stage of typical specimen HCHST-6 are shown in Figures 11, 12. During the initial stage of loading, the HCHST composite columns can be considered to be at the elastic work stage. With the increasing of load gradually, the longitudinal stress of the steel tube is approximately distributed in a band, the stress on the compression side of the steel tube is greater than that on the tension side, and the steel tube reaches the proportional limit. At this time, there is less contact between the steel tube and the concrete, each component were almost in independent working stage, the concrete is stressed evenly, the longitudinal stress is distributed in a band, and the specimen is in a compressed state as a whole. When the load increased to 80% of peak load, composite columns begin to enter the elastic-plastic stage, and the steel tube enters the yield stage. When the specimen reaches the peak load, the plastic strain in the concrete compression area begins to concentrate to the mid-span section, the stress concentration occurs at the upper and lower ends of the concrete compression side, and the stress on the compression side is significantly greater than that on the tensile side. When the specimens reach the peak load, the HCHST composite columns begin to enter the plastic stage with the gradual increasing of deflection, and the steel tube in the tension area in the compression area reaches the yield strength. And the steel tube begin to buckling failure occurs at the end of the test specimens, as shown in Figure 13. Due to the local buckling of the end of steel tube, the transverse restraint effect of the steel tube on the concrete in this area is reduced, resulting in local shear failure of the concrete in this area, as shown in Figure 14. With the increasing of deflection, cracks occur in the concrete tension area, when the load dropped to 85% of the peak load, the area of concrete tension zone increases, most steel tube in tension zone and compression zone reach yield strength.
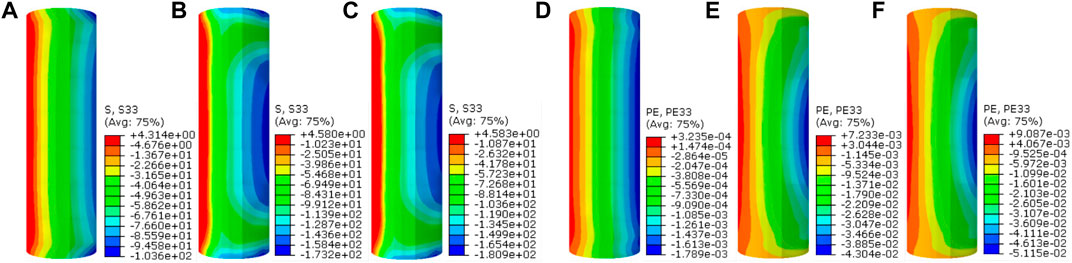
FIGURE 11. Distribution of longitudinal stresses and longitudinal strains of concrete at each loading stages of typical specimen HCHST-6: (A) Longitudinal stress distribution of concrete at elastic stage; (B) Longitudinal stress distribution of concrete at elastic-plastic stage; (C) Longitudinal stress distribution of concrete at plastic stage; (D) Longitudinal strain distribution diagram of concrete at elastic stage; (E) Longitudinal strain distribution diagram of concrete at elastic-plastic stage; (F) Longitudinal strain distribution diagram of concrete at plastic stage.
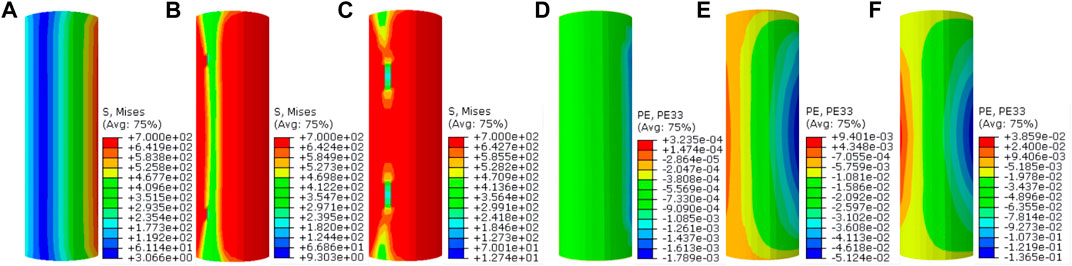
FIGURE 12. Distribution of MIES stresses and longitudinal strains of steel tubes at each loading stage of typical specimen HCHST-6: (A) The MISES stress distribution of steel tube at elastic stage; (B) The MISES stress distribution of steel tube at elastic-plastic stage; (C) The MISES stress distribution of steel tube at plastic stage; (D) Longitudinal strain distribution diagram of steel tube at elastic stage; (E) Longitudinal strain distribution diagram of steel tube at elastic-plastic stage. (F) Longitudinal strain distribution diagram of steel tube at plastic stage.
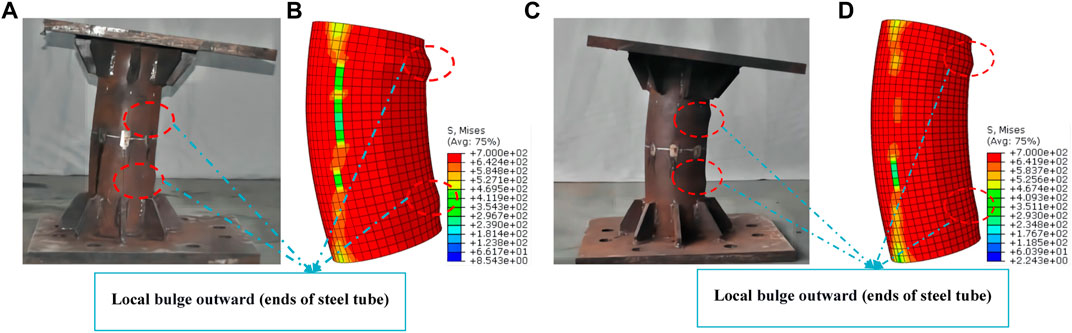
FIGURE 13. Comparison of simulated and experimental failure modes (A) The failure mode of test specimens from reference Luo et al. (2021); (B) The failure mode of HCHST-19; (C) The failure mode of test specimens from reference Luo et al. (2021); (D) The failure mode of HCHST-20.
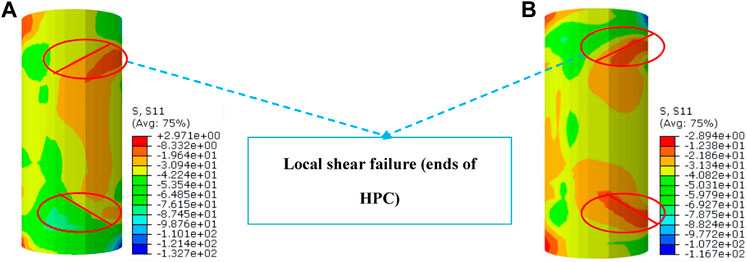
FIGURE 14. Local shear of concrete at the end of two typical specimens. (A) HCHST-19; (B) HCHST-20.
The ultimate bearing capacity formula of HPC-filled steel tube (HCST) composite stub columns under axial load has been put forward by Yu et al. (2002):
Where,
The ultimate bearing capacity of CFST stub columns subjected to eccentrical load is usually expressed in the form of axial force-moment equation, but this kind of expression is not suitable for engineering application. Therefore, in order to facilitate the application of engineering, the eccentricity reduction coefficient (
Where,
Equation 6 is used to calculate the ultimate bearing capacity
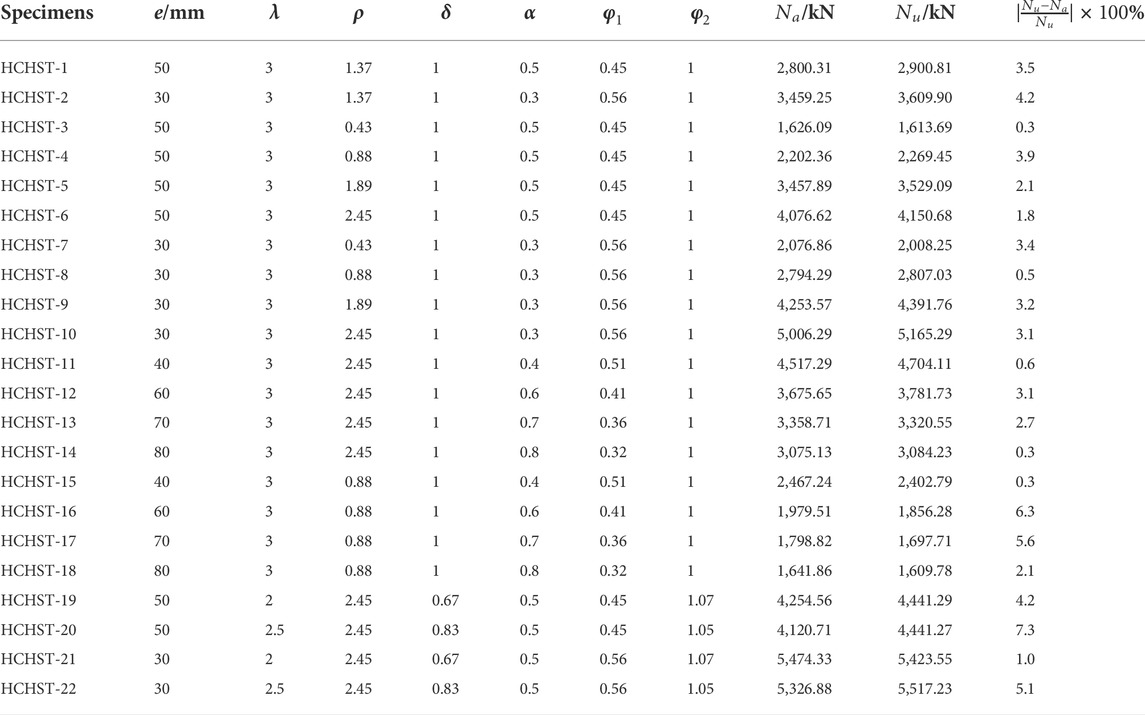
TABLE 4. Comparison between
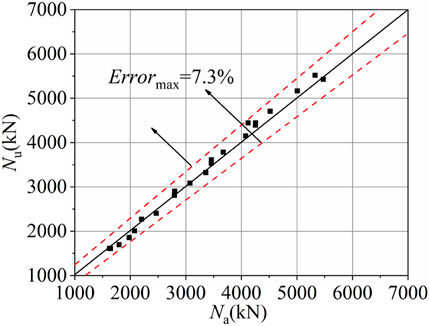
FIGURE 15. Comparison between simulated and calculated bearing capacity of 22 HCHST composite columns.
The finite element models of 22 HCHST composite columns, 4 CFST composite columns and 8 HCST composite columns subjected to eccentrical load are established by ABAQUS software. The load-deflection curves of the specimens are obtained during the whole process. The effect of different parameters on the ultimate eccentric compression bearing capacity of specimens is discussed. The calculation formula which is suitable for the eccentric bearing capacity of the HCHST composite columns is deduced by statistical regression. The specific conclusions can be drawn as follows:
1) Based on the simplified constitutive model of steel and the constrained concrete constitutive model, the numerical simulation of 34 stub columns subjected to eccentric load was conducted by ABAQUS software. The load-displacement curves and failure modes of specimens were obtained. By comparing with the test data, it could be found that the curves were in good agreement, and the failure modes were similar. The rationality of the constitutive model of materials and modeling method was verified.
2) Compared with the specimens using ordinary concrete, the specimens using HPC exhibit brittle behavior. The restraint effect of high-strength steel tube on HPC is stronger than ordinary steel tube, and high-strength steel tube with thick wall is more suitable for the HCHST composite columns. With the increasing of steel tube wall thickness, the ultimate bearing capacity of the HCHST composite columns is continuously improved. In contrast, the mid-span lateral deflection of composite columns is gradually reduced. With the increasing of the eccentricity and the slenderness ratio, the ultimate bearing capacity of the HCHST composite columns subjected to eccentrical load decreases by degrees.
3) With the increasing of steel tube wall thickness and eccentricity, the stiffness degradation rate of HCHST composite columns decreases gradually and the ductility of HCHST composite columns increases by degrees. The longitudinal strain distribution curve of mid-span section of HCHST composite columns is linear with the increasing of compression load, which meets the plane section assumption. The main failure modes of HCHST composite columns under eccentrical compression load include buckling at the end of steel tubes and shear failure at the end of concrete. The restraint effect of high-strength steel tube on HPC is stronger compared with ordinary steel tube.
4) Based on the existing ultimate axial compression bearing capacity formula of HPC-filled steel tube stub columns, the eccentricity reduction coefficient (
The original contributions presented in the study are included in the article/Supplementary Material, further inquiries can be directed to the corresponding authors.
LJ: Finite element simulation, writing; WW: Finite element simulation, writing; JJ: Translation; HR: Translation; QW: Writing; RS: Translation; CY: Writing; HZ and GL: Writing. All authors contributed to the article and approved the submitted version.
The authors are grateful for the financial support received from the National Natural Science Foundation of China (Grant no. 51178087); The Natural Science Foundation of Heilongjiang Province (Grant no. LH2020E018); Scientific Research Fund of Institute of Engineering Mechanics, China Earthquake Administration (Grant no. 2020D07); 2021 Social Science Development Research Project of Hebei Province (Grant no. 20210301135); Humanities and Social Science Research Project of Higher Education Institutions of Hebei Province (Grant no. SQ2021115), and Northeast Petroleum University Guided Innovation Fund (Grant no.2020YDL-02).
QW was employed by China Academy of Building Research Co., Ltd.
The remaining authors declare that the research was conducted in the absence of any commercial or financial relationships that could be construed as a potential conflict of interest.
All claims expressed in this article are solely those of the authors and do not necessarily represent those of their affiliated organizations, or those of the publisher, the editors and the reviewers. Any product that may be evaluated in this article, or claim that may be made by its manufacturer, is not guaranteed or endorsed by the publisher.
American Concrete Institute (2005). Building code requirements for structural concrete and commentary, ACI 318-05. Farmington Hills (MI), Detroit, USA: American Concrete Institute.
Cai, Z. W., Liu, F. C., Yu, J. T., Yu, K. Q., and Tian, L. K. (2021). Development of ultra-high ductility engineered cementitious composites as a novel and resilient fireproof coating. Constr. Build. Mater. 288, 123090. doi:10.1016/j.conbuildmat.2021.123090
Ding, Y., Yu, K. Q., and Li, M. (2021). A review on high-strength engineered cementitious composites (HS-ECC): Design, mechanical property and structural application. Structures 35, 903–921. doi:10.1016/j.istruc.2021.10.036
Ekmekyapar, T., and Alhatmey, I. A. H. (2019). Post-fire resistance of internally ring stiffened high performance concrete filled steel tube columns. Eng. Struct. 183, 375–388. doi:10.1016/j.engstruct.2019.01.024
Ghorbi, E., Soltania, M., and Maekawab, K. (2013). Development of a compressive constitutive model for FRP-confined concrete elements. Composite:Part B 45, 504–517. doi:10.1016/j.compositesb.2012.07.014
Gu, W. P., Cai, S. H., and Feng, W. L. (1991). Behavior and ultimate strength of steel tubes filled with high strength concrete. Build. Sci. 1, 23–27. doi:10.13614/j.cnki.11-1962/tu.1991.01.005
Guler, S., Çopur, A., and Aydogan, M. (2013). Axial capacity and ductility of circular uhpc-filled steel tube columns. Mag. Concr. Res. 65, 898–905. doi:10.1680/macr.12.00211
Han, L. H. (2007). Concrete filled steel tube structures: Theory and practice. Beijing: Science Press.
Han, L. H., and Yao, G. H. (2004). Experimental behaviour of thin-walled hollow structural steel (HSS) columns filled with self-consolidating concrete (SCC). Thin-walled Struct. 42, 1357–1377. doi:10.1016/j.tws.2004.03.016
Ho, J. C. M., Lai, M. H., and Luo, L. (2013). Uniaxial behaviour of confined high-strength concrete-filled-steel-tube columns. Proc. Institution Civ. Eng. - Struct. Build. 167, 520–533. doi:10.1680/stbu.13.00004
Huang, C. K., Shang, Z. Q., and Zhang, P. (2009). Experimental research on self-stressing and self-compacting concrete-filled steel tube columns subjected to eccentric load. Front. Archit. Civ. Eng. China 3. RESEARCH ARTICLE. 2009-09-23. doi:10.1007/s11709-009-0058-6
Ji, J., He, L. J., Jiang, L. Q., Ren, H, Ni, S, Wang, Z, et al. (2021b). Seismic behavior of GFRP tube reactive powder concrete composite columns with encased steel. Front. Mater. 8, 793392. doi:10.3389/fmats.2021.793392
Ji, J., Kang, W., Jiang, L. Q., Li, Y, Ren, H, Hao, S, et al. (2021c). Mechanical behavior of reactive powder concrete made from local material subjected to axial pressure. Front. Mater. 8, 737646. doi:10.3389/fmats.2021.737646
Ji, J., Yu, C. Y., Jiang, L. Q., Zhan, J, Ren, H, Hao, S, et al. (2022). Bearing behavior of H-shaped honeycombed steel web composite columns with rectangular concrete-filled steel tube flanges under eccentrical compression load. Adv. Civ. Eng. 2022, 2965131. doi:10.1155/2022/2965131
Ji, J., Yu, D. Y., Jiang, L. Q., Liu, Y. C., Yang, M. M., Song, H. Y., et al. (2020). Research on axial compression bearing capacity of different-strength concrete-filled double steel tube stub columns. Build. Struct. 50 (5), 120–129. doi:10.19701/jjzjg2020.05.021
Ji, J., Zeng, W., Jiang, L. Q., Bai, W, Ren, H, Chai, Q, et al. (2021a). Hysteretic behavior on asymmetrical composite joints with concrete-filled steel tube columns and unequal high steel beams. Symmetry 13 (12), 2381. doi:10.3390/sym13122381
Ji, J., Zeng, W., Wang, R. L., Ren, H, Zhang, L, Liu, Y, et al. (2021d). Bearing capacity of hollow FRP tube-concrete-high strength steel tube composite long columns under eccentric compression load. Front. Material 9, 27. doi:10.3389/fmats.2021.768877
Lee, H. J., Parka, H. G., and Choi, I. R. (2019). Eccentric compression behavior of concrete-encased-and-filled steel tube columns with high-strength circular steel tube. Thin-Walled Struct. 144, 106339. doi:10.1016/j.tws.2019.106339
Li, G. C., Liu, D., Yang, Z. J., and Zhang, C. Y. (2019). Flexural behavior of high strength concrete filled high strength square steel tube. J. Constr. Steel Res. 128, 732–744. doi:10.1016/j.jcsr.2016.10.007
Luo, X., Wei, J. G., Han, J. P., and Chen, B. C. (2021). Experimental study on compression performance of ultra-high-strength concrete (UHSC) filled high-strength steel tube stub columns subjected to eccentric load. J. Build. Struct 42 (Suppl. 2), 271–277. doi:10.14006/j.jzjgxb2021.S2.0032
Mander, J. B., Priestley, M. J. N., and Park, R. (1988). Theoretical stress-strain model for confined concrete. J. Struct. Eng. 114 (8), 1804–1826. doi:10.1061/(asce)0733-9445(1988)114:8(1804)
Mao, M., Tong, K. T., Zhang, J. L., Liu, T., and Li, Y. (2021). Experimental study on the mechanical performance of steel-bamboo composite I-section columns under eccentric loading. J. Build. Struct. 42 (8), 126–135. doi:10.4006/j.jzjgxb.2019.0414
Pagoulatou, M., Sheehan, T., Dai, X. H., and Lam, D. (2014). Finite element analysis on the capacity of circular concrete-filled double-skin steel tubular (CFDST) stub columns. Eng. Struct. 72, 102–112. doi:10.1016/j.engstruct.2014.04.039
Qian, J. R., Chen, L. R., and Zhou, D. L. (2002). Central compression behavior of concrete columns confined by ordinary stirrups. Tsinghua Sci. Technol. 42 (10), 1369–1373. doi:10.16511/j.cnki.qhdxxb.2002.10.024
Sung, W. Y., Seung-Jun, K., and Jung, S. H. (2012). Analysis technique for autogenous shrinkage in high performance concrete with mineral and chemical admixtures. Constr. Build. Mater. 34, 1–10. doi:10.1016/j.conbuildmat.2012.02.005
Tao, Z., Wang, Z. B., and Yu, Q. (2013). Finite element modelling of concrete-filled steel stub columns under axial compression. J. Constr. Steel Res. 89, 121–131. doi:10.1016/j.jcsr.2013.07.001
Teng, J. G., Yu, T., Wong, Y. L., and Dong, S. (2006). Hybrid FRP–concrete–steel tubular columns: Concept and behavior. Constr. Build. Mat. 21 (4), 846–854. doi:10.1016/j.conbuildmat.2006.06.017
Wang, F. C., Zhao, H. Y., and Han, L. H. (2019). Analytical behavior of concrete-filled aluminum tubular stub columns under axial compression. Thin-Walled Struct. 140 (30), 21–30. doi:10.1016/j.tws.2019.03.019
Wang, Q. L., Hou, T. T., Li, Q. G., and Wang, Y. (2013). Static performance of the high-performance concrete filled steel tube stub column (1): Experimental study and fine element simulation. Ind. Constr. 43 (3), 24–29. doi:10.13204/j.gyjz201303005
Wang, Z. J., and Liang, J. B. (2012). Research and applying evolution of admixture for high-performance concrete. Appl. Mech. Mater. 2012 (174-177), 1086–1189. doi:10.4028/AMM
Wei, J. G., Luo, X., Ou, Z. J., and Chen, B. (2019). Experiment study on axial compressive behavior of circular UHPC filled high-strength tube stub columns. J. Build. Strustures 41, 16–28. doi:10.14006/j.jzjgxb.2019.0337
Yang, Y. B., Liang, S., Mo, H. H., Chen, Y. W., Chen, J. S., and Ba, L. Z. (2009). Research on high-performance concrete-filled steel tube columns structure experiments of guangzhou xita Project. Key Eng. Mater. 405-406, 50–54. doi:10.4028/www.scientific.net/KEM.405-406.50-40
Yoo, S. W., Kwon, S. J., and Jung, S. H. (2012). Analysis technique for autogenous shrinkage in high-performance concrete with mineral and chemical admixtures. Constr. Build. Mater. 34 (12), 1–10. doi:10.1016/j.conbuildmat.2012.02.005
Yoon, Y. S., and Jang, I. Y. (2015). Effects of quality of compaction on flexural behaviour of high-performance concrete beams. Mag. Concr. Res. 54 (4), 283–290. doi:10.1680/macr.54.4.283.38804
Yu, Q., Tao, Z., and Wu, Y. X. (2009). Behavior of high-performance concrete-filled steel tube columns subjected to eccentric loading. Eng. Mech. 26 (10), 87–094.
Yu, Q., Tao, Z., and Wu, Y. X. (2007). Experimental behaviour of high performance concrete-filled steel tubular columns. Thin-Walled Struct. 2008-46 (4), 362–370. doi:10.1016/j.tws.2007.10.001
Yu, Z. W., Ding, F. X., and Lin, S. (2002). Researches on behavior of high-performance concrete-filed steel tube stub columns. J. Build. Struct. 23 (2), 41–47. doi:10.14006/j.jzjgxb.2002.02.006
Keywords: HCHST composite stub columns, high-performance concrete, high-strength steel, eccentrical load, bearing capacity
Citation: Jiang L, Wang W, Ji J, Ren H, Wang Q, Sun R, Yu C, Zhang H and Luo G (2022) Bearing behavior of high-performance concrete-filled high-strength steel tube composite columns subjected to eccentrical load. Front. Mater. 9:972811. doi: 10.3389/fmats.2022.972811
Received: 19 June 2022; Accepted: 27 June 2022;
Published: 18 July 2022.
Edited by:
Kequan Yu, Tongji University, ChinaReviewed by:
Nan Guo, Northeast Forestry University, ChinaCopyright © 2022 Jiang, Wang, Ji, Ren, Wang, Sun, Yu, Zhang and Luo. This is an open-access article distributed under the terms of the Creative Commons Attribution License (CC BY). The use, distribution or reproduction in other forums is permitted, provided the original author(s) and the copyright owner(s) are credited and that the original publication in this journal is cited, in accordance with accepted academic practice. No use, distribution or reproduction is permitted which does not comply with these terms.
*Correspondence: Jing Ji, amlqaW5nMTk3N0AxNjMuY29t; Hongguo Ren, cmVuaG9uZ2d1bzc3MTEyNkAxNjMuY29t; Ruohan Sun, UnVvSGFuU3VuaGJnY0AxNjMuY29t
Disclaimer: All claims expressed in this article are solely those of the authors and do not necessarily represent those of their affiliated organizations, or those of the publisher, the editors and the reviewers. Any product that may be evaluated in this article or claim that may be made by its manufacturer is not guaranteed or endorsed by the publisher.
Research integrity at Frontiers
Learn more about the work of our research integrity team to safeguard the quality of each article we publish.