
94% of researchers rate our articles as excellent or good
Learn more about the work of our research integrity team to safeguard the quality of each article we publish.
Find out more
ORIGINAL RESEARCH article
Front. Mater., 22 July 2022
Sec. Metamaterials
Volume 9 - 2022 | https://doi.org/10.3389/fmats.2022.965260
This article is part of the Research TopicAcoustic and Mechanical Metamaterials for Various Applications - Volume IIView all 8 articles
 Meilian Huang1,2
 Xiao Liang1,2*
 Liang Su1,2*Xingyun He3Danni Li2
 Jiaming Chu2Shengsheng Wang2Haofeng Liang2Yongyan Zhang4
In this study, we use numerical methods to study the acoustic streaming effect of the acoustic black hole (ABH). Firstly, we build an ABH model to study the acoustic streaming effect. By deriving the waves equations and solving the Navier–Stokes equations, we obtain the flow field, sound field, and temperature field under the acoustic excitation. Secondly, the simulation result reveals the mechanism of acoustic streaming effects on the sound transmission characteristics of cavity ABH. The numerical results show that the abrupt decrease in the sound pressure is caused by the great changes in the velocity gradient caused by the catastrophe of cross section. The energy of the sound waves can also be dissipated by the thermal viscous layer at low frequencies. Finally, based on the acoustic streaming effects of the acoustic medium in the ABH, we propose feasible methods to enhance the sound insulation. Increasing the cross section of the cavity in ABH can get a better sound insulation effect at high frequencies, and decreasing the cross section can improve Sound Transmission Loss (STL). Through optimization, STL can reach more than 25 dB at low frequencies.
Designing an acoustic black hole (ABH) structure is a method to suppress the sound waves (Denis et al., 2016; Gao et al., 2020; Gao and Lu, 2020). A flexural wave propagating in a power-law wedge at the end of a beam would progressively slow down and concentrate the wave energy at the tip of the wedge, which is affected by ABH (Mironov, 1988; Ma et al., 2021; Gao et al., 2022; Ma et al., 2022). In contrast, a small truncation end thickness at the tip of ABH can break the ABH effect, especially for low-frequency sound waves (Gao et al., 2019; Gao et al., 2021a; Gao et al., 2021b).
The ABH has attracted many researchers’ attention. They analyzed the effects of defects at the truncated thickness to find ways to decrease the effect. One popular way is to add the nonlinear geometry into the ABH, which can enhance the ABH effect (Denis et al., 2017; Li et al., 2019). The nonlinear geometry causes the energy cascade and wave turbulence, which can transfer energy from low frequency to high frequency to reduce the cut-off frequency and enlarge the ABH effect frequency range. It can improve the global passive vibration and sound radiation mitigation characteristics (Denis et al., 2017; Li et al., 2021).
Another popular way is to use the cavity ABH structure. One cavity ABH is called a sonic black hole (SBH), which is a series of rings with a power-law decaying inner radius installed in a duct. When the end is open, the Sound Transmission Loss (STL) at high frequency can reach more than 30 dB and even has good sound absorption performance. However, there is a large reflection at low frequency, and the STL is also lower than 10 dB (Mi et al., 2021; Zhang and Cheng, 2021). Many studies have been conducted on sound absorption and insulation in view of acoustics. Many cavity ABH structures have been designed to achieve a better sound insulation effect (Mironov and Pislyakov, 2002; EI-Ouahabi et al., 2015a; EI-Ouahabi et al., 2015b; Mironov and Pislyakov, 2020). Xiao Liang purposed a comparatively large model of ABH and calculated the flow field in the cavity. Results reveal that the turbulence of the acoustic medium affects the acoustic transmission mechanism and illustrate that the acoustic streaming effects decide the acoustic transmission characteristics (Liang et al., 2019; Liang et al., 2021a; Liang et al., 2021b; Liang et al., 2022). Inspired by those excellent jobs, we proposed a cavity ABH to analyze its acoustic streaming effects and the sound transmission mechanism. In the study, we deeply explore the relationship between the acoustic streaming effects and the sound transmission mechanism, which has been rarely researched.
In this study, we propose a numerical simulation model and derive the governing equations. We get the flow, sound, and temperature fields by solving the governing equations in Section 2. In Section 3, by analyzing the numerical results, we explore the influence of streaming effects on the acoustic characteristics of the cavity ABH. By studying the flow, sound, and temperature fields, we discuss the relation between the acoustic streaming effects and the sound field. The conclusion is given in Section 4.
A numerical simulation model is established to study the acoustic streaming effect and sound transmission mechanism of cavity ABH, as shown in Figure 1A. The spatial shape can be swept by two planes and a curve between the two planes. By using Curve 1, Curve 2, Curve 3, Area 1, Area 2, Area 3, and Area 4, the complex spatial shape of ABH can be formed. The specific equations of the curves are shown in Table 1. The detailed geometrical structure parameters of the cavity ABH are defined in Figure 1B. The overall length of ABH is 28 mm. The perfect match layer (PML) and the background sound field are symmetrical in the model. The lengths of the PML and the background sound field are 2 and 10 mm, respectively. The length between Area 1 and Area 2 is 7.5 mm. The shape of Area 1 and Area 2 is 12.7 × 25.4 mm and 3 × 3 mm rectangles, respectively. The length of the cavity is 9.5 mm, and the biggest section in the cavity is Area 3, a 22.9 × 12.2 mm rectangle. The pipe is 10 mm long; it has a section of 3 × 3 mm rectangle. The rest of the sizes are performed in Figure 1B.
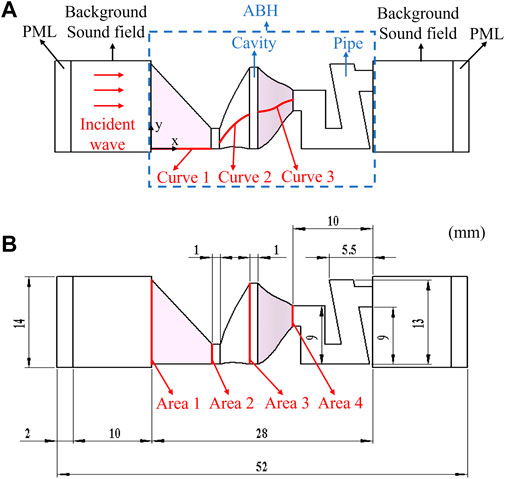
FIGURE 1. The simulation model of the cavity ABH.
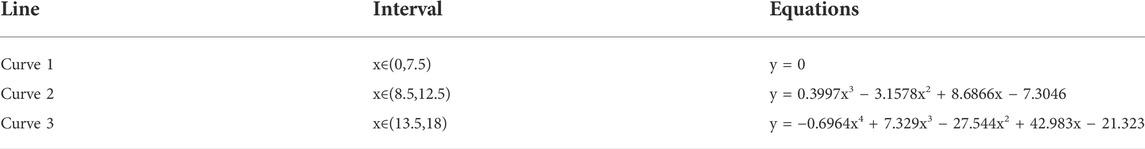
TABLE 1. The equations of the curves.
The schematic diagram of the mesh division of the cavity ABH model is shown in Figure 2. We use a tetrahedron element to mesh the ABH model and use a triangle element to link up the background sound field and the ABH model. Then, we sweep the background sound field and the PML by Tetrahedral mesh. To ensure the accuracy of the simulation, we set the mesh division of the cavity ABH model with the maximum unit of the grid lmax as
and the minimum unit of the grid lmin is
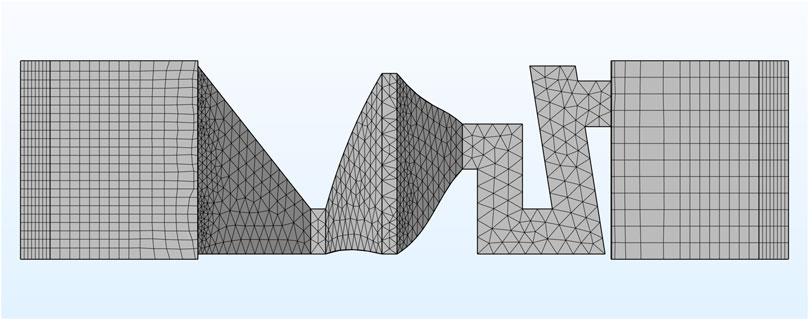
FIGURE 2. The mesh division of the cavity ABH.
The incident sound waves in the background sound field are
where
The sound pressure in a nonlinear thermos-viscous sound field is
where p is the background pressure and p = 1 atm.
The mass conservation equation in the frequency domain is
where
where
where
The momentum equations, which are also Navier–Stokes equations in the frequency domain, can be expressed
where the term on the right side of Eq. 15 represents the dispersion of the stress tensor and
where
The energy conservation equation is
where
The boundary condition on the wall is
By the above equations, the flow, sound, and temperature fields can be calculated. In Section 3, we will give the detailed simulation results for further analysis.
We obtain the velocity field at different frequencies by calculating the governing equations, as shown in Figure 3. The sound waves propagate to the tip of the cavity at a relatively high speed (see the red dashed box) but decelerate in the cavity (see the yellow dashed box). The waves undergo acceleration and deceleration again as they go through the pipe and out of the ABH (see the orange dashed box and blue dashed box). Meanwhile, it can be observed that the low frequencies waves go through the ABH steadily. When the frequency increases, the motion of the sound waves becomes chaotic (see the yellow and orange dashed box).
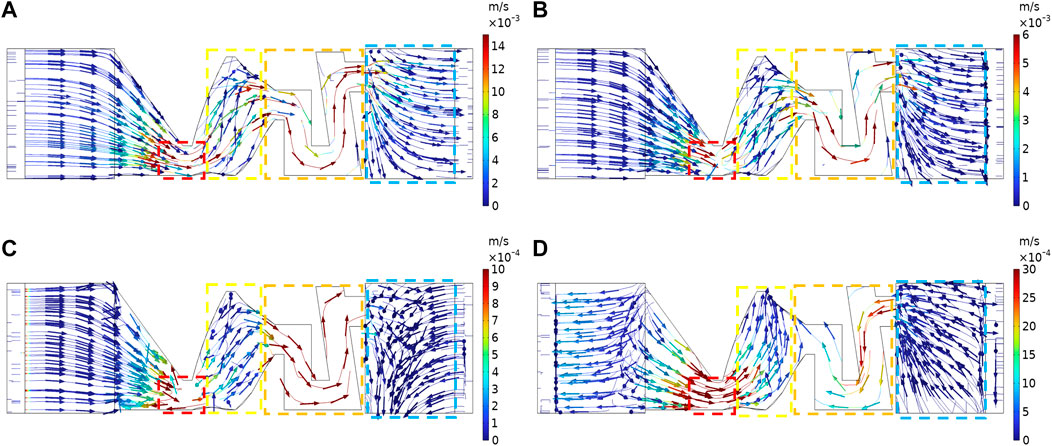
FIGURE 3. The velocity fields. (A) f = 40 Hz; (B) f = 200 Hz; (C) f = 1250 Hz; (D) f = 3150 Hz.
The observation of the sound pressure level distribution and the comparison with the velocity field (shown in Figure 4) reveal that the acoustic streaming effects determine sound pressure distribution. Because of the reduction of the tip and pipe section, the sound waves are compressed. This causes an increase in velocity and results in a raise of sound pressure (see the green dashed box). In contrast, the sudden increase in space inside the cavity broadens the distance between each streamline, which decreases the sound pressure (see the purple dashed box in Figures 4A,B). When the waves leave the ABH, they undergo the procession of wave compression and rarefaction for the second time. The low-frequency waves are less affected by ABH because of relatively long wavelengths, which are longer than the length of the ABH. The sound waves can easily pass the ABH, and the sound pressure reduces gradually (see Figures 4A,B). This is how the low-frequency waves go through the ABH. However, as the medium- and high-frequency waves enter the cavity, because of their short wavelength, the nodes of the sound wave are encountered as they travel to the tip (see the green dashed box in Figure 4D). At the same time, the waves are compressed in the cavity, lending the high sound pressure of the cavity (see the purple dashed box in Figures 4A,B). In the process of the sound wave passing through ABH, its motion is affected, and the sound pressure is also changed. Moreover, the result is that the sound pressure at the exit decreases.
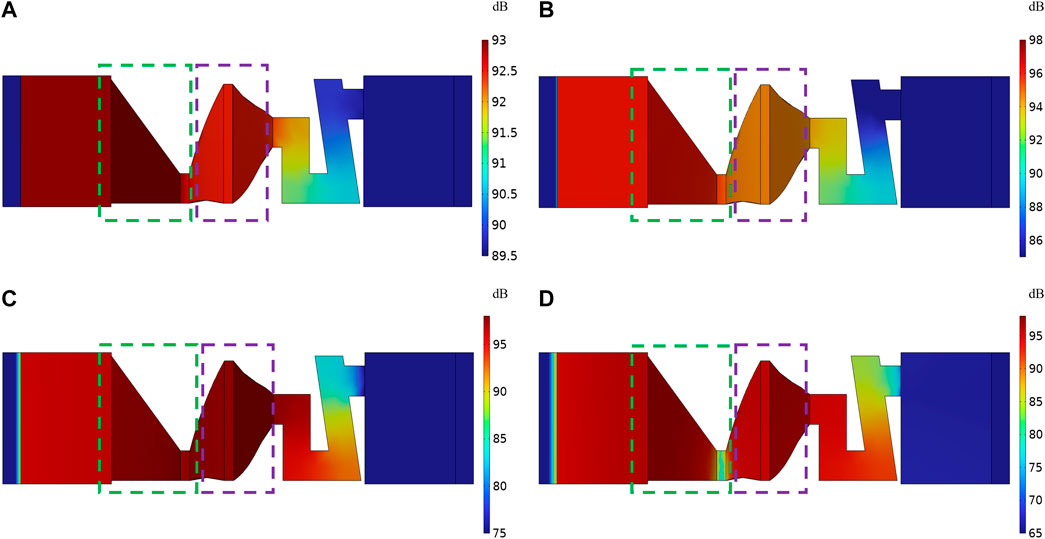
FIGURE 4. The sound pressure level distribution. (A) f = 40 Hz; (B) f = 200 Hz; (C) f = 1250 Hz; (D) f = 3150 Hz.
Figure 5 shows the temperature field. We notice an obvious temperature gradient in the ABH (the black dashed box in Figure 5). It is mainly due to the dissipation effect of the boundary layers. Acoustic viscous boundary layers and thermal boundary layers can dissipate acoustic energy in the form of heat. The thickness of the acoustic viscous boundary and the thickness of the thermal boundary layer can be calculated by the following equation:
where f is frequency, μ is the viscosity coefficient, and ρ0 is the initial density of the fluid.
where Cp is the heat capacity and λ is the coefficient of thermal conductivity. At 40, 200, 1,250, and 3,150 Hz, the thickness of the viscous boundary layer is 0.346, 0.155, 0.062, and 0.039 mm, respectively. With the decrease in frequency, the layer becomes thicker.
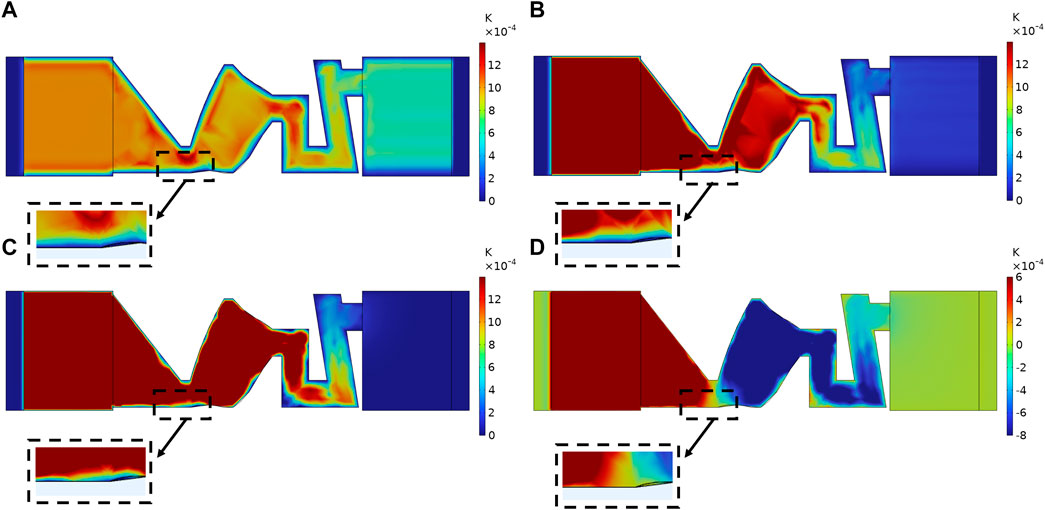
FIGURE 5. Temperature field distribution. (A) f = 40 Hz; (B) f = 200 Hz; (C) f = 1250 Hz; (D) f = 3150 Hz.
To further explore the acoustic energy dissipation in cavity ABH, we study the density of thermal-power consumption. Figure 6 shows that, at low frequencies, the thickness of the thermal viscous layer is relatively thick at the boundary and part of the energy is dissipated by the layer (shown in Figures 6A,B). The thermal consumption is mainly situated at a small scale. As the frequency increases, the thermal viscous layer becomes thinner, dissipating less acoustic energy. The thermal-power consumption is distributed in all the ABH (Figures 6C,D).
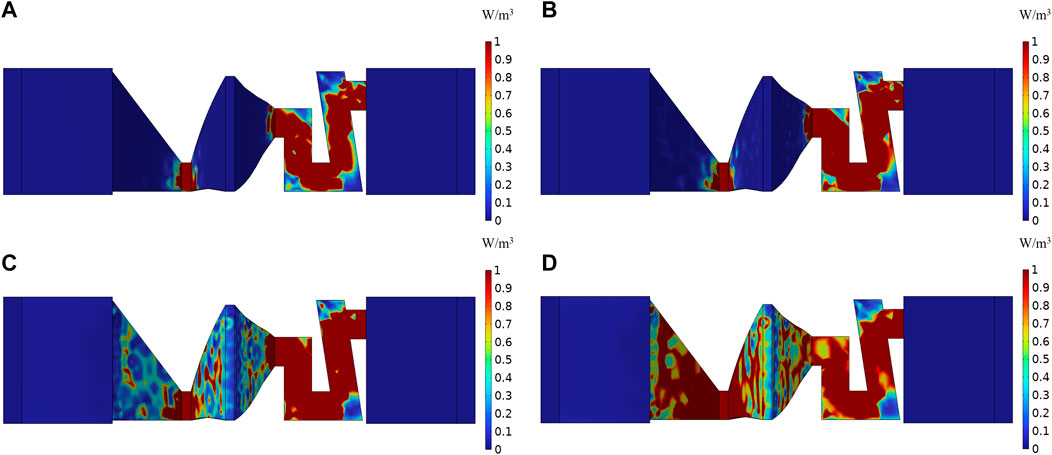
FIGURE 6. Thermal-power density distribution of the cavity ABH. (A) f = 40 Hz; (B) f = 200 Hz; (C) f = 1250 Hz; (D) f = 3150 Hz.
Through learning, we find that the cavity with a sudden change area can alter the velocity in the cavity and then influence the change of sound pressure. To deeply investigate this characteristic, we propose three models, changing the largest area of the cavity and observing the effect of the area change. The largest areas of Model 1, Model 2, and Model 3 are 6.8 × 15.2 mm, 12.2 × 22.9 mm, and 14.6 × 27.4 mm, respectively.
Figure 7 is the sound pressure level at different frequencies of three cavity ABHs. The sound waves of 40 Hz are less influenced by the ABH, which causes a small drop in sound pressure. While the sound waves of 2,000 Hz can be located in the cavity, the sound waves of 5,000 Hz are clustered at the tip, resulting in a decrease in the sound pressure at the exit. By contrasting the three models, we notice that Model 3 has a greater decrease in the sound pressure in the cavity at high frequencies, as shown in Figure 7C.
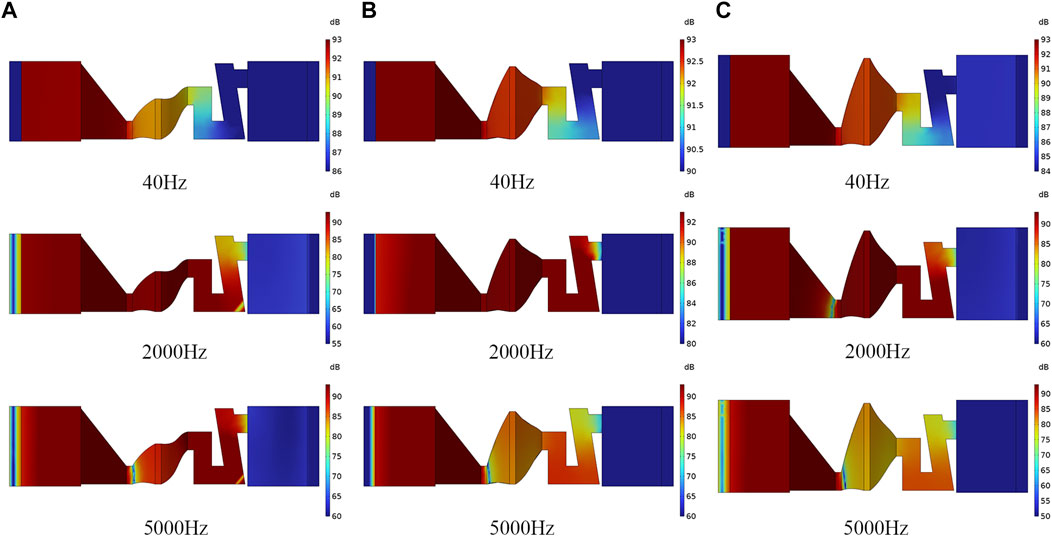
FIGURE 7. The sound pressure level at different frequencies in different models. (A) Model 1; (B) Model 2; (C) Model 3.
We calculate the STL and show the result of three models in Figure 8. The STL can be defined as
where
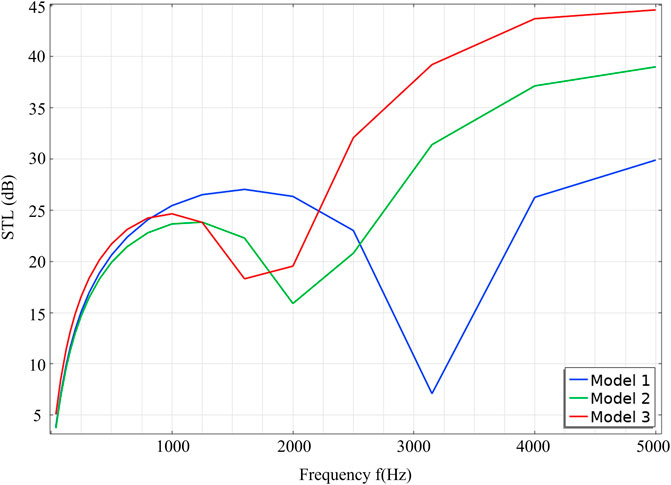
FIGURE 8. The STL of three models.
The three curves are almost the same at low frequencies, which supports the conclusion that the area change of the cavity has a small influence on the low-frequency waves and no improvement in sound insulation at low frequencies. However, the motion of the sound waves with high frequencies is affected more, so the sound pressure drops more at the exit of ABH. This illuminates that increasing the cross section of the cavity lend to better sound insulation at high frequencies.
We also notice that the tip and the pipe of ABH can effectively insulate the sound waves. Therefore, we change the cross section of the hole and pipe. The areas of small scale in the three models are 1 × 1 mm, 2 × 2 mm, and 3 × 3 mm, respectively.
Figures 9, 10 show the sound pressure level at different frequencies and the STL of three models. As shown in Figure 9, with the reduction in the tip and pipe’s cross-sectional area, the sound pressure drops more at each frequency. Besides, the smaller cross section of the tip can also easily focus the high-frequency sound waves on the tip (shown in Figure 9 at 2,000 and 5,000 Hz). In Figure 10, we can observe that reducing the cross-sectional area of the tip and the pipe can improve the sound insulation effect of the whole frequency band. In the low-frequency band, as the side length is reduced from 3 to 1 mm, STL can be increased by about 20 dB. The sound insulation effect is more significant in the frequency band exceeding 2,000 Hz.
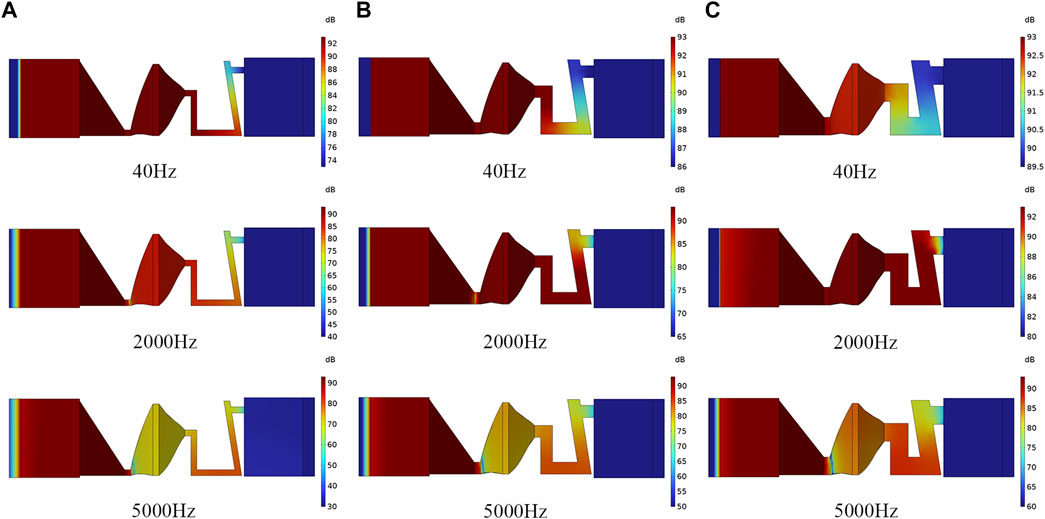
FIGURE 9. The sound pressure level at different frequencies in different models. (A) Model 1; (B) Model 2; (C) Model 3.
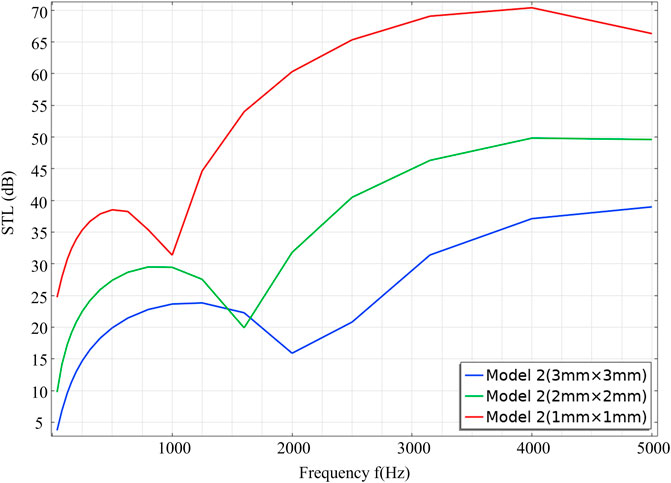
FIGURE 10. The STL of three models.
We propose a theoretical model of cavity ABH to investigate its acoustic streaming effects. The flow, sound, and temperature fields at different frequencies are obtained by governing equations.
From the comparison of the velocity field and the sound pressure level field, it can be seen that the velocity field is closely related to the sound pressure level field, and the reduced cross section causes an increase in velocity, resulting in an increase in sound pressure. On the contrary, the decrease in speed caused by the enlarged cross-section causes a decrease in sound pressure. Thus, we conclude that the sound flow effect determines the sound pressure distribution. In addition, when we study the temperature field, we find that there is an obvious temperature gradient, which is mainly caused by the dissipation effect of the thermal viscous boundary layer.
At the same time, combined with the closely related characteristics of sound flow effect and sound pressure, we propose methods to improve the sound insulation effect. The first is to increase the area of cross section in the cavity, which can improve the isolation of high-frequency sound waves. The second is to reduce the cross-sectional area of the small size, which can better isolate the sound waves in the full frequency band. This provides new ideas for low-frequency sound insulation.
The original contributions presented in the study are included in the article/Supplementary Material. Further inquiries can be directed to the corresponding authors.
Conception and design: XL, MH, and JC; analysis and/or interpretation of data: SW, JC, HL and DL; drafting the manuscript: XL and MH; revising the manuscript critically for important intellectual content: XL and YZ.
Author XH is employed by Jianglu Electromechanical group Co., Ltd.
The remaining authors declare that the research was conducted in the absence of any commercial or financial relationships that could be construed as a potential conflict of interest.
All claims expressed in this article are solely those of the authors and do not necessarily represent those of their affiliated organizations or those of the publisher, the editors, and the reviewers. Any product that may be evaluated in this article, or claim that may be made by its manufacturer, is not guaranteed or endorsed by the publisher.
Denis, V., Pelat, A., and Gautier, F. (2016). Scattering effects induced by imperfections on an acoustic black hole placed at a structural waveguide termination. J. Sound Vib. 362, 56–71. doi:10.1016/j.jsv.2015.10.016
Denis, V., Pelat, A., Touzé, C., and Gautier, F. (2017). Improvement of the acoustic black hole effect by using energy transfer due to geometric nonlinearity. Int. J. Non-Linear Mech. 94, 134–145. doi:10.1016/j.ijnonlinmec.2016.11.012
Ei-Ouahabi, A., Krylov, V. V., and O’Boy, D. (2015). “Investigation of the acoustic black hole termination for sound waves propagating in cylindrical waveguides,” in Proceedings of the inter-noise and noise-con congress and conference (San Francisco, USA: Institute of Noise Control Engineering).
Ei-Ouahabi, A., Krylove, V. V., and O’Boy, D. (2015). “Experimental investigation of the acoustic black hole for sound absorption in air,” in Proceedings of 22nd international congress on sound and vibration (Florence, Italy).
Gao, N., Guo, X., Deng, J., Cheng, B., and Hou, H. (2021). Elastic wave modulation of double-leaf ABH beam embedded mass oscillator. Appl. Acoust. 173, 107694. doi:10.1016/j.apacoust.2020.107694
Gao, N., and Lu, K. (2020). An underwater metamaterial for broadband acoustic absorption at low frequency. Appl. Acoust. 169, 107500. doi:10.1016/j.apacoust.2020.107500
Gao, N., Luo, D., Cheng, B., and Hou, H. (2020). Teaching-learning-based optimization of a composite metastructure in the 0-10 kHz broadband sound absorption range. J. Acoust. Soc. Am. 148, EL125–EL129. doi:10.1121/10.0001678
Gao, N., Wang, B., Lu, K., and Hou, H. (2021). Complex band structure and evanescent Bloch wave propagation of periodic nested acoustic black hole phononic structure. Appl. Acoust. 177, 107906. doi:10.1016/j.apacoust.2020.107906
Gao, N., Wei, Z., Hou, H., and Krushynska, A. O. (2019). Design and experimental investigation of V-folded beams with acoustic black hole indentations. J. Acoust. Soc. Am. 145, EL79–EL83. doi:10.1121/1.5088027
Gao, N., Zhang, Z., Deng, J., Guo, X., Cheng, B., and Hou, H. (2022). Acoustic metamaterials for noise reduction: A review. Adv. Mater. Technol. 7, 2100698. doi:10.1002/admt.202100698
Li, H., Sécail-Géraud, M., and Pelat, A. (2021). Experimental evidence of energy transfer and vibration mitigation in a vibro-impact acoustic black hole[J]. Appl. Acoust. 182, 1–5. doi:10.1016/j.apacoust.2021.108168
Li, H., Touzé, C., and Pelat, A. (2019). A vibro-impact acoustic black hole for passive damping of flexuralbeam vibrations”[J]. J. Sound Vib. 450, 28–46. doi:10.1016/j.jsv.2019.03.004
Liang, X., Chu, J., Tan, J., Nie, S., and Liu, B. (2021). Spontaneous catastrophe behaviour in acoustic black holes at low frequencies. Appl. Acoust. 180, 108109. doi:10.1016/j.apacoust.2021.108109
Liang, X., Chu, J., Zhou, Z., Hu, C., Peng, J., Liu, B., et al. (2022). Turbulence in cavity acoustic black hole[J]. Mech. Syst. Signal Process. 165, 108303. doi:10.1016/j.ymssp.2021.108303
Liang, X., Wang, S., Liu, M., Nie, S., Peng, J., Zhou, Z., et al. (2021). Study on low frequency sound insulation characteristic of thin acoustic black hole. Mod. Phys. Lett. B 35, 2150198. doi:10.1142/s0217984921501980
Liang, X., Zhou, Z., and Wu, J. H. (2019). The experimental study on low frequency sound transmission characteristics of the acoustic black hole[J]. Mod. Phys. Lett. B 33 (6), 1950458. doi:10.1142/s021798491950458x
Ma, F., Huang, Z., Liu, C., and Wu, J. H. (2022). Acoustic focusing and imaging via phononic crystal and acoustic metamaterials. J. Appl. Phys. 131, 011103. doi:10.1063/5.0074503
Ma, F., Wang, C., Liu, C., and Wu, J. H. (2021). Structural designs, principles, and applications of thin-walled membrane and plate-type acoustic/elastic metamaterials. J. Appl. Phys. 129, 231103. doi:10.1063/5.0042132
Mi, Y., Zhai, W., Cheng, L., Xi, C., and Yu, X. (2021). Wave trapping by acoustic black hole: Simultaneous reduction of sound reflection and transmission. Appl. Phys. Lett. 118, 114101. doi:10.1063/5.0042514
Mironov, M. A. (1988). Propagation of a flexural wave in a plate whose thickness decreases smoothly to zero in a finite interval. Sov. Phys. Acoust. 34 (3), 318–319.
Mironov, M., and Pislyakov, V. (2002). One-dimensional acoustic waves in retarding structures with propagation velocity tending to zero. Acoust. Phys. 48, 347–352. doi:10.1134/1.1478121
Mironov, M., and Pislyakov, V. (2020). One-dimensional sonic black holes: Exact analytical solution and experiments. J. Sound. Vib. 473, 115223. doi:10.1016/j.jsv.2020.115223
Keywords: cavity acoustic black hole, acoustic streaming effects, acoustic transmission mechanism, sound insulation, numerical analysis
Citation: Huang M, Liang X, Su L, He X, Li D, Chu J, Wang S, Liang H and Zhang Y (2022) The numerical analysis of the acoustic streaming effect of a cavity acoustic black hole. Front. Mater. 9:965260. doi: 10.3389/fmats.2022.965260
Received: 09 June 2022; Accepted: 27 June 2022;
Published: 22 July 2022.
Edited by:
Fuyin Ma, Xi’an Jiaotong University, ChinaReviewed by:
Xiaofei Lyu, Tianjin University, ChinaCopyright © 2022 Huang, Liang, Su, He, Li, Chu, Wang, Liang and Zhang. This is an open-access article distributed under the terms of the Creative Commons Attribution License (CC BY). The use, distribution or reproduction in other forums is permitted, provided the original author(s) and the copyright owner(s) are credited and that the original publication in this journal is cited, in accordance with accepted academic practice. No use, distribution or reproduction is permitted which does not comply with these terms.
*Correspondence: Xiao Liang, bGlhbmd4aWFvQHh0dS5lZHUuY24=; Liang Su, c3VsaWFuZ0B4dHUuZWR1LmNu
Disclaimer: All claims expressed in this article are solely those of the authors and do not necessarily represent those of their affiliated organizations, or those of the publisher, the editors and the reviewers. Any product that may be evaluated in this article or claim that may be made by its manufacturer is not guaranteed or endorsed by the publisher.
Research integrity at Frontiers
Learn more about the work of our research integrity team to safeguard the quality of each article we publish.