 Jianxiang Xie
 Yiyi Zhang
 Jiefeng Liu
94% of researchers rate our articles as excellent or good
Learn more about the work of our research integrity team to safeguard the quality of each article we publish.
Find out more
ORIGINAL RESEARCH article
Front. Mater., 12 July 2022
Sec. Polymeric and Composite Materials
Volume 9 - 2022 | https://doi.org/10.3389/fmats.2022.938143
This article is part of the Research TopicFabrication, Characterization, and Deterioration Mechanism of Advanced Polymeric, Ceramic and Metallic Composite Materials in Electrical and Electronic EngineeringView all 7 articles
As the main insulation material of the power electronic transformer (PET), polyimide (PI) is easy to accumulate space charge under the continuous high-frequency pulse voltage, which will threaten the operation of PET and cause electric field distortion. At present, the microscopic mechanism of charge transport under high-frequency voltage is unclear. Numerical simulation is an effective method to explore the transport characteristics of space charge. The simulation of charge transport under DC voltage is mainly based on the bipolar charge transport (BCT) model. However, the charge transport behaviors under high-frequency pulse voltage cannot be simulated by the traditional models accurately. Given this, based on the BCT model, the High-Frequency Voltage Charge Transport (HFCT) model is proposed, considering nonlinear charge mobility of the polymer and the effect of the frequency. Finally, the space charge and electric field distribution under square pulse wave voltages with different rising times are simulated based on the HVCT model, concluding that the reduction of rising time will promote the accumulation of space charge. In view of this, the HVCT model is expected to optimize the insulation design of PET and provide a reference for the dynamic simulation of space charge.
Polyimide (PI) is widely used as the main insulating material for power electronic transformers (PET) (Liu et al., 2019). The service life of PET is determined by the insulating properties of PI. However, the insulation of PET is usually subjected to high-frequency PWM-like voltages, which leads to insulation failure. The accumulation of space charge inside the PI can cause severe electric field distortion and affect the polymer properties of the insulating material (Zhang et al., 2017; Tanaka, 2018a; Tanaka, 2018b). Moreover, under high-frequency voltage, the number of partial discharge of PET is much higher than 50 Hz (Jiang et al., 2021), causing electric field distortion, accelerating the aging of the insulation system, and threatening the operation of PET. Therefore, the space charge characteristics of the PI are important factors in describing the insulating properties of PET.
Some scholars have studied the space charge distribution characteristics under the high-frequency square wave pulse voltage (Wu et al., 2010; Wang et al., 2020). Wu et al. (2010) are focusing on the space charge characteristics of polyimide films under voltages with pulse frequency. It is found that the charge injection increases with the aging rate. Wang et al. (2020) analyze the space charge accumulation of cross-linked polyethylene under unipolar and bipolar square wave voltages. The experimental results indicate that charges accumulate in the dielectric obviously under the unipolar square pulse. However, the effect of rising time on space charge characteristics is rarely considered.
The experiment is an important method to investigate the characteristics of space charge, which can represent the distribution of space charge. Furthermore, numerical simulation can assist the experiment to investigate the transport characteristics of space charge from a microscopic level (Zhang et al., 2022). The bipolar charge transport (BCT) model is widely used in the simulation of the dynamic charge characteristics of the polymer, considering the injection, extraction, recombination, trapping, de-trapping, and transport of space charge (Tian and Hou, 2018; Liu et al., 2020). However, the effect of macroscopic conductivity on microscopic charge transport is not considered in the BCT model. Based on carrier dynamic balance theory, Du et al. propose the carrier dynamic model combined microscopic charge transport with macroscopic conductivity (Liang et al., 2020).
The above studies provide valuable methods for studying space charge characteristics. However, the nonlinear charge mobility and frequency on conductivity are not considered in the BCT model, leading to inaccurate simulation results. In view of this, based on the BCT model, combined with the change of conductivity with frequency and nonlinear charge mobility in the PI, the high-frequency voltage charge transport (HVCT) model is proposed. Firstly, the effect of different waveform parameters (frequency, waveform, duty ratio) on the charge accumulation under the square wave pulse is investigated by using the HVCT model. Then, based on the HVCT model, the space charge and electric field distribution under high-frequency voltages with different rising times are obtained. Combined with the influence of different waveform parameters on space charge accumulation, the HVCT model proposed in this paper aims to analyze the insulation failure mechanism of PET under high frequency voltage from the perspective of space charge, and to optimize the insulation design of PET.
The BCT model assumes that the space charge comes from the injection of the electrode surface.
The injected free charge migrates and diffuses under the action of the external electric field. The space charge transport process is shown in Figure 1. The diffusion coefficient conforms to the Einstein relation:
where Dfe and Dfh are diffusion coefficients of free electrons and free holes. kb is Boltzmann constant. T is absolute temperature, K. e = 1.69 × 10⁻¹⁹C. μe and μh are free-charge mobilities, m2/(Vs).
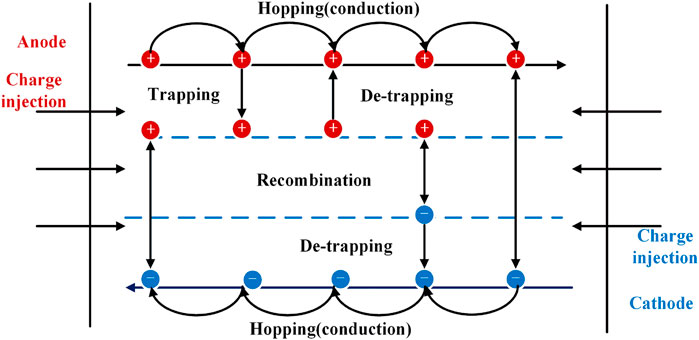
FIGURE 1. Schematic diagram of bipolar charge transport.
The free charges are only injected from the electrode surface. The injection current density follows Schottky’s emission model (Jin et al., 2016), which is shown below:
where Jei and Jhi represent the current density of cathode and anode injection. AR is Richardson’s constant. Ψei and Ψhi represent the electron and hole injection barrier, eV. εr is the relative permittivity of dielectric. ε0 is the vacuum permittivity.
The transport process of carriers in the polymer can be described by three basic equations, namely continuity equation, current transfer equation, and Poisson equation (Min et al., 2013). The continuity equation describes the relationship between the current density J (x, t) and space charge recombination, trapping, and de-trapping. The equation is as follows:
where
where ρ is the space charge density, C/m3, μ represents carrier mobility, m2/(Vs). The electric field distribution is calculated by the Poisson equation, which is shown as follows.
Due to material impurities and the non-linear distribution of net charge, there are traps inside the dielectric. Free charges are trapped by the traps during transportation. When excited by the energy, the trapped charge escapes from the trap. Meanwhile, recombination occurs between free charges and trap charges of different polarities. The source term represents the recombination, trapping, and de-trapping between carriers, as shown below:
where subscript eu, hu, et, ht represent free electron, free hole, trap electron, and trap hole, respectively. The subscript indicates free negative charge, free positive charge, trap negative charge, and trap positive charge. Si represents the recombination coefficient between different charges. Di (i = e, h) is the de-trapping coefficient. Bi (i = e, h) is the trapping coefficient.
When the space charge injected from the electrode migrates to the other end electrode, the barrier effect of the interface will lead to the accumulation of heteropolar charge near the electrode. The equation is shown as follows (Le Roy et al., 2007):
where j is the extraction current density, C is the extraction coefficient of space charge, the value ranges from 0 to 1, indicating from complete blocking to no blocking, ρ is the space charge density, E is the electric field strength.
The high-frequency thermal effect will accelerate the aging of PI with the increase of the frequency of the applied electric field, which increases the conductivity of the polymer (Chisca et al., 2011; Khazaka et al., 2013). The relationship of conductivity with frequency is shown below:
where k is a temperature-dependent parameter; s is the exponent of the power law, in this paper, s = 0.83, k = 8.91 × 10⁻¹⁵. σdc is the conductivity at DC voltage, influenced by the temperature, which is defined as follows (Joergens and Clemens, 2019):
where Ea is the conductivity activation energy; σ0 is a constant related to the properties of the polyimide material. Moreover, mobility and conductivity satisfy the following relationships:
where q is the charge of the carrier. m is the mass of the carrier. Ni is the impurity ion concentration. A and B are the related constants. The relationship between PI conductivity and frequency, temperature, and electric field can be obtained from Eq. 11 and Eq. 12, and the mobility can be approximated as follows:
where Kμ is the mobility coefficient, which is inversely proportional to the impurity ion concentration. According to the distribution of impurity ions in (Ezoe et al., 2001), it is assumed mobility coefficient is as shown in Figure 2.
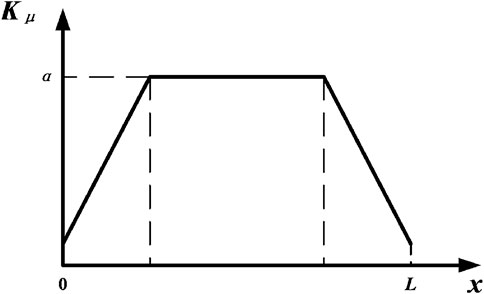
FIGURE 2. Relationship of mobility coefficient with location.
At the same time, according to the relationship between conductivity and frequency in (Chisca et al., 2011), the change of the mobility with frequency is obtained as shown in Figure 3. When the frequency increases from 10 Hz to 104 Hz, the relative dielectric constant of this type of PI decreases from 3.48 to 3.4. In this paper, the frequency of the applied voltage is ranged from 10 to 500 Hz, so the relative dielectric constant εr in this paper is set to a constant of 3.48.
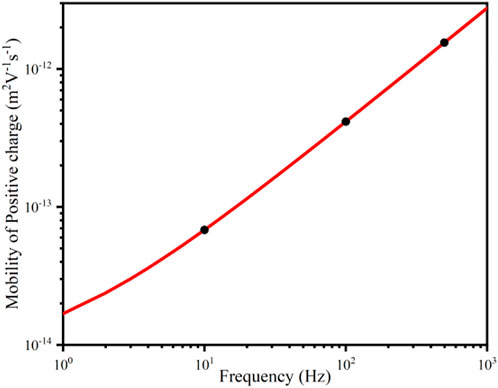
FIGURE 3. Relationship between the maximum mobility and frequency
Combined with Eq. (1), the variation law is similar to the mobility, and the modified diffusion coefficient D*f is as follows:
Combining Eqs. 3, 4, 15, a new coefficient-type partial differential equation can be obtained:
The intrinsic carrier density distribution inside the material is given by the following equation:
In this paper, a one-dimensional plane model is constructed to denote the PI sample in simulation, with a thickness of 125 μm. The simulation model is shown in Figure 4.
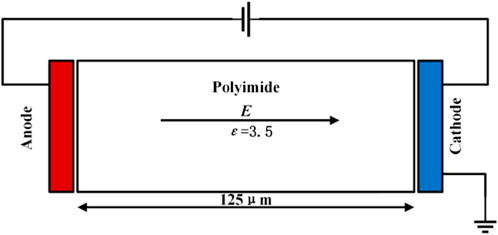
FIGURE 4. Simulation model.
The cathode is grounded and the anode is applied with voltage U0. The simulation parameters related to polyimide are set according to (Ren et al., 2020). The relevant parameters of conductivity as a function of frequency are obtained by fitting the experimental data in (Khazaka et al., 2013). Other simulation parameters are set according to (Liang et al., 2020; Yan et al., 2021). The parameters are shown in Table 1.
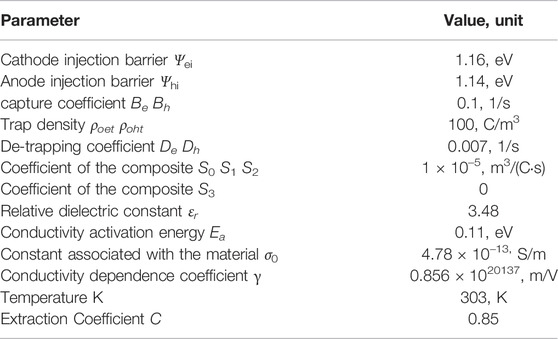
TABLE 1. Parameter setting.
The injection barrier of the anode (SC) electrode is lower than that of the cathode (Al) electrode (Ren et al., 2020). Therefore, the electron injection barrier Ψei in this paper is set smaller than the hole injection barrier Ψhi.
In the numerical simulation of space charge, the carrier mobility is often between 10–12–10−14m2/(Vs). According to Eq. 13, carrier diffusion coefficient is 10–15–10–17 m2s−1. If the diffusion coefficient is set too small, it will lead to the phenomenon of negative concentration in the finite element because of the numerical noise and discontinuity of the finite element method itself. It will eventually lead to the divergence of the model calculation results. For this purpose, the diffusion coefficient is multiplied by the amplification factor β = 107, and the appropriate amplification is 10–11 m2*s−1, which is close to the setting of 10–11 m2*s−1 in (Le Roy et al., 2007).
Assuming that the free carrier concentration is in an equilibrium state at the initial moment, the initial value of the space charge density is set as:
To analyze the space charge characteristics of PI under voltages with different pulse frequencies, the amplitude and duty ratio of the pulse voltage is set to 60 kV/mm and 50%. By setting different pulse frequencies ranging 10–500 Hz, the space charge density and electric field distribution under voltages with different pulse frequencies are obtained. The simulation results of the BCT model are shown in Figures 5A,C. Furtherly, the simulation results of the HVCT model are shown in Figures 5B,C,E,F show the experimental results of space charge and electric field distribution under square wave voltages with different frequencies. Combining Figure 2 and the experimental data in (Ren et al., 2020), the mobility coefficient is set as shown in Table 2.
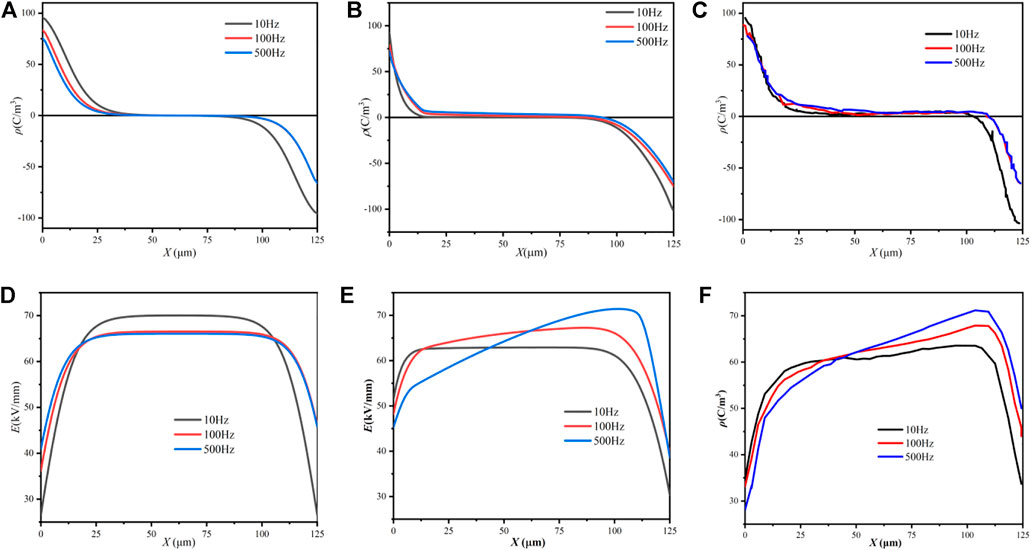
FIGURE 5. Comparison between experimental results and different simulation models with different frequency: (A) space charge distribution of BCT model, (B) space charge distribution of HVCT model, (C) experimental results of space charge distribution in (Ren et al., 2020), (D) electric field of BCT model distribution, (E) electric field distribution of HVII model, (F) experimental results of electric field distribution in (Ren et al., 2020)
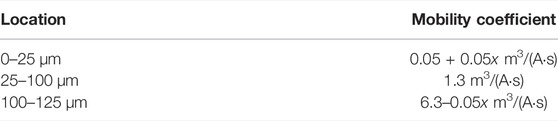
TABLE 2. Mobility coefficient.
It can be seen the BCT model cannot well simulate the phenomenon of charge distribution and electric field distribution of PI in the experiment. Combined with the effect of nonlinear charge mobility, the HVCT model is more consistent with the experimental results, which proves the accuracy and effectiveness of the HVCT model.
The space charge distribution is shown in Figure 5C. When the frequency is set to 10 Hz, the homogeneous charges accumulate near the electrodes, and there is almost no charge accumulated in the PI. It is evident that the charge injection from the electrodes gradually decreases as the frequency increases. On the contrary, the accumulation of charge inside the PI begins to accumulate and keeps increasing with increasing frequency.
Meanwhile, the electric field distribution is shown in Figures 5E,F. When the frequency is 10 Hz, the electric field distribution is relatively uniform, and the maximum field strength is 62 kV/mm. When the frequency becomes 500 Hz, the maximum value of the field strength increases to 72 kV/mm increases.
According to the above simulation results, the effect of frequency on space charge can be analyzed from the following two aspects:
(1) When the frequency of the applied voltage increases, the high-frequency thermal effect accelerates the aging of the PI, which enhances the conductivity of the polymer. According to Eq. 15, when the conductivity increases, mobility is enlarged. Since the extraction coefficient and injection barrier remain unchanged, the accumulation of charge injected and extracted from both ends remains unchanged. The increase in mobility leads to more charges migrating towards the internal PI so that the charge accumulation near the electrodes decreases.
(2) The mobility of holes is greater than that of electrons, causing more holes to move into the PI than electrons and more positive charges accumulated. With the increase of the frequency, the charges continue to accumulate in the PI, and the accumulation of positive charges is greater than that of negative charges. The polarity effect of space charge and electric field distribution is shown in Figure 6. As the frequency increases, the ratio of anode surface charge density to cathode surface charge density is larger, and the ratio of anode surface electric field strength to cathode surface electric field strength is smaller. The increase in frequency strengthens the positive polarity effect of space charge. Therefore, as the frequency increases, the accumulation of positive charge intensifies.
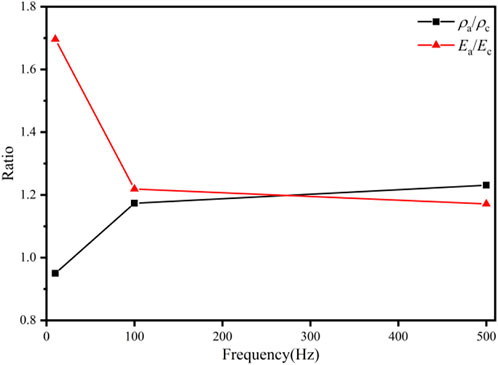
FIGURE 6. Effect of Frequency on polarity effects of space charge and electric field distribution.
The simulation time under DC, square wave and half-sine voltage are set to 30, 60, and 60 min, respectively. The amplitudes are 60 kV/mm, and the frequency and duty ratio of the square wave and half-sine wave are respectively 50 Hz and 50%. The schematic diagrams of various waveforms are shown in Figure 7. The simulation result of space charge and electric field distributions are shown in Figure 8.
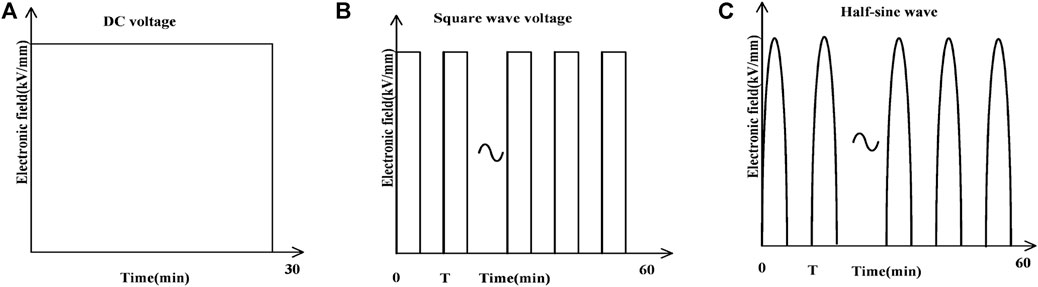
FIGURE 7. Schematic diagram of various waveforms: (A)DC, (B) square wave (C) half-sine wave.
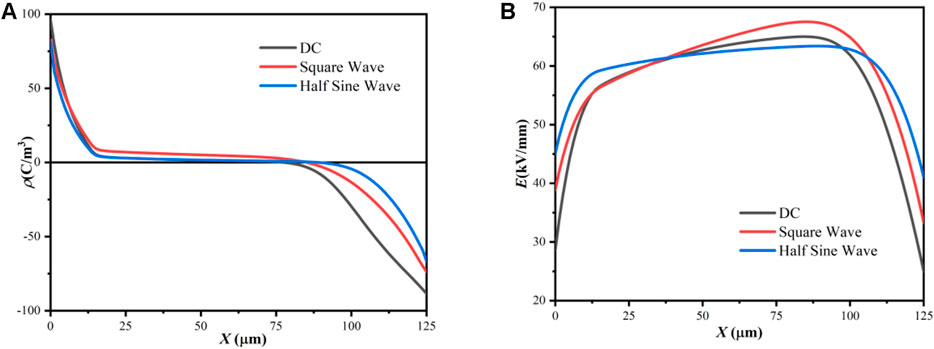
FIGURE 8. Simulation results under voltages with different waveforms: (A) space charge distribution, (B) electric field distribution.
The space charge distribution is shown in Figure 8A. It can be seen that the charge injection and the accumulation of positive charges under the half-sine voltage are less than that under the DC voltage and the square wave voltage. Respectively, the charge injection under the square wave is slightly less than that under the DC voltage but more than that under the half-sine voltage, while the positive charge accumulation is much larger than that under the DC voltage and the half-sine voltage. The electric field distribution is shown in Figure 8B. The electric field distribution under action of the half-sine wave voltages is relatively uniform. The maximum field strength of the PI under the DC voltage is 64 kV/mm. Under the action of square wave pulse voltage, the maximum field strength of the PI is 67 kV/mm, and the electric field distortion is the most severe.
According to the above simulation results, the influence of the duty ratio on the space charge can be analyzed by the following two aspects. Firstly, although PI has the longer duration of the applied electric field under DC voltage than under the square wave voltage, affected by the high-frequency thermal effect, the conductivity under square wave voltage is larger than DC voltage (Chisca et al., 2011; Khazaka et al., 2013). The increase in conductivity leads to an increase in mobility (Wang et al., 2019), causing the larger accumulation of space charge. On the other hand, although the PI is affected by the high-frequency thermal effect under the half-sine wave, with large changes in voltage amplitude, the charge injection is less than the square wave voltage and DC voltage, which leads to a smaller charge accumulation.
To investigate the effect of the duration of applied field on the space charge distribution characteristics of PI, the amplitude and duty frequency of the pulse voltage are set to 60 kV/mm and 50 Hz, and the duty ratio is ranged from 25% to 75%. The simulation results are shown in Figure 9.
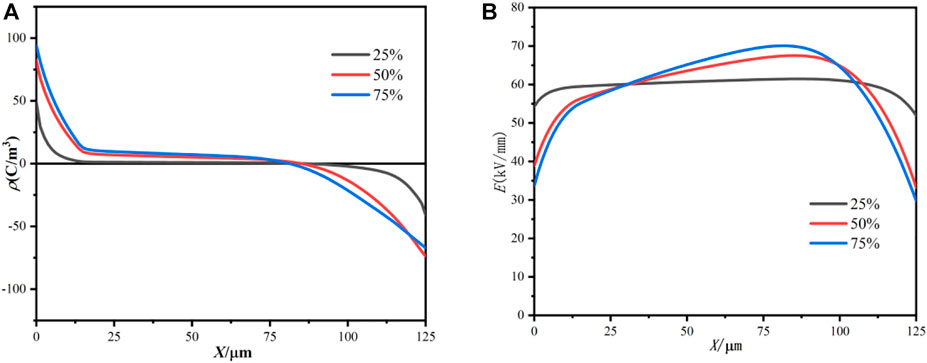
FIGURE 9. Simulation results under voltages with different duty ratios: (A) space charge distribution, (B) electric field distribution.
The space charge distribution is shown in Figure 9A, with the increase of the duty ratio, the accumulation of positive charge inside the PI gradually increases. However, the increment of the space charge accumulation for increasing the duty ratio from 25% to 50% is larger than that for increasing the duty ratio from 50% to 75%. The electric field distribution is shown in Figure 9B. The increase in the duty ratio makes the electric field distortion rate higher, but the growth rate gradually decreases. When the duty ratio is 25%, the maximum value of the electric field is 61 kV/mm. When the duty ratio is increased to 75%, the maximum value of the electric field strength is 69 kV/mm.
According to the above simulation results, the influence of the duty ratio on the space charge can be analyzed by the following two aspects. On the one hand, according to Eq. 2, when the time of applied electric field remains unchanged, the increase of the duty ratio increases the duration of applied field, resulting in an increase in the carrier injection time. Therefore, charge injection enlarges as the duty ratio increases. On the other hand, according to Eq. 4 and Eq. 6, the carrier diffusion time and the trapping time remain unchanged when the simulation time is constant. The increase of the duration of the applied field increases the carrier transit time. Eventually, the charge accumulation inside the PI increases as the duty ratio increases. Meanwhile, when the duty ratio exceeds a certain value, due to the threshold of trap density, the accumulated charge in the PI reaches the maximum value, and charge accumulation tends to be stable.
The pulse edge excites the sudden change of the charge state, which aggravates the destruction of the insulating structure through the action of de-trapping release energy, high-energy electron impact, and Lorentz force (Zengbin et al., 2009). However, due to the limitation of testing technology, the research on the behavior of space charge at the pulse moment is rarely reported. In this paper, the rising time is set to 1 ms, 5 ms, and 9 ms, and the simulation time is 60 min.
The charge distribution is shown in Figure 10A. As the rising time increases, the space charge accumulation of PI gradually decreases. When the rising time is 1 ms, the charge accumulation inside the PI reaches maximum. When the rise time increased to 5 ms, the positive charge accumulation begins to gradually decrease. Finally, when the rising time increases to 9 ms, there is basically no charge accumulated in the PI.
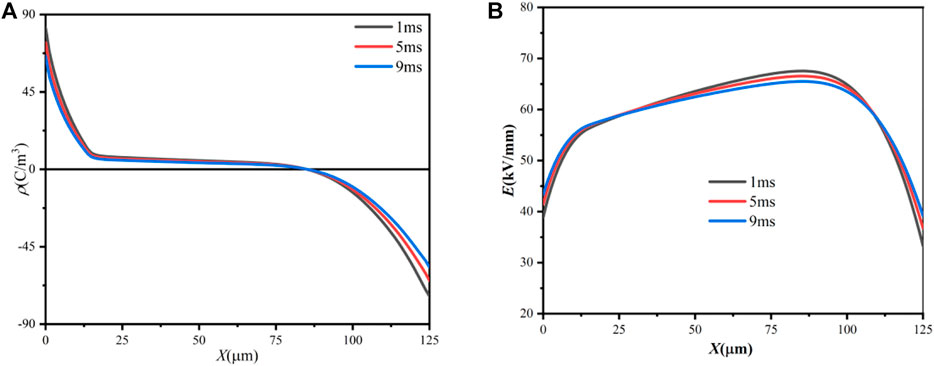
FIGURE 10. Simulation results under voltages with different rising time: (A) space charge distribution, (B) electric field distribution.
When the pulse voltage rises, the sudden change of the electric field causes the sudden change of the electric field force. The other stresses on the charges remain basically unchanged due to inertia. This leads to the breaking of the force balance state of the charges, causing a sharp increase in the resultant external force on the charges (He et al., 2021). The shorter the pulse voltage rising time, the greater the change rate of the electric field force, accelerating the migration of charges inside the electrolyte, and increasing the accumulation of internal charge. Meanwhile, although the increase of the rising time enlarges the charge injection and transit time, it also reduces the duration of the highest voltage. According to Eq. 2 and Eq. 4, charge injection and accumulation in the phases of amplitude change are much lower than the highest voltage period. Therefore, the charge accumulation under the pulse slowly increased voltage is smaller than that under the rapidly increased voltage.
The effects of frequency on conductivity and nonlinear charge mobility on charge transport are ignored in the traditional charge transport models. In this case, a modified model is proposed to simulate the space charge characteristics under unipolar pulse voltages. The analysis and contributions of this paper lead to the following conclusions:
(1) The HVCT model can be applied to the simulation of charge transport properties under voltages with pulse frequencies, waveforms and duty ratios. The results obtained by the HVCT model are more consistent with the experimental results than those obtained by the traditional BCT model, proving the accuracy of the HVCT model.
(2) Based on the HVCT model, the space charge distribution and electric field distribution under voltage with different rising times are simulated. The results show that the decrease of rising time enlarges the accumulation of space charge inside the PI, resulting in severe electric field distortion.
(3) This model can be used to calculate space charge and electric field distributions in PET. Meanwhile, the HVCT model can better reproduce the experimental phenomenon of space charge of PI under square wave pulse voltage, which assists in understanding the transport characteristics of space charge of PI.
The original contributions presented in the study are included in the article/Supplementary Material, further inquiries can be directed to the corresponding author.
JX and JL: Writing-original draft preparation, software, writing-review and editing. SY: Software, writing-review and editing. MS and YZ: Writing-review and editing, supervision.
The authors declare that the research was conducted in the absence of any commercial or financial relationships that could be construed as a potential conflict of interest.
All claims expressed in this article are solely those of the authors and do not necessarily represent those of their affiliated organizations, or those of the publisher, the editors and the reviewers. Any product that may be evaluated in this article, or claim that may be made by its manufacturer, is not guaranteed or endorsed by the publisher.
Chisca, S., Sava, I., Musteata, V.-E., Bruma, M., and Society, I. E. D. (2011). “Dielectric and Conduction Properties of Polyimide Films,” in CAS 2011 Proceedings (2011 International Semiconductor Conference), Sinaia, Romania, 17-19 October 2011, 253–256.
Ezoe, M., Kuwada, K., Kawashima, T., and Ieee, I. (2001). “Effects of Ionic Impurity on Space Charge Distribution in Solid Dielectrics,” in ICSD'01. Proceedings of the 2001 IEEE 7th International Conference on Solid Dielectrics (Cat. No.01CH37117), Eindhoven, Netherlands, 25-29 June 2001, 85–88.
He, D., Zhang, T., Chen, X., Gong, W., and Li, Q. (2021). Research Overview on Charge Characteristics of Power Electronic Equipment Insulation under the Pulse Voltage. Trans. China Electrotech. Soc. 36, 4795–4808. doi:10.19595/j.cnki.1000-6753.tces.210266
Jiang, J., Zhang, B., Li, Z., Ranjan, P., Chen, J., and Zhang, C. (2021). Partial Discharge Features for Power Electronic Transformers under High-Frequency Pulse Voltage. IEEE Trans. Plasma Sci. 49, 845–853. doi:10.1109/tps.2021.3053960
Jin, S., Ruan, J., Du, Z., Huang, G., Zhu, L., Guan, W., et al. (2016). Charge Transport Simulation in Single-Layer Oil-Paper Insulation. IEEE Trans. Magnetics 52, 1. doi:10.1109/TMAG.2015.2469755
Joergens, C., and Clemens, M. (2019). Conductivity-based Model for the Simulation of Homocharges and Heterocharges in XLPE High-Voltage Direct Current Cable Insulation. Iet Sci. Meas. Technol. 13, 975–983. doi:10.1049/iet-smt.2018.5452
Khazaka, R., Locatelli, M. L., Diaham, S., Bidan, P., Dupuy, L., and Grosset, G. (2013). Broadband Dielectric Spectroscopy of BPDA/ODA Polyimide Films. J. Phys. D-Applied Phys. 46, 065501. doi:10.1088/0022-3727/46/6/065501
Le Roy, S., Teyssedre, G., Laurent, C., Dissado, L. A., and Montanari, G. C. (2007). “Relative Importance of Trapping and Extraction in the Simulation of Space Charge Distribution in Polymeric Insulators under DC Potentials,” in 2007 IEEE International Conference on Solid Dielectrics, Winchester, UK, 08-13 July 2007, 494.
Liang, H., Du, B., Li, J., Yao, H., and Wang, Z. (2020). Improved Space Charge Transport Model in Bi‐layer Dielectrics-Considering Carrier Dynamic Equilibrium. High. Volt. 5, 176–183. doi:10.1049/hve.2019.0193
Liu, H., Xu, X., Liu, Y.-P., Meng, S., Guo, Z., and Zhang, M. (2020). Simulation of Influence of DC Pre-stress on Space-Charge Characteristics of Cross-Linked Polyethylene in Inhomogeneous Field. Ieee Access 8, 121119–121126. doi:10.1109/access.2020.3006916
Liu, T., Dong, G., Li, Q., Ren, H., Wang, J., and Wang, Z. (2019). Coupling Effect of Electrical and Thermal Stresses on Insulation Life of Polyimide under High Frequency Impulses. High. Volt. Eng. 46, 2504–2510.
Min, D., Shengtao Li, S., Mengu Cho, M., and Khan, A. R. (2013). Investigation into Surface Potential Decay of Polyimide by Unipolar Charge Transport Model. IEEE Trans. Plasma Sci. 41, 3349–3358. doi:10.1109/tps.2013.2270377
Ren, H., Tanaka, Y., Gao, H., Li, C., and Li, Q. (2020). “Special Behaviors of Space Charge inside Insulating Materials under Different Polarization Conditions,” in 2020 International Symposium on Electrical Insulating Materials (ISEIM), Tokyo, Japan, 13-17 September 2020, 339–342.
Tanaka, Y. (2018a). “Advanced Application of Space Charge Measurement Using PEA Method for Evaluation of Insulating Materials,” in 2018 IEEE International Conference on High Voltage Engineering and Application (ICHVE), Athens, Greece, 10-13 September 2018.
Tanaka, Y. (2018b). “Space Charge Distribution Measurement Using PEA Method -Encounter with Unexpected Behavior,” in 12th International Conference on the Properties and Applications of Dielectric Materials (ICPADM), Xi'an, China, May 20th - 24th, 2018, 1–10.
Tian, F., and Hou, C. (2018). A Trap Regulated Space Charge Suppression Model for LDPE Based Nanocomposites by Simulation and Experiment. IEEE Trans. Dielect. Electr. Insul. 25, 2169–2177. doi:10.1109/tdei.2018.007282
Wang, X., Shu, Z.-H., Duan, S.-J., Wang, H.-N., and Liu, S. (2019). “Study of Space Charge Accumulation Property in Polyethylene under Applied Voltage of Square Wave,” in 2019 2nd International Conference on Electrical Materials and Power Equipment (ICEMPE), Guangzhou, China, 07-10 April 2019, 178–181.
Wang, X., Shu, Z., Duan, S., Wang, H., and Wu, K. (2020). Space Charge Accumulation Property in XLPE under Applied Voltage of Square Wave. High. Volt. Eng. 46, 634–639. doi:10.13336/j.1003-6520.hve.20200131030
Wu, G., Wu, J., Zhou, L., Gao, B., Zhou, K., Guo, X., et al. (2010). Microscopic View of Aging Mechanism of Polyimide Film under Pulse Voltage in Presence of Partial Discharge. IEEE Trans. Dielect. Electr. Insul. 17, 125–132. doi:10.1109/tdei.2010.5412010
Yan, S., Liu, J., Fan, X., Zhang, Y., Shi, M., and Zhang, H. (2021). Effect of Multi‐factors on Heterocharges for Oil‐impregnated Paper in Converter Transformer Using Modified Charge Transport Model. IET Generation Trans Dist 15, 3048–3057. doi:10.1049/gtd2.12240
Zengbin, W., Yonghong, C., Yu, C., Man, D., Jiabin, Z., Guodong, M., et al. (2009). Influence of Pulse Steepness on Vacuum Surface Flashover Characteristic under Steep Pulse. High. Volt. Eng. 35, 151–156. doi:10.13336/j.1003-6520.hve.2009.01.020
Zhang, Y., Liu, D., Wu, J., and Yin, Y. (2017). “Investigation on Space Charge Behavior in Water Tree Aged Crosslinked Polyethylene (XLPE) Cable by Experiment and Simulation,” in 2017 International Symposium on Electrical Insulating Materials (ISEIM), Toyohashi, Japan, 11-15 September 2017, 613–616.
Keywords: power electronic transformer, polyimide, square wave pulse, space charge, electric field distortion
Citation: Xie J, Yan S, Shi M, Zhang Y and Liu J (2022) Modified Charge Transport Model Under High-Frequency Unipolar Square Wave Voltage. Front. Mater. 9:938143. doi: 10.3389/fmats.2022.938143
Received: 07 May 2022; Accepted: 21 June 2022;
Published: 12 July 2022.
Edited by:
Mazeyar Parvinzadeh Gashti, PRE Labs Inc., Kelowna, CanadaReviewed by:
Mitsumasa Iwamoto, School of Engineering, Tokyo Institute of Technology, JapanCopyright © 2022 Xie, Yan, Shi, Zhang and Liu. This is an open-access article distributed under the terms of the Creative Commons Attribution License (CC BY). The use, distribution or reproduction in other forums is permitted, provided the original author(s) and the copyright owner(s) are credited and that the original publication in this journal is cited, in accordance with accepted academic practice. No use, distribution or reproduction is permitted which does not comply with these terms.
*Correspondence: Jiefeng Liu, amllZmVuZ2xpdTIwMThAZ3h1LmVkdS5jbg==
Disclaimer: All claims expressed in this article are solely those of the authors and do not necessarily represent those of their affiliated organizations, or those of the publisher, the editors and the reviewers. Any product that may be evaluated in this article or claim that may be made by its manufacturer is not guaranteed or endorsed by the publisher.
Research integrity at Frontiers
Learn more about the work of our research integrity team to safeguard the quality of each article we publish.