 Rao Dai
 Shenglan Yang1
 Lijun Zhang
- 1State Key Laboratory of Powder Metallurgy, Powder Metallurgy Research Institute, Central South University, Changsha, China
- 2National Engineering Laboratory for Modern Materials Surface Engineering Technology, The Key Lab of Guangdong for Modern Surface Engineering Technology, Institute of New Materials, Guangdong Academy of Sciences, Guangzhou, China
Physical vapor deposition (PVD) is one of the most important techniques for coating fabrication. With the traditional trial-and-error approach, it is labor-intensive and challenging to determine the optimal process parameters for PVD coatings with best properties. A combination of three-dimensional (3-D) quantitative phase–field simulation and a hierarchical multi-objective optimization strategy was, therefore, developed to perform high-throughput screening of the optimal process parameters for PVD coatings and successfully applied to technically important TiN coatings. Large amounts of 3-D phase-field simulations of TiN coating growth during the PVD process were first carried out to acquire the parametric relation among the model parameters, microstructures, and various coating properties. Experimental data were then used to validate the numerical simulation results and reveal the correlation between model parameters and process parameters. After that, a hierarchical multi-objective method was proposed for the design of multiple coating properties based on the quantitative phase–field simulations and key experimental data. Marginal utility was subsequently examined based on the identification of the Pareto fronts in terms of various combinations of objectives. The windows for the best TiN coating properties were, therefore, filtered with respect to the model/process parameters in a hierarchical manner. Finally, the consistent optimal design result was found against the experimental results.
1 Introduction
Due to its low process temperature and environmental friendliness, the physical vapor deposition (PVD) technique has been widely used to fabricate various industrial coatings in terms of controllable composition and structure, promising compressive strength, and desired surface performance (Deng et al., 2020). For the past decades, different PVD techniques have been developed, such as the cathodic arc evaporation (CAE) (Zhou et al., 2019) or arc ion plating (AIP) (Zhang et al., 2018), direct current magnetron sputtering (DCMS) (Barshilia et al., 2004), and high-power impulse magnetron sputtering (HiPIMS) (Alami et al., 2014; Kuo et al., 2019) and even their hybrid techniques (Bobzin et al., 2019). For the PVD coatings, the concerned properties in the industry include hardness, corrosion resistance, wear resistance, and adhesion strength. Until now, substantial experimental investigations have been conducted to improve the PVD coating properties, majorly focusing on the modification of process parameters, that is, target power (Tai et al., 1990; Bhaduri et al., 2010), N2 partial pressure (Lousa et al., 2007; Mayrhofer et al., 2009), bias voltage (Hernández et al., 2011; Ma et al., 2017), magnetic field strength (Mayrhofer et al., 2002; Wu et al., 2017), substrate temperature (Mayrhofer et al., 2009), etc. However, the process parameters are not directly related to the properties of PVD coatings, and it is, thus, very challenging to determine the optimal process parameters for PVD coatings with best properties through the traditional time-/labor-consuming trial-and-error approach.
In fact, the microstructure forming during the preparation process directly determines the properties of PVD coatings. Hence, the quantitative description of the microstructure evolution during preparation can help establish the quantitative relation “process-microstructure” of PVD coatings. Nowadays, the phase-field method has become a powerful approach for quantitative simulation of microstructure evolution in PVD coatings. Starting from the continuum model by Lichter and Chen (Lichter and Chen 1986), Keblinski et al. (Keblinski et al., 1996) developed a phase–field model for the growth of interfaces and applied the model to simulate solid-film growth during PVD with different incident vapor fluxes. Coupling the interface growth phase–field model by Keblinski et al. (Keblinski et al., 1996) with the phase–field model for solidification of polycrystalline materials by Warren et al. (Warren et al., 2003), Stewart and Spearot (Stewart and Spearot 2016; Stewart and Spearot 2017) further developed a phase–field model for the evolution of single-phase polycrystalline thin films and utilized the model to investigate the influence of model parameters on grain size and porosity and grain orientation. Very recently, Yang et al. (Yang et al., 2019) conducted a parametric study on the PVD process of metal thin films based on the phase–field model by Keblinski et al. (Keblinski et al., 1996). Based on more than 200 three-dimensional (3-D) phase–field simulations, the quantitative relation between the deposition rate and model parameters was established, and the effect of the deposition rate on the surface roughness and microstructure of the PVD metal thin film was investigated. However, the correlation between processing parameters and model parameters and deposition rate, which was essential for establishing a quantitative relation “process-microstructure” of PVD coatings, was not completely examined by Yang et al. (Yang et al., 2019).
In addition to the quantitative relation “process-microstructure” from the quantitative phase–field simulations, the qualitative or quantitative relation “microstructure-properties” is also needed to determine the optimal process parameters for PVD coatings with best properties. That is, the properties of PVD coatings are dominantly determined by the microstructures, for example, porosity, surface roughness, and average grain size. For many industrial applications, the coatings, that are nonporous and with finer grain and smoother surface, are usually desirable. Despite the properties, the coating production efficiency is yet another major concern. A higher deposition rate may generally increase the production efficiency but probably result in porosity and a surface of severe roughness. Consequently, decision-making toward the design of processing parameters and coating properties is a complex multi-objective optimization problem, and a hierarchical multi-objective decision-making strategy is, thus, on demand.
Consequently, the major objectives of the present work are as follows: 1) to pave the way for a parametric relation between the process parameters and coating properties by utilizing a large number of phase–field simulations of PVD coatings together with limited experimental results available in the literature; 2) to develop a multi-objective decision-making strategy suitable for PVD coatings, considering metrics including both the deposition rate for production efficiency and essential microstructure properties (i.e., grain size, porosity, and surface roughness) for coating properties/performance; 3) to design the optimal process parameters for PVD coatings with best comprehensive properties by combining the 3D quantitative phase–field simulations and a hierarchical multi-objective optimization approach and compare with the experimental results. Here, the PVD TiN coatings of technical importance were chosen as the target of the present work because Wang et al. (Wang et al., 2015) performed an intensive experimental investigation on the effect of bias voltage on the microstructures and properties of PVD TiN coatings, which can serve as the experimental validation of the present phase–field simulation and coating design strategy.
2 Methodology
2.1 Phase-Field Model for the Physical Vapor Deposition Process
The phase–field model for the growth of interfaces proposed by Keblinski et al. (Keblinski et al., 1996) allows for a description of the dynamics of depositing vapor and nonlinear morphology of a growing solid film during PVD. This model can capture crucial physical processes during PVD such as 1) arbitrary surface morphology formation, 2) surface tension and vapor diffusion, and 3) non-local shadowing effects. To model PVD processing within the phase-field framework, two field variables are introduced: ϕ(r, t) and g (r, t). The field variable ϕ(r, t) describes the evolution of a growing thin film solid, where ϕ(r, t) ≈ 1 defines a solid region, ϕ(r, t) ≈ −1 defines a vacuum region, and ϕ(r, t) ≈ 0 defines the solid–vapor interface. The field variable g (r, t) describes the local density of the incident vapor; therefore, g (r, t) is always larger than or equal to 0 (i.e., g (r, t) ≥ 0), where g (r, t) ≈ 0 describes a region of no vapor. Considering that the field variable g (r, t) does not contribute to the free energy of the system, the free energy functional is constructed based on the field variable ϕ(r, t) and its gradient,
The first two terms in Eq. 1 provide a double-well energy barrier between the bulk solid and vapor phases. The third term accounts for energy contribution according to the presence of the solid–vapor interface, where α is the interfacial gradient coefficient.
Given the vapor dynamics and shadowing effects, the evolution equations of the solid phase field, that is, ϕ(r, t), and vapor phase field, that is, g (r, t), can be determined to incorporate the underlying physics of PVD. The interface growth mechanism for PVD processing is based on the assumption that the growth of the solid phase, that is, ϕ(r, t) occurs at the expense of the incoming vapor phase, that is, g (r, t), as mathematically expressed in the following equations,
Eq. 2 describes the evolution of the growing thin film solid. In Eq. 2, the first term is the Cahn–Hilliard dynamics expression, which allows for arbitrary surface formation and surface diffusion effects. The second term serves as a source term that couples Eq. 2 with Eq. 3 and captures aspects relevant to the growth of the solid phase at the expense of the incident vapor phase. The last term provides surface fluctuations through a Gaussian noise distribution, η(r, t). Eq. 3 describes the transport of the incident vapor. In Eq. 3, the first term is the diffusion equation modified by the presence of an external force, A. The second term is the coupling term that is the negative of the second term in Eq. 2 and acts as a sink for the diffusive vapor phase due to its transition into a solid phase. The parameter B controls the rate of conversion from the vapor phase to solid phase, C controls the overall noise strength, D is the diffusion coefficient, and A provides the strength and direction to the incoming vapor flux.
2.2 Material and Numerical Parameters for Phase-Field Simulation
The parametric study was conducted to overcome the drawbacks of using nondimensional parameters in our previous work (Yang et al., 2019). The interfacial gradient coefficient, α (J m−1), allows for the contribution of surface energy from the solid–vapor interface. The parameter B (m2 s−1) controls the conversion of the g field into the ϕ field in the interfacial region and thus can be quantified as the generated interface area per unit time, named the vapor–solid transition velocity. The noise amplitude coefficient, C (J m−1), provides sufficient noise at the thin film surface to allow the formation of surface variations and features. The parameter D (m2 s−1) is the diffusion coefficient controlling vapor diffusion in the near-surface region. The parameter A is the incident vapor vector including the incident vapor rate A (m s−1) and angle (i.e., A = Ar). The direction of the incident vapor in the present simulation is perpendicular to the substrate (i.e., A = A
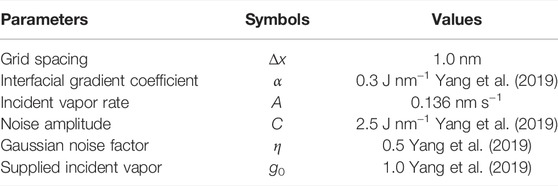
TABLE 1. List of numerical/material parameters used in the present phase-field simulations.
In order to perform the 3D phase-field simulation of the PVD process, an initially flat substrate is constructed in the present work along the entire x-y plane in the z direction, with a thickness less than 1/10 of the grid points of the z axis, where ϕ(r, 0) = 1 and g (r, 0) = 0. The region above the substrate is placed in vacuum, where ϕ (r, 0) = -1 and g (r, 0) = g0. The equations of motion described in Eqs (2), (3) are discretized and solved on a uniform three-dimensional mesh. For these equations, the periodic condition is applied in the direction parallel to the substrate (i.e., x and y axes), while the no-flux and fixed conditions are applied at the lower and upper boundaries of the direction perpendicular to the substrate, respectively (i.e., z axis). During the simulation, the g = g0 condition is maintained at the upper boundary of the z direction providing a constant downward flux Ag during PVD.
3 Results and Discussions
3.1 Parametric Relation Between Model Parameters and Processing Parameters
A series of phase-field simulations are performed to reproduce the growth of TiN coatings during the PVD process and investigate the effect of deposition time and rate on the resulting microstructure. The microstructure evolution of TiN coatings deposited with different deposition rates corresponding to different vapor–solid transition velocities and diffusion coefficients due to 3-D phase-field simulations is shown in Figure 1. In the early growth stage, the coatings exhibit featureless topography, which is mainly formed by small islands tending to display a denser structure with a smoother surface. As the deposition time increases, the columnar structure starts to form, and the pores are induced in the growing coatings. The observed growth mechanism of thin films prepared by the PVD method coincides with the reported phenomena in the literature (Fu and Shen 2008; Rosa et al., 2012; Aqil et al., 2017). Typical temporal surface morphologies of the corresponding simulated results are also examined as illustrated in Figure 2 by means of heat maps of the surface height, which are comparable to the atomic force microscopy (AFM) images.
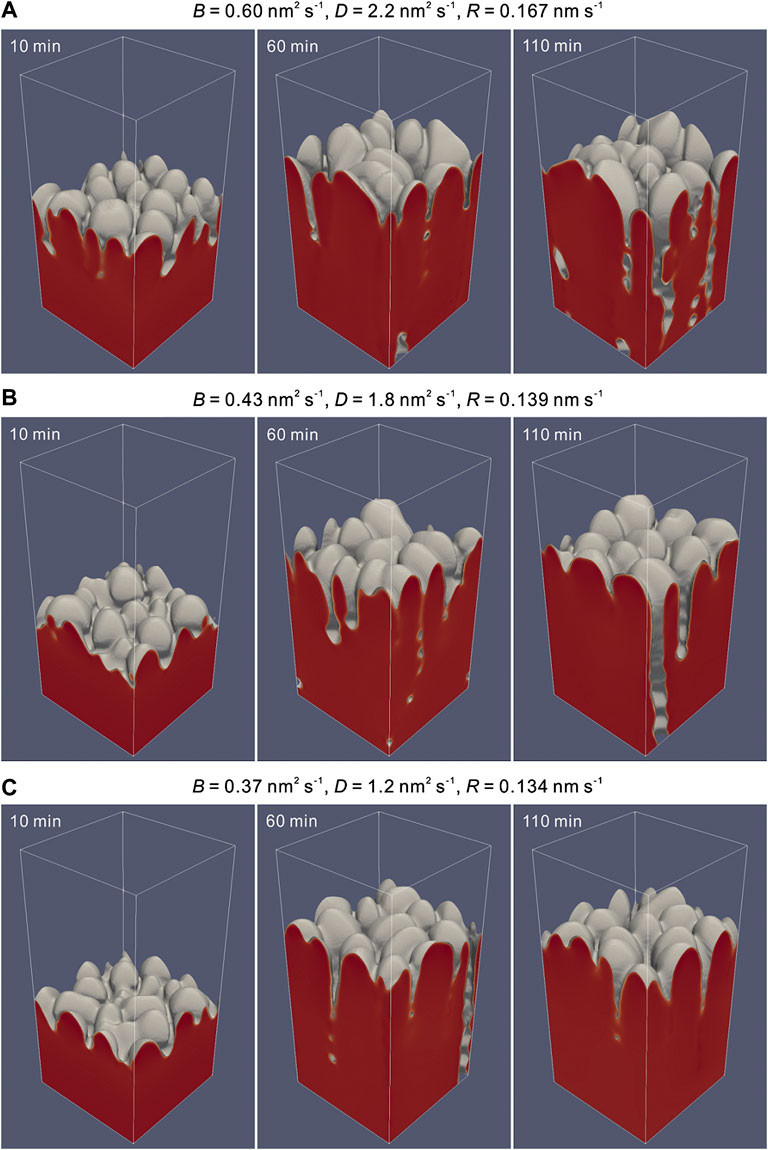
FIGURE 1. Microstructure evolution of PVD TiN coatings due to 3D phase-field simulations with different deposition rates (i.e., R) corresponding to various sets of the vapor–solid transition velocity (i.e., B) and diffusion coefficient (i.e., D): (A) B = 0.60 nm2 s−1, D = 2.2 nm2 s−1, R = 0.167 nm s−1. (B) B = 0.43 nm2 s−1, D = 1.8 nm2 s−1, R = 0.139 nm s−1. (C) B = 0.37 nm2 s−1, D = 1.2 nm2 s−1, R = 0.134 nm s−1. Simulation domain: 100 × 100 × 200 nm3.
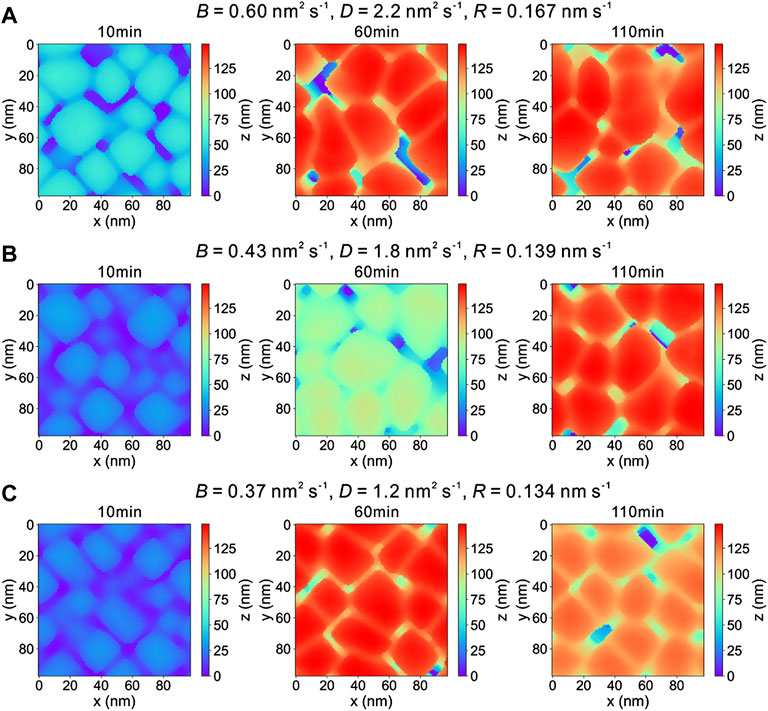
FIGURE 2. Temporal surface morphologies of TiN coatings with various deposition rates (i.e., R) corresponding to different vapor–solid transition velocities (i.e., B) and diffusion coefficient (i.e., D) during the 3D phase-field simulation for PVD: (A) B = 0.60 nm2 s−1, D = 2.2 nm2 s−1, R = 0.167 nm s−1. (B) B = 0.43 nm2 s−1, D = 1.8 nm2 s−1, R = 0.139 nm s−1. (C) B = 0.37 nm2 s−1, D = 1.2 nm2 s−1, R = 0.134 nm s−1.
Beyond the microstructure simulation results, related coating properties can also be extracted in Figure 3 and Supplementary Figures S1–S3. Currently, coating properties related to the coating performance and production efficiency are concerned. Here, the deposition rate which directly determines the production efficiency is presented in Figure 3, while the porosity, surface roughness, and average grain size that are related to coating performance are shown in Supplementary Figures S1–S3. As shown in Figure 3B, a quantitative relation between model parameters and deposition rate can be established, that is, by means of regression or fitting, based on the large amount of phase-field simulation results. Such relations between model parameters and coating properties can also be attained as shown in Supplementary Figures S1–S3 of Supplementary Materials, therefore, serve as the supporting information for decision-making problems about PVD coatings, in case that the parametric relation between the process parameters and model parameters is established.
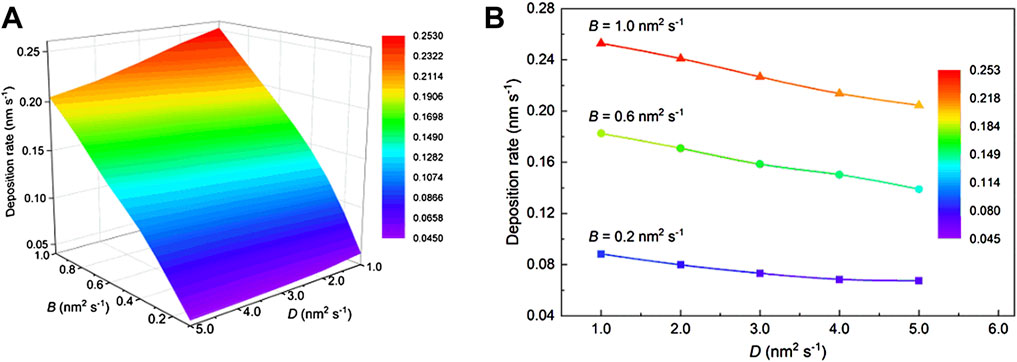
FIGURE 3. Calculated deposition rate of TiN coatings according to the phase-field simulation results as a function of the vapor–solid transition velocity (i.e., B) and diffusion coefficient (i.e., D): (A) 3D surface graph and (B) section profiles at the vapor–solid transition velocity (i.e., B) of 0.2, 0.6, and 1.0 nm2 s−1 from the subgraph A.
To achieve the correspondence between the model parameters and process parameters, the experimental observations by Wang et al. (Wang et al., 2015) are carefully correlated with the simulated results considering the physical essence of model parameters according to the practical process parameters of the PVD process, that is, HiPIMS. On the basis of relating the deposition rate of simulation and experiment, together with the comprehensive consideration that other coating properties (i.e., porosity, surface roughness, and average grain size) should be consistent with the trends or data reported by Wang et al. (Wang et al., 2015), the unique relation between the model parameters and process parameters can be established, as shown in Figure 4.
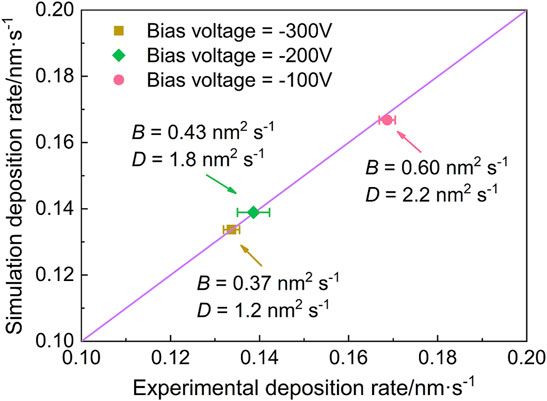
FIGURE 4. Comparison of the deposition rate of TiN coatings between the phase-field simulation results during PVD growth applying different vapor–solid transition velocities (i.e., B) and diffusion coefficients (i.e., D) and the experimental data with various bias voltage (Wang et al., 2015).
Comparison of the deposition rate of TiN coatings between the phase-field simulation results and experimental data is shown in Figure 4. The simulated deposition rate is dominated by the vapor–solid transition velocity and diffusion coefficient, while the experimental deposition rate varies with the substrate bias voltage (Wang et al., 2015). When the vapor–solid transition velocity and diffusion coefficient increase, the simulated deposition rate of TiN coatings increases from 0.134 nm s−1 to 0.167 nm s−1, in quantitative agreement with the experimental deposition rate, which increases as the substrate bias voltage decreases. Due to the high sputtering ionization ratio in HiPIMS, the bias voltage plays an important role in energetic ion bombardment behavior, leading to a significant influence on the vapor–solid transition velocity and diffusion coefficient. With an increase in the substrate bias voltage, the incident ion energy increases and consequently, the deposited material can be re-sputtered by heavy ion bombardment. The vapor–solid transition velocity is supposed to decrease with increasing bias voltage because of the re-sputtering effect. The diffusion coefficient (i.e., D) in this case indicates the ion diffusion in plasma, and is given as (Yiğit 2017).
where k is the Boltzmann constant; T is the plasma temperature; m is the ion mass; and ν is the ion-particle collision frequency. It is observed that the diffusion coefficient for incident ions is governed by the collision frequency of the ion to particle in the plasma atmosphere. Since the energetic ions at a higher bias voltage favor heavy collision with other particles in the plasma, the diffusion coefficient is reduced. When the vapor–solid transition velocity increases, the deposition rate increases as a larger number of incident ions are captured to form a solid coating per unit time. However, the increase of the diffusion coefficient prefers tangential growth to normal growth for coatings during deposition, leading to the decrease of the deposition rate measured by the growth rate in a normal direction. Generally, the deposition rate change with different bias voltages can be explained by the fact that the deposition rate is finally determined by the combined effects of the vapor–solid transition velocity and diffusion coefficient, which are directly affected by the bias voltage. Moreover, the good agreement of the deposition rate between the simulation and experiment first provides a bridge for quantified study.
Figure 5 shows the temporal porosity of PVD TiN coatings deposited with different deposition rates according to the phase-field simulations by applying different vapor–solid transition velocities and diffusion coefficients. There are no specific experimental data on the porosity of TiN coatings prepared by HiPIMS available in the literature, but the cross-sectional scanning electron microscopy (SEM) images of TiN coatings from the study by Wang et al., (2015) enable a qualitative analysis of porosity or density as a function of the bias voltage. It is observed in Figure 5 that the simulated porosity of TiN coatings sharply increases within about 20 min and then slightly increases as the deposition continues. Pores appear earlier and tend to increase faster with a higher deposition rate due to a larger vapor–solid transition velocity and diffusion coefficient. At the same deposition time as that of the experiment, the simulated porosity decreases from 8.02 to 1.05%, with the decrease of the deposition rate intrinsically attributed to the decrease of the vapor–solid transition velocity and diffusion coefficient. Experimentally, the TiN coatings exhibit a trend of densification as the bias voltage increases, that is, as the deposition rate decreases. Even if there are no quantitative experimental data for comparison, a consistent evolution of porosity along the deposition rate between the phase-field simulations and the experimental data can be observed. Based on the relationship between bias voltage and the vapor–solid transition velocity and diffusion coefficient mentioned previously, the increase of bias voltage leads to the decrease of the vapor–solid transition velocity and diffusion coefficient. It is understood that a lower vapor–solid transition velocity contributes to the decrease of coating porosity, but a lower diffusion coefficient results in the increase of porosity fraction. Therefore, the coating porosity variation with different bias voltage is intrinsically determined by a combination product of the vapor–solid transition velocity and diffusion coefficient. Furthermore, a consistent evolution of porosity along the deposition rate between the phase-field simulations and the experimental data proves the quantitative phase-field simulation in the present work.
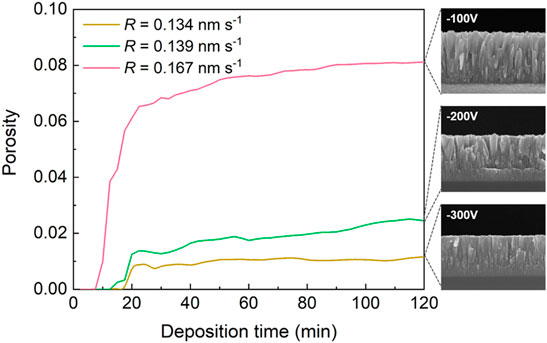
FIGURE 5. Comparison between the temporal porosity of TiN coatings deposited with different deposition rates (i.e., R) according to the phase-field simulation for PVD applying different vapor–solid transition velocities (i.e., B) and diffusion coefficient (i.e., D) and the experimental cross-section images of TiN coatings for qualitative porosity analysis with various bias voltages (Wang et al., 2015). (The images of experimental results are reproduced and presented with premission from Elsevier).
Figure 6 displays the temporal surface roughness of PVD TiN coatings deposited with different deposition rates according to the phase-field simulations, compared with the experimental data, which was evaluated using a scanning probe microscope (SPM) by Wang et al. (Wang et al., 2015). It can be seen in the figure that the simulated surface roughness of TiN coatings increases rapidly at the early deposition stage and then reaches a state where the surface roughness fluctuates within a certain range as the deposition continues. As the deposition rate increases, the surface roughness increases faster at the early deposition stage, and the fluctuation range increases. The simulated surface roughness decreases from 19.41 to 10.98 nm with a decrease in the deposition rate from 0.167 nm s−1 to 0.134 nm s−1. With the deposition rate serving as an intermediary, the simulated roughness based on different vapor–solid transition velocities and diffusion coefficients is comparable with the experimental roughness as a function of bias voltage, and a good agreement between the simulation results and experimental data can be found. Based on the analysis mentioned previously, the evolution of surface roughness with bias voltage is related to the variation of the vapor–solid transition velocity and diffusion coefficient. The increase of bias voltage results in the decrease of the vapor–solid transition velocity and diffusion coefficient. However, there is an opposite effect of the simultaneous decrease of the vapor–solid transition velocity and diffusion coefficient on the surface roughness. In detail, the decrease of the vapor–solid transition velocity leads to the elimination of the shadowing effect and reduction of surface roughness, while the decrease of the diffusion coefficient leads to the increase of surface roughness. The surface roughness is finally attributed to the combined effect of the vapor–solid transition velocity and diffusion coefficient. Again, the good agreement between the simulated surface roughness and the experimental data also substantiates the present quantitative phase-field simulation. Moreover, the surface roughness is evaluated in an area with 3 μm × 3 μm for experimental results, while the simulated surface roughness is calculated within 100 nm × 100 nm due to the limitation of computing power, which might lead to some discrepancies in simulation and experimental results.
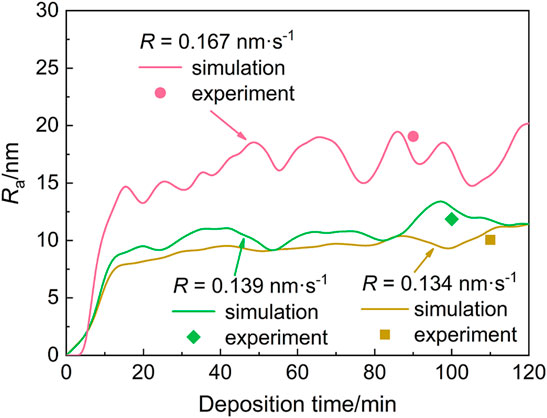
FIGURE 6. Comparison between the temporal roughness (i.e., Ra) according to the phase-field simulation for PVD and the experimental data of Ra (Wang et al., 2015) for TiN coatings deposited with different deposition rates (i.e., R).
In Figure 7, a comparison between the phase-field-simulated grain size of PVD TiN coatings and the experimental data (Wang et al., 2015) is given. The statistical grain size is acquired according to the phase-field simulations at different vapor–solid transition velocities and diffusion coefficients. As the strategy of the moving frame is adopted in the simulation process, the mean size of the columnar structure is considered by averaging the radius of the columnar structure at different thicknesses according to the historical simulation snapshots. As for the experimental grain size, it is affected by the bias voltage and is estimated from X-ray diffraction (XRD) analysis (Wang et al., 2015). When the vapor–solid transition velocity and diffusion coefficient increase from 0.37 nm2 s−1 to 1.2 nm2 s−1 to 0.60 nm2 s−1 and 2.2 nm2 s−1, the simulated average grain size of TiN coatings slightly increases from 10.38 to 10.61 nm and then to 12.13 nm, which is in approximate agreement with the experimental data, considering the uncertainty induced by the shape factor of grains. The average grain size due to experimental mensuration exhibits a significant increase as the bias voltage decreases. The influence of bias voltage on grain size can be explained from the phase-field simulations. The increase of bias voltage is expected to lead to the decrease of both vapor–solid transition velocity and diffusion coefficient. The decrease of vapor–solid transition velocity contributes to the increase of grain size as species in vapors is likely to diffuse along the surface of the solidified parts, and epitaxial growth perpendicular to the development direction is to be enhanced. Similarly, the decrease of the diffusion coefficient has an effect on the decrease of grain size due to insufficient mass supply. Thus, the average grain size of PVD TiN coatings is determined by the combined effect of vapor–solid transition velocity and diffusion coefficient. The reason for the deviation between simulated grain size and experimental results is that the longitudinal sections of coatings are subjected to XRD in the experimental study, while the calculated grain size is analyzed from each transverse layer between tips and bottom of the simulated columnar structure.
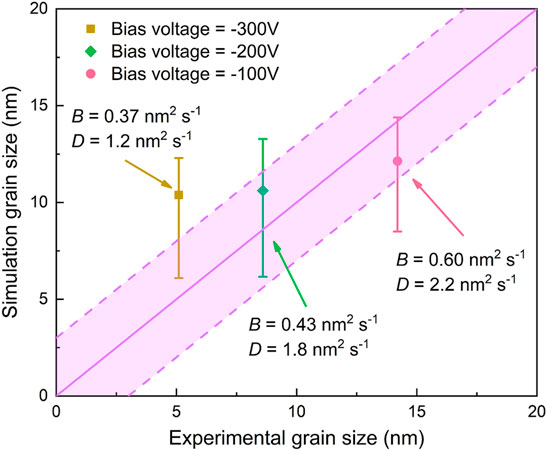
FIGURE 7. Comparison of the grain size of TiN coatings between the phase-field simulation results during PVD growth applying different vapor-solid transition velocities (i.e., B) and diffusion coefficients (i.e., D) and the experimental data with various bias voltage (Wang et al., 2015).
3.2 Multi-Objective Decision-Making Strategy
For industrial applications, multiple coating property metrics are considered during the processing and service periods. Deposition rate is one of the dominant factors intimately correlating with the production efficiency and cost. In addition, the deposition rate also concerns with successive coating property metrics, that is, grain size, porosity, and surface roughness. For PVD TiN coatings for cutting tools, a finer gain size results in higher hardness and mechanical strength, but meanwhile, the porosity and unexpected surface roughness might be avoided. However, a higher deposition rate is prone to resulting in coatings with porosity, and the level of surface roughness might be high where in-sequence post-processing processes are, therefore, desired for satisfactory surface quality. Considering the marginal effect between the processing parameters and different coating property metrics, the decision-making problem toward the coatings with optimal process parameters for best properties turns to be complicated as multiple objectives are to be resolved.
In terms of the multi-objective decision-making problem, two important aspects should be addressed. The first concerns with supporting information for making the decision. Phase-field simulation has come to such a stage, where microstructures of related PVD processes can be retrieved according to the model parameters and assumed environment conditions. Practical experiments, which are generally expensive with respect to either time consumption or experiment cost, can serve as validation evidence for numerical simulations. Beyond validation, linking between the model parameters and real process parameters is likely to be formed, where either a qualitative or quantitative relation can be retained. With numerical simulation results, snapshots for microstructures during different processing periods are provided, where analysis over the corresponding coating property metrics can be conducted. Experimental data can again substantiate the validation of the related phase-field simulation results. The overall correlation between processing parameters and coating property metrics is subsequently established.
Once the supporting information is acquired, decision-making can therefore be carried out only if the specific procedures can be followed. For single-objective problem, either a convex or non-convex optimization algorithm is feasible for resolving the optimal decision vector with or without constraints. However, complex marginal effects are to be encountered even if more than one objective is being examined. One common strategy is to reasonably transform the multi-objective problem into a single-objective one by means of weighting the individual objective with suitable weights. Typically, weight is expertise-based knowledge information, which is extremely useful when the problem being examined is reaching the state of art. In case of an unexplored terrain, expertise-based information is generally absent, when decision-making processes toward the optimal design are likely to be impeded.
As multi-objective problems are one of the most well-studied problems by mathematics, feasible specification is, therefore, enabled by learning from related methods, that is, Pareto front and hierarchical analysis. Pareto front is one of the most insightful tools for measuring the marginal effects when multiple objectives are being concerned. Pareto front is the collection of feasible solutions, of which each is non-dominated by others when no performance deterioration is expected. In other words, each solution of the Pareto front is one of the decision-making suggestions, where the marginal effects of different objectives are subject to specific faith or evaluation criterion. Generally, the Pareto front is identified among the collection of many feasible solutions, which might be one or tens of times about the number of solutions located in the frontier. Acceleration is generally indispensable when the sampling procedures are time-consuming (Gao et al., 2022). Effective sampling strategies, that is, non-dominated sorting genetic algorithm and multi-objective tree-structured Parzen estimator would also be desired when the evaluation processes of sampling are of high experimental or numerical computing cost.
Usually, the multi-objective problem can be reduced to a single-objective problem when multiple objectives are properly penalized. However, when expertise experience is absent, bias and subjective influence seem inevitable. To obtain the comprehensive overview toward multiple objectives, hierarchical analyses are generally adopted. The analytic hierarchy process is usually a problem-dependent method, where nebulous prior knowledge toward the importance of objectives in practical applications is required. Therefore, objectives can be classified, ranked, and selected from the overall feasible solutions, that is, the Pareto frontier.
The framework for the present hierarchical multi-objective optimization is displayed in Figure 8. Phase-field simulations are used for acquiring sufficient supporting information for decision-making. Metrics toward different coating properties are, therefore, evaluated based on the numerous simulation results. Experimental data from the practical PVD processing processes serve as validation evidence, which enables the linking between the processing parameters and model parameters. As a result, the correlation between the processing parameters and different objective metrics is established. In this work, the hierarchical multi-objective optimization involves two stages: intuitive visualization and analytic hierarchy process. Intuitive understanding toward the correlation between processing parameters and coating properties can be first acquired by proper visualization. Dual objectives are then examined where the Pareto frontier should be identified. Mapping with an overlapped contour could serve as an alternative approach when the number of variable factors is limited and therefore visualization is enabled. As the number of objectives increases, overlapped mapping might be the most suitable method for the analytic hierarchy process. Here, we focus on the TiN-based coatings, especially for cutting tools, and up to four objectives (i.e., deposition rate, porosity, surface roughness, and grain size) are concerned.
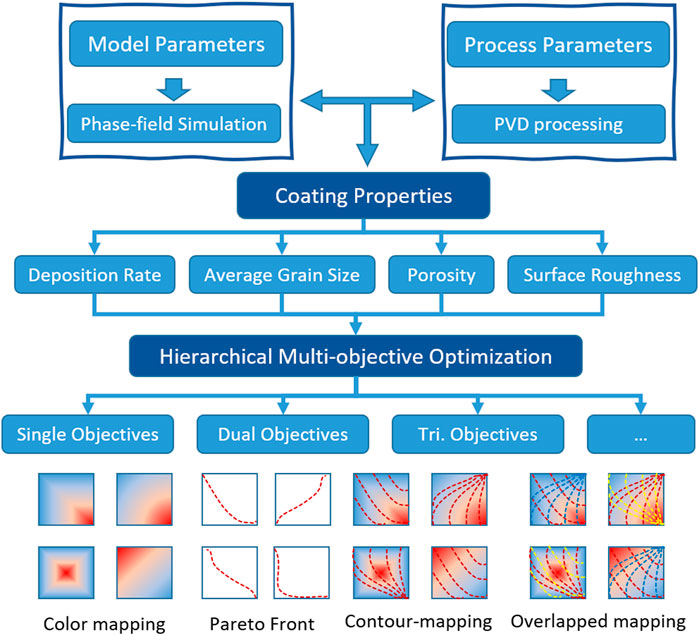
FIGURE 8. Hierarchical multi-objective decision-making strategy for coatings by PVD processing.
3.3 Screening of Optimal Model Parameters for Best Coating Properties
In terms of industrial applications, the fabricated coatings should possess the best properties with respect to specific practical requirements. For instance, PVD coatings with appropriate amount of porosity are desired for filter materials and catalytic materials, while the latter would also have special requirement on the roughness of the surface. As for cutting tools, PVD coatings are responsible for providing extremely high toughness, and thus the coatings with porosity are anticipated to be avoided as vibration during cutting processes will likely damage the coating structure. Roughness of the coatings is related to subsequential manufacturing processes and is largely influential on the friction and wear properties. Furthermore, grain size plays an important role in mechanical performances such as the strength and hardness of the coatings for cutting tools. Another key point in industrial production lies in the productivity, which is closely tied to the deposition rate of coatings during PVD processing. Considering both production efficiency and coating properties, ideal factors such as high deposition rate, low porosity ratio, flattened surface morphology, and small grain size are desired in PVD coatings for cutting tools. Therefore, multiple objectives are to be considered for the present design of PVD TiN coatings.
Specifically, objective 1, which denotes the deposition rate, is to be maximized; while objectives 2–4, respectively, denoting the porosity, surface roughness and grain size, are all to be minimized. To simplify the process of optimization, the inverse of the deposition rate is applied. Then, all four objectives should be minimized, aiming at screening the optimal process parameters for PVD TiN coatings with best properties. The set of mathematical optimal solutions generally indicated as the Pareto frontier of objective space is shown in Figure 9. Figure 9 illustrates the correlation between pairwise objectives from concerned properties of the imitated coatings, and all feasible choices over the objective space are denoted as green dots. By applying the Pareto search algorithm on the dataset, the Pareto frontiers are then determined, that is, the circles highlighted in purple. The Pareto frontier can be used to identify the ideal combination of pairwise coating performance. In Figure 9, it is observed that there are two types of relations based on a comprehensive analysis of various objective spaces. One is that the two objectives are not in conflict, as shown in Figures 9A,F, where the two objectives are approximately positively correlated, that is, when the value of one objective decreases, the other objective can also take a smaller value. In this case, a single solution exists that simultaneously minimizes each objective, while the other type is that the two objectives are conflicting, as shown in Figures 9B–E. Figures 9B,C exhibit more obvious negative correlation than Figures 9D,E. Therefore, the set of Pareto optimal solutions is found to satisfy the different objectives. For example, when the average grain size is expected to be 12 nm, the least related roughness is about 9 nm.
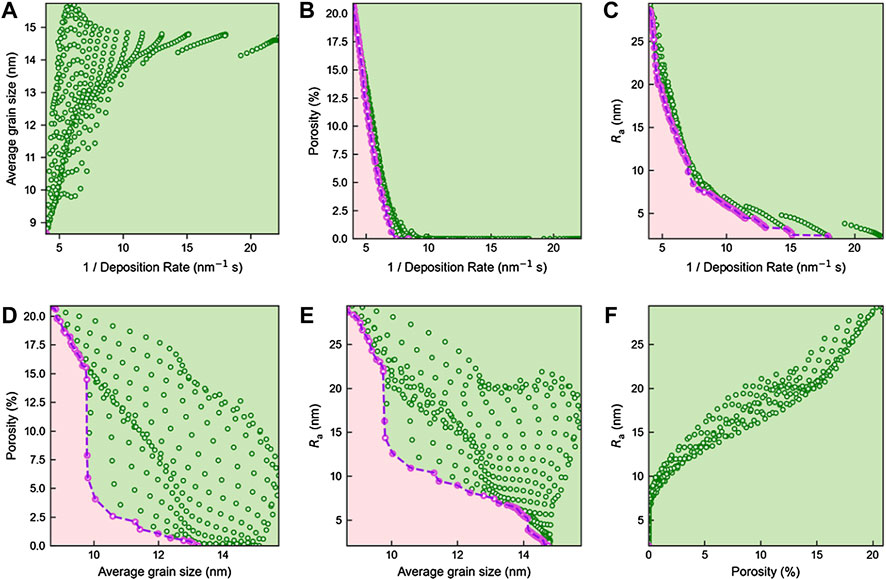
FIGURE 9. Mathematical optimal solutions (Pareto frontier) for simultaneous optimization of multiple objectives: (A) deposition rate and grain size, (B) deposition rate and porosity, (C) deposition rate and surface roughness, (D) grain size and porosity, (E) grain size and surface roughness, and (F) porosity and surface roughness.
In order to further correlate the coating properties and model parameters, the predicted cases with respect to a combination of different objectives on the Pareto frontier are further investigated. Particularly, different objectives, that is, grain size, porosity, and surface roughness against the deposition rate are examined, as shown in Figure 10. The heatmap is used to visualize the deposition rate against the model parameters, while the other objectives (i.e., grain size, porosity, and surface roughness) are being imposed in the form of a contour, as shown in Figures 10A–C. For grain size, a similar tendency is observed with respect to the varying deposition rate. The lowest level of grain size is reached when the deposition rate is of high level. For porosity, a consistent tendency is observed considering the varying deposition rate, where a critical region is found at the region of the lower deposition rate. Moreover, a critical point can be further determined to be B = 0.39 nm2 s and D = 2.9 nm2 s. As for surface roughness, the potential levels of roughness are diverse and can be controlled according to the model parameters. For the smooth surface, the processes with lower deposition rates are beneficial, while higher deposition rates lead to coatings with rough surfaces.
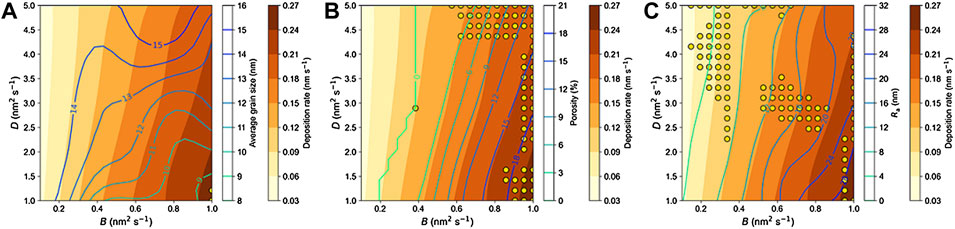
FIGURE 10. Screening window of the model parameters for best coating property combination of: (A) deposition rate and grain size, (B) deposition rate and porosity, and (C) deposition rate and surface roughness.
For a multi-objective decision-making problem, consideration of dual objectives seems to be still incomplete. Therefore, the objectives including grain size, porosity, and surface roughness are further synthesized, as shown in Figure 11. In the figure, the grain size against the model parameters is plotted as the heatmap, and the contour of the solid lines demonstrates the porosity, while the contour of the dash lines indicates the level of roughness. Furthermore, the optimal points for dual objectives are also recommended by Pareto front calculation. Overlapping regions are found among the Pareto front related to grain size against the porosity and surface roughness, where the surface diffusion coefficient D is of a lower level. Two distinct regions are suggested, that is, the one with B from 0.3 nm2 s to 0.5 nm2 s, and the other, from 0.85 nm2 s to 1.0 nm2 s. For the region with B of smaller magnitude, the grain size is prone to change along with the vapor–solid transition velocity. As for the region with B of larger magnitude, the deposition rate is higher than that of the others. Recalling the experimental results with relatively better coating properties reported by Wang et al., (2015), it is found that the corresponding result (marked as star symbol in Figure 11) exactly lies in one of the previously recommended regions, which clearly proves the reliability of the present strategy of screening the optimal model/process parameters for best coating properties. Furthermore, based on Figure 11, another potential processing window with a higher deposition rate is also suggested for industrial production, though the corresponding porosity and surface roughness are of a less promising level. As shown in Figure 11, the quantitative relation between the model parameters and coating properties (i.e., porosity, surface roughness, and grain size) has been established, which means that once the optimal model parameters are acquired, different coating properties can be quantitatively predicted, or when the coating properties are determined according to practical needs, the optimal combination of model parameters is expected to be inferred. Then, on the basis of the parametric relation between the model parameters and process parameters established in the work of Section 3.1, the process parameters (such as the bias voltage here) can be reversely traced, as shown in Figure 4. Coordinating the research results of Section 3.1 and this section, the quantitative relation of “process-microstructure-properties” can be established.
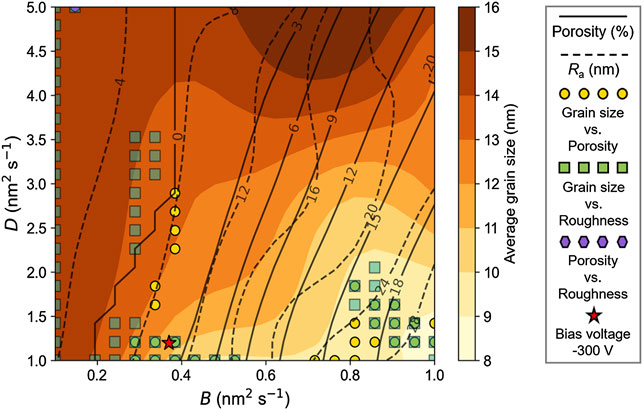
FIGURE 11. Screening window of the model parameters for best coating property combinations of grain size, porosity, and surface roughness, compared with the best experimental result (Wang et al., 2015).
4 Conclusion
The growth processes of TiN coatings prepared by PVD (specifically HiPIMS) under different process parameters were reproduced by phase-field simulations with different sets of model parameters. The parametric relation among the process parameters (i.e., bias voltage), model parameters, and different coating properties was then successfully established by correlating between the phase-field simulation results and the limited experimental data.
A hierarchical multi-objective optimization-based approach for a comprehensive design of the best coating properties and the corresponding optimal process windows was proposed and successfully applied in PVD TiN coatings based on the quantitative phase-field simulations. The screened windows for PVD TiN coatings were validated to be consistent with the optimal experimental results.
It is anticipated that a combination of 3-D quantitative phase-field simulation and hierarchical multi-objective optimization strategy should be feasible for the high-throughput screening of optimal process parameters for different PVD coatings with best properties.
Data Availability Statement
The raw data supporting the conclusions of this article will be made available by the authors, without undue reservation.
Author Contributions
LZ conceived the idea, RD conducted the phase-field simulations, RD and JZ performed the multi-objective optimization, and SY and TZ helped check grammar problems concerning tenses and syntax errors. All authors analyzed the results and contributed to writing the manuscript.
Funding
The financial support from the Youth Fund of the National Natural Science Foundation of China (Grant No. 52101028), China Postdoctoral Science Foundation (Grant No. 2021M703628), the Guangdong Provincial Natural Science Foundation Project (Grant No. 2020A1515010948), the Special fund project of Guangdong Academy of Sciences (Grant No. 2020GDASYL-20200104028), and Guangzhou Major Projects of Industry-University-Research (IUR) Collaborative Innovation “Surface Treatment and Repair for Key Components of Industrial Gas Turbine (IGT)” is acknowledged. RD acknowledged the financial support by the Fundamental Research Funds for the Central Universities of Central South University (Grant No. 2021zzts0582) and the financial support by the Postgraduate Scientific Research Innovation Project of Hunan Province (Grant No. CX20210195).
Conflict of Interest
The authors declare that the research was conducted in the absence of any commercial or financial relationships that could be construed as a potential conflict of interest.
Publisher’s Note
All claims expressed in this article are solely those of the authors and do not necessarily represent those of their affiliated organizations, or those of the publisher, the editors, and the reviewers. Any product that may be evaluated in this article, or claim that may be made by its manufacturer, is not guaranteed or endorsed by the publisher.
Supplementary Material
The Supplementary Material for this article can be found online at: https://www.frontiersin.org/articles/10.3389/fmats.2022.924294/full#supplementary-material
References
Alami, J., Maric, Z., Busch, H., Klein, F., Grabowy, U., and Kopnarski, M. (2014). Enhanced Ionization Sputtering: A Concept for Superior Industrial Coatings. Surf. Coat. Technol. 255, 43–51. doi:10.1016/j.surfcoat.2013.11.040
Aqil, M. M., Azam, M. A., Aziz, M. F., and Latif, R. (2017). Deposition and Characterization of Molybdenum Thin Film Using Direct Current Magnetron and Atomic Force Microscopy. J. Nanotechnol. 2017, 1–10. doi:10.1155/2017/4862087
Barshilia, H. C., Surya Prakash, M., Poojari, A., and Rajam, K. S. (2004). Corrosion Behavior of Nanolayered TiN/NbN Multilayer Coatings Prepared by Reactive Direct Current Magnetron Sputtering Process. Thin Solid Films 460 (1), 133–142. doi:10.1016/j.tsf.2004.01.096
Bhaduri, D., Ghosh, A., Gangopadhyay, S., and Paul, S. (2010). Effect of Target Frequency, Bias Voltage and Bias Frequency on Microstructure and Mechanical Properties of Pulsed DC CFUBM Sputtered TiN Coating. Surf. Coat. Technol. 204 (21), 3684–3697. doi:10.1016/j.surfcoat.2010.04.047
Bobzin, K., Brögelmann, T., Kruppe, N. C., and Engels, M. (2019). Influence of HPPMS on Hybrid dcMS/HPPMS (Cr,Al)N Processes. Surf. Coat. Technol. 358, 57–66. doi:10.1016/j.surfcoat.2018.11.032
Deng, Y., Chen, W., Li, B., Wang, C., Kuang, T., and Li, Y. (2020). Physical Vapor Deposition Technology for Coated Cutting Tools: A Review. Ceram. Int. 46 (11), 18373–18390. doi:10.1016/j.ceramint.2020.04.168
Fu, T., and Shen, Y. (2008). Surface Growth and Anomalous Scaling of Sputter-Deposited Al Films. Phys. B Condens. Matter 403 (13-16), 2306–2311. doi:10.1016/j.physb.2007.12.010
Gao, J., Zhong, J., Liu, G., Yang, S., Song, B., Zhang, L., et al. (2022). A Machine Learning Accelerated Distributed Task Management System (Malac-Distmas) and its Application in High-Throughput CALPHAD Computation Aiming at Efficient Alloy Design. Adv. Powder Mater. 1 (1), 100005. doi:10.1016/j.apmate.2021.09.005
Hernández, L. C., Ponce, L., Fundora, A., López, E., and Pérez, E. (2011). Nanohardness and Residual Stress in TiN Coatings. Materials 4 (5), 929–940. doi:10.3390/ma4050929
Keblinski, P., Maritan, A., Toigo, F., Messier, R., and Banavar, J. R. (1996). Continuum Model for the Growth of Interfaces. Phys. Rev. E 53 (1), 759–778. doi:10.1103/physreve.53.759
Kuo, C.-C., Lin, Y.-T., Chan, A., and Chang, J.-T. (2019). High Temperature Wear Behavior of Titanium Nitride Coating Deposited Using High Power Impulse Magnetron Sputtering. Coatings 9 (9), 555. doi:10.3390/coatings9090555
Lichter, S., and Chen, J. (1986). Model for Columnar Microstructure of Thin Solid Films. Phys. Rev. Lett. 56 (13), 1396–1399. doi:10.1103/physrevlett.56.1396
Lousa, A., Esteve, J., Mejia, J. P., and Devia, A. (2007). Influence of Deposition Pressure on the Structural Mechanical and Decorative Properties of TiN Thin Films Deposited by Cathodic Arc Evaporation. Vacuum 81 (11), 1507–1510. doi:10.1016/j.vacuum.2007.04.017
Ma, Q., Li, L., Xu, Y., Gu, J., Wang, L., and Xu, Y. (2017). Effect of Bias Voltage on TiAlSiN Nanocomposite Coatings Deposited by HiPIMS. Appl. Surf. Sci. 392, 826–833. doi:10.1016/j.apsusc.2016.09.028
Mayrhofer, P. H., Geier, M., Löcker, C., and Chen, L. (2009). Influence of Deposition Conditions on Texture Development and Mechanical Properties of TiN Coatings. Int. J. Mater. Res. 100 (8), 1052–1058. doi:10.3139/146.110159
Mayrhofer, P. H., Kunc, F., Musil, J., and Mitterer, C. (2002). A Comparative Study on Reactive and Non-reactive Unbalanced Magnetron Sputter Deposition of TiN Coatings. Thin Solid Films 415 (1), 151–159. doi:10.1016/S0040-6090(02)00511-4
Rosa, A., Da Silva, E., Amorim, E., Chaves, M., Catto, A., Lisboa-Filho, P. N., et al. (2012). Growth Evolution of ZnO Thin Films Deposited by RF Magnetron Sputtering. J. Phys. Conf. Ser. 370, 012020. IOP Publishing. doi:10.1088/1742-6596/370/1/012020
Stewart, J. A., and Spearot, D. E. (2016). Phase-field Models for Simulating Physical Vapor Deposition and Grain Evolution of Isotropic Single-phase Polycrystalline Thin Films. Comput. Mater. Sci. 123, 111–120. doi:10.1016/j.commatsci.2016.06.021
Stewart, J. A., and Spearot, D. E. (2017). Phase-Field Simulations of Microstructure Evolution during Physical Vapor Deposition of Single-phase Thin Films. Comput. Mater. Sci. 131, 170–177. doi:10.1016/j.commatsci.2017.01.034
Tai, C. N., Koh, E. S., and Akari, K. (1990). Macroparticles on TiN Films Prepared by the Arc Ion Plating Process. Surf. Coat. Technol. 43-44, 324–335. doi:10.1016/0257-8972(90)90085-Q
Wang, Z., Zhang, D., Ke, P., Liu, X., and Wang, A. (2015). Influence of Substrate Negative Bias on Structure and Properties of TiN Coatings Prepared by Hybrid HIPIMS Method. J. Mater. Sci. Technol. 31 (1), 37–42. doi:10.1016/j.jmst.2014.06.002
Warren, J. A., Kobayashi, R., Lobkovsky, A. E., and Craig Carter, W. (2003). Extending Phase Field Models of Solidification to Polycrystalline Materials. Acta Mater. 51 (20), 6035–6058. doi:10.1016/S1359-6454(03)00388-4
Wu, J., Wu, B. H., Ma, D. L., Xie, D., Wu, Y. P., Chen, C. Z., et al. (2017). Effects of Magnetic Field Strength and Deposition Pressure on the Properties of TiN Films Produced by High Power Pulsed Magnetron Sputtering (HPPMS). Surf. Coat. Technol. 315, 258–267. doi:10.1016/j.surfcoat.2017.02.051
Yang, S., Zhong, J., Chen, M., and Zhang, L. (2019). A Parametric Three-Dimensional Phase-Field Study of the Physical Vapor Deposition Process of Metal Thin Films Aiming at Quantitative Simulations. Coatings 9 (10), 607. doi:10.3390/coatings9100607
Yiğit, E. (2017). Atmospheric and Space Sciences: Ionospheres and Plasma Environments, 2. Cham, Switzerland: Springer.
Zhang, Q., Xu, Y., Zhang, T., Wu, Z., and Wang, Q. (2018). Tribological Properties, Oxidation Resistance and Turning Performance of AlTiN/AlCrSiN Multilayer Coatings by Arc Ion Plating. Surf. Coat. Technol. 356, 1–10. doi:10.1016/j.surfcoat.2018.09.027
Keywords: physical vapor deposition, TiN coating, phase-field simulation, microstructure, multi-objective optimization
Citation: Dai R, Yang S, Zhang T, Zhong J, Chen L, Deng C and Zhang L (2022) High-Throughput Screening of Optimal Process Parameters for PVD TiN Coatings With Best Properties Through a Combination of 3-D Quantitative Phase-Field Simulation and Hierarchical Multi-Objective Optimization Strategy. Front. Mater. 9:924294. doi: 10.3389/fmats.2022.924294
Received: 20 April 2022; Accepted: 06 May 2022;
Published: 13 June 2022.
Edited by:
Yu-Hong Zhao, North University of China, ChinaReviewed by:
Zhonghui Shen, Wuhan University of Technology, ChinaHoubing Huang, Beijing Institute of Technology, China
Copyright © 2022 Dai, Yang, Zhang, Zhong, Chen, Deng and Zhang. This is an open-access article distributed under the terms of the Creative Commons Attribution License (CC BY). The use, distribution or reproduction in other forums is permitted, provided the original author(s) and the copyright owner(s) are credited and that the original publication in this journal is cited, in accordance with accepted academic practice. No use, distribution or reproduction is permitted which does not comply with these terms.
*Correspondence: Jing Zhong, emhvbmdqaW5nam9neUBjc3UuZWR1LmNu; Lijun Zhang, bGlqdW4uemhhbmdAY3N1LmVkdS5jbg==