 Deyuan Deng
 Zhijian Wang3
- 1China Construction Steel Engineering Co. Ltd., Shenzhen, China
- 2China Construction Steel Structure Guangdongcorp.ltd., Huizhou, China
- 3China Railway Guangzhou Group Co. Ltd., Guangzhou, China
- 4Dongguan Hongchuan Intelligent Logistics Development Co. Ltd., Dongguan, China
- 5School of Transportation and Civil Engineering and Architecture, Foshan University, Foshan, China
Accurate simulation of walking load is of great significance in conducting human-induced vibration analyses. However, accurate pedestrian walking load data obtained from long-span footbridges is scarce and data reliability depends on the sensor used for measurement. In the current work, Yanluo Footbridge with 102 m span was adopted as test site and Xnode high-precision acceleration wireless sensor was applied for measurements. An experimental investigation was performed on walking loads according to bipedal walking force model. In experimental studies, single-person and multi-person walking tests were performed at Yanluo Footbridge to measure corresponding stride frequency and dynamic load factor. The acceleration time-histories of walking pedestrians were accurately recorded using three-axis wireless acceleration sensor Xnode. Furthermore, the equation of dynamic load factor was derived by analyzing time-histories and power spectra and the design models of pedestrian walking load and crowd load were developed based on a great number of experimental data. Time histories of pedestrian walking loads showed regular periodic changes and dynamic load factor increased by increasing stride frequency. Using the walking load model developed in this work, the reliable structure response of human-induced vibration analysis can be obtained.
Introduction
To measure pedestrian force, the time-history curve of footstep load was directly observed using force measuring plate, walking machine, and other instruments to analyze its characteristics and develop a mathematical model. (Harper et al., 1961) developed a force plate to measure the time-history curves of vertical, lateral, and longitudinal components of the footstep load of an individual pedestrian, which was the first experimental measurement of pedestrian load. Due to early development of force plates and high accuracy of their measured data, many researchers have applied and improved them and its technology has been matured. However, the large volume and fixed position of the instrument limit the free walking of the tester. However, application of a wireless acceleration sensor fixed in the body or waist leg is more convenient when collecting data on human movement characteristics and pedestrian movement is not limited by the bulkiness of the device. With rapid development of electronic technology, production cost of wireless sensors is decreasing, attracting the attention of researchers around the world. For example, Song et al. applied acceleration sensors for the development of activity recognition systems capable of identifying daily activities such as running, walking, sitting, standing, lying down, falling, etc., by fixing sensor module connected to mobile phone on a belt with recognition accuracy of up to 95.5%. A human body daily activity recognition system was designed using three-axis acceleration sensors (Khan et al., 2010). By placing the recognition model on waist, coat pocket, etc., daily physical activities such as going up and downstairs, resting, riding and so on could be identified. Recognition accuracy of this method could reach 95.96%. (Ailisto et al., 2005) applied a triaxial acceleration sensor fixed at waist to collect acceleration signals of walking and compared the collected signals and with stored template signals. He found that the average error rate was only 6.4%. In addition, accurate pedestrian walking load data obtained from long-span footbridges, such as arch bridge (Lu et al., 2021a; Lu et al., 2021b; Yang et al., 2022a) is scarce and data reliability depends on the sensor used for measurement.
Acceleration sensors could effectively record responses containing human motion information. Many other researchers have conducted similar studies (Zhu et al., 2018; Chen et al., 2019; Wang et al., 2019; Mohammed and Pavic, 2021; Paweł et al., 2021; Xiong et al., 2021; Chen et al., 2022). However, few studies are available on indirect measurement of walking force using acceleration sensors. Several approaches have been designed to measure walking force by acceleration detection systems based on 2DOF-bipedal walking force (Ebrahimpour et al., 1996; Živanović et al., 2005; Bachus et al., 2006; Geyer et al., 2006; Bachus et al., 2006; Gurney et al., 2008; Jones et al., 2011). Our findings confirmed that the developed system was able to effectively measure walking force and walking characteristics. However, both studies simplified human body as a double particle and measured human body acceleration at the double center of mass by acceleration sensors. However, test procedure was relatively complex; the accelerations of mass centers of the three test pedestrians were obtained under their free walking and the number of test pedestrians and test conditions were inadequate, which made it impossible to demonstrate the differences of the walking forces of testers with different human characteristic parameters. According to previous research works based on bipedal walking force model, in this work, human body was considered as a single particle. A three-axis wireless acceleration sensor measured human body motion accelerations at the center of mass and two legs. Furthermore, the dynamic load factor of pedestrian walking load, which is a fundamental parameter in describing harmonic amplitude, could be obtained from a large number of experimental data. Using the walking load model developed in this work, the reliable structure response of human-induced vibration analysis can be obtained. Since pedestrian load can be regarded as impact load or periodic load, the results of this experiment can provide a standardized load model for the response of bridge structure under impact load (Yang et al., 2021a) or periodic load (Yang et al., 2022b). In addition, the experiments described in this paper provided test results for the formulation of regulations related to structural vibrations in China and provided technical support for vibration displacement monitoring of long-span structure (Lu et al., 2020) and composite structures (Yang et al., 2021b).
In this paper, an experimental investigation was performed on pedestrian walking and crowd loads and a corresponding mechanical model was developed. We performed theoretical studies using bipedal walking force model. In experimental investigations, out single-person and multi-person walking tests were performed at Yanluo footbridge and tested corresponding stride frequency and dynamic load factor were evaluated. With three-axis wireless acceleration sensor Xnode, the acceleration time-histories of pedestrian walking were accurately recorded. Also, dynamic load factor equation was obtained by analyzing time-histories and power spectra. Finally, design models were established for pedestrian walking and crowd loads based on a huge number of experimental data.
Bipedal Walking Force Model
Several pedestrian models have been developed to study pedestrian load (Wei and Griffin. 1998; Živanovic et al., 2005; Racic et al., 2009; Venuti and Bruno 2009; Bocian et al., 2013; Han et al., 2017; Gao et al., 2018; Han et al., 2021). Bipedal force model was established by (Geyer et al., 2006) based on spring-mass model taking into account the gait characteristics supported by bipedal during walking. As shown in Figure 1, this model ignored foot rotation and simplified human body into a single-particle system. Legs were simplified as two independent massless springs supported on point mass. Both springs had stiffness, rest length, and constant angle relative to gravity (g is gravity acceleration) during follow-up phase. The figure showed a complete gait, including two stages of monopod support and bipedal support. Bipedal stage was from touching the ground with the heel of the right foot (TD) to lifting the tip of the left foot off the ground (TO). The leg which is pulled off the ground from the tip of the foot until the heel is landed again during walking is known as trailing leg, while the other leg is called leading leg. Geyer proved that the model could simulate vertical walking force with bimodal properties and vertical displacement of the center of mass.
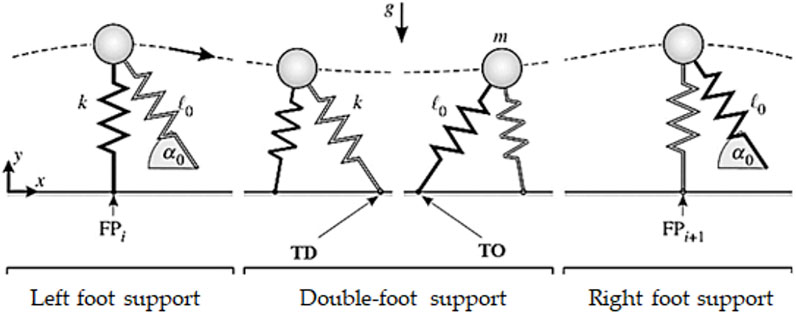
FIGURE 1. Biped walking force model (Gurney et al.).
(Qin et al., 2013) introduced damping parameters on the basis of Geyer’s bipedal model taking into account human-structure interaction. As shown in Figure 2, the two legs of a person were simplified as massless springs and damping rods which moved independently. In the process of moving, two spring legs absorbed the generated impact energy when they touched the ground (impact angle) simultaneously providing propulsion power. In the case of single-foot support, trailing leg was not in contact with ground. At this moment, spring leg was in original state, under which elastic recovery and damping forces were zero. Meanwhile, leading leg was in contact with ground. Accordingly, spring was in compressed state, so that elastic recovery and damping forces balanced each other with gravity and inertia forces of human body.
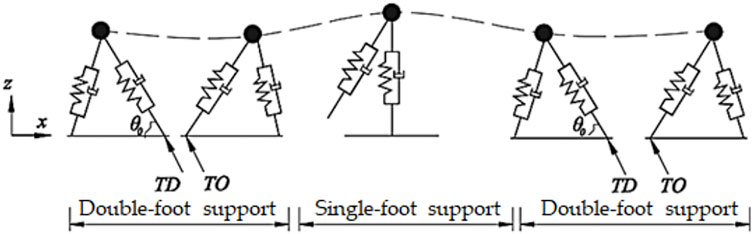
FIGURE 2. Damped biped walking force model (Chen et al.).
Principle of Test Design
Bipedal model of biomechanics simplified human body as a point mass. Accordingly, two legs of human body were simplified as a massless system consisting of two springs and damping forces. The elastic and damping forces generated by pedestrians when touching the ground in motion was in balance with gravity and inertia forces of human body. As presented in Figure 3, human body mass was represented by the mass
where
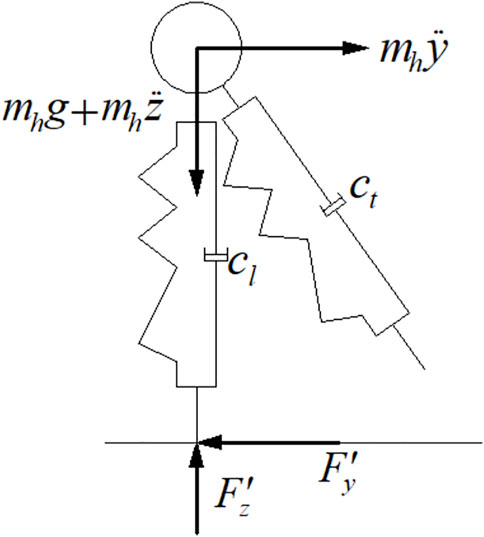
FIGURE 3. Mechanical analysis.
According to the derived balance equation, a three-axis acceleration sensor was fixed on pedestrian waist to measure the vertical and longitudinal accelerations of the pedestrian when walking. Therefore, ground reaction force could be calculated. The walking force of pedestrian was obtained based on action-reaction relationship as
Furthermore, by fixing the three-axis acceleration sensor on the left or right legs of the pedestrian, the vertical acceleration of pedestrians’ walking when his left or right leg touched the ground could be effectively measured.
Pedestrian walking load is difficult to predict and its frequency and magnitude can significantly change. Walking is generally characterized as regular predominantly horizontal human body motion whereby at least one foot is always in contact with ground in a frequency ranging from 1.4 to 2.5 Hz (Jones et al., 2011). Typical Fourier series was used to represent periodic pedestrian walking load, which was expressed as
where
where
Therefore, in order to develop pedestrian walking load model, first dynamic load factor had to be evaluated. In addition, the expansion of pedestrian walking load models calibrated for individuals into models for crowd loads is an important subject. According to Eq. 5, crowd load model could be expressed as
where
Experimental Researches
The major instruments adopted in this work included three-axis wireless acceleration sensor, gateway node the computer with a corresponding terminal program installed. Terminal program enabled the computer to communicate with Xnode gateway node, as shown in Figure 4. Embedor’s proprietary synchronized distributed sensing framework could precisely deliver synchronized sensed data from thousands of distributed sensor channels. Wireless communication protocol between Xnodes and Gateways enabled highly accurate time synchronization with precision of 50-microsecond and ensured reliable and lossless data transfer under any operating conditions. Furthermore, each Xnode could be configured either as a sensor node or as a Gateway to coordinate and maintain wireless transmissions across a network of distributed wireless sensor nodes. This modular and versatile sensor platform enabled wireless data acquisition and processing for data-intensive applications (high resolution and high sampling rate) such as structural health monitoring, manufacturing and monitoring of industrial equipment, and seismic sensing. Sensor board employed a 24-bit ADC (Texas Instruments ADS131E8) with eight channels allowing maximum sampling rates up to 16 kHz. The device was equipped with an ultra-compact low power triaxial accelerometer and technical parameters are summarized in Table 1. Xnode wireless triaxial acceleration sensor could obtain acceleration along three directions of any position in human body. Studies have shown that human body mass center was closest to waist abdomen. Therefore, in experiments, three sensors were placed on tester’s back, waist, and two legs. The X-axis of sensor was aligned with the vertical direction of human body to obtain vertical acceleration of mass center, Y-axis was aligned with horizontal direction of human body, and Z-axis was aligned with forward direction.
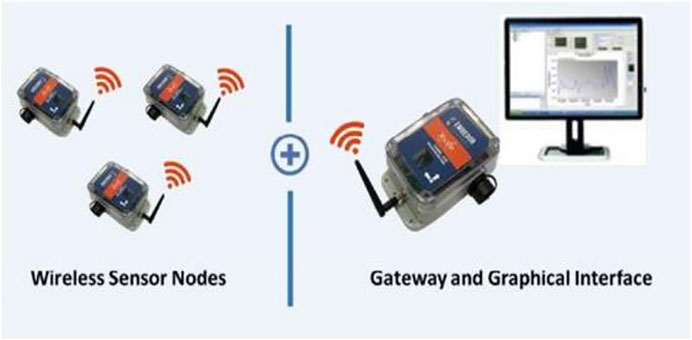
FIGURE 4. Xnode wireless sensor.

TABLE 1. Xnode performance parameters.
Finite Element Analysis
Yanluo Footbridge in Shenzhen with 102 m length and level ground was selected as test site, as shown in Figure 5. Yanluo Footbridge is a steel foot bridge and was designed for Foxconn workers to connect dormitory and work areas. Therefore, the flow of people was relatively large and people walked in a hurry. Using MIDAS Civil for eigenvalue analysis, natural vibration characteristics of the first 3 orders were calculated. The frequency and period of natural vibration are summarized in Table 2 and the first 3 modal diagrams are shown in Figure 6.

FIGURE 5. Yanluo footbridge.

TABLE 2. The first 10 natural vibration frequencies and periods.
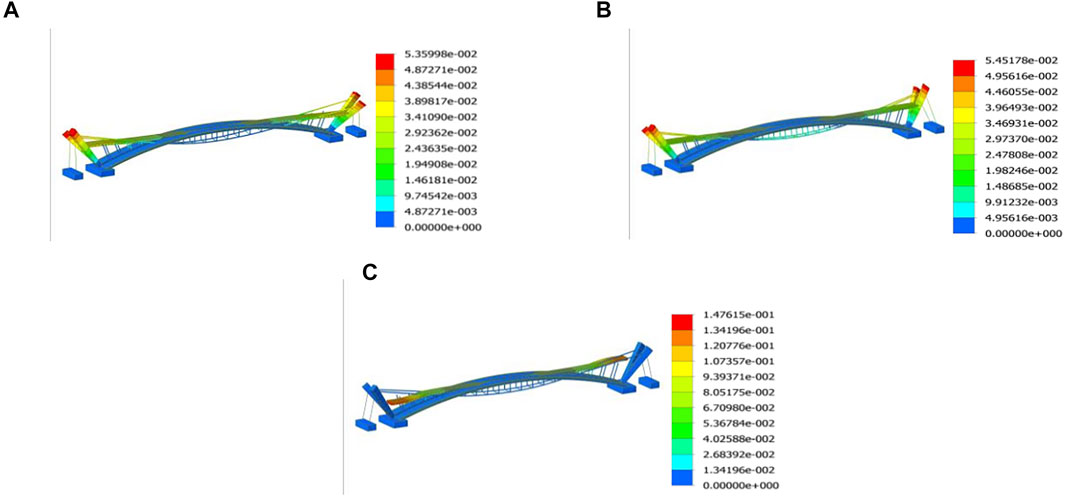
FIGURE 6. Diagram of the first 3 modes: (A) 1 order vibration mode; (B) 2 order vibration mode; (C) 3 order vibration mode.
When the frequency of the pedestrian load is close to the natural vibration frequency of the footbridge, the pedestrian bridge resonance may occur. It could be seen from Figure 6 that the third-order natural vibration frequency of the modified bridge was relatively close to pedestrian stride frequency but further analysis was required.
Walking Force Test for the Single Person
To avoid pedestrian interference, tests were performed at night. For accurate investigation, two men and two women without walking defects were adopted for the test. The physical characteristics of the testers were collected and recorded before the test, as shown in Table 3. In order to simultaneously observe leg acceleration change during walking process, three wireless acceleration sensors were attached to the waist and front side of the left and right thighs of the testers through bandages.
TABLE 3. Physical characteristic values of testers.
In experiments, fixed walking frequencies of 1.4, 1.6, 1.8, 2.0, 2.2, and 2.5 Hz and two groups of random walking frequencies were selected in all eight working conditions, in which a metronome controlled fixed walking frequency. After the sensor was fixed, testers performed adaptive walking training until they could adapt to normal walking instrument. After turning on the child node switch and waiting for the gateway node to set out the test instruction, the tester followed the metronome to walk uniformly along the test route. After finishing fixed cadence test, testers walked along a random uniform straight line with cadence according to their walking habits. During the tests, step number and walking time of each tester was recorded and processed; the obtained test results are summarized in Tables 4, Table 5, Table 6, and Table 7.

TABLE 4. Experimental data of tester 1 walking at different step frequencies.
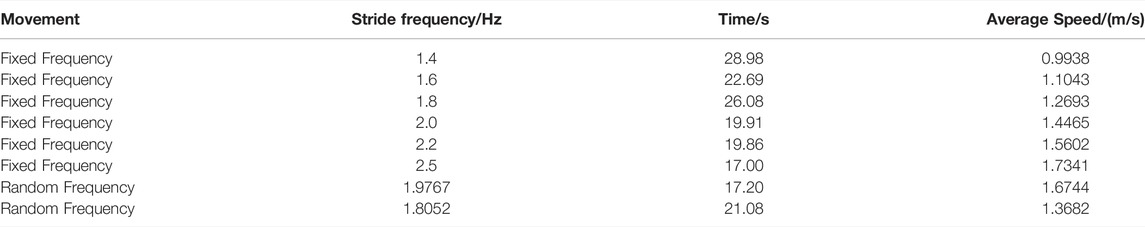
TABLE 5. Experimental data of tester 2 walking at different step frequencies.
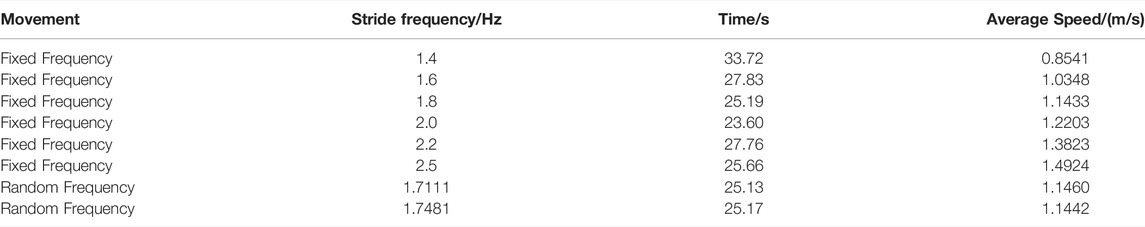
TABLE 6. Experimental data of tester 3 walking at different step frequencies.
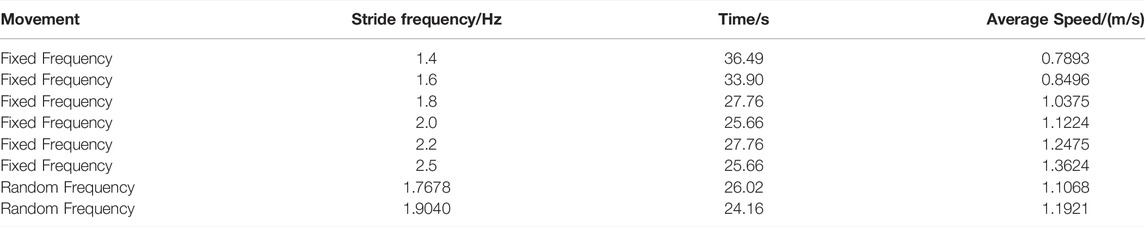
TABLE 7. Experimental data of tester 4 walking at different step frequencies.
From the experimental data given in Tables 4, Table 5, Table 6, and Table 7, it was seen that the walking speeds of four testers were gradually increased with the increase of stride frequency, which was consistent with theorical findings. By calculation, the average stride frequency of four test testers for a total of 8 free walks was 1.8224 Hz, which was consistent with the average stride frequency of 1.82 Hz experimentally obtained for more than 2,000 students in reference [31]. At the same time, average free walking speed of the four testers was calculated to be 1.288 m/s, which was also consistent with the findings of previous studies. Comparing the data from the four groups, it was found that the average walking speed of the two men was greater than that of the two women when walking freely. Step length of men was longer because they had longer legs than women. Therefore, walking speed of men was much greater than women at the same walking frequency since its value was equal to the product of step length and stride frequency.
Multi-Person Walking Test
Selection of the site and time of tests was consistent with single-person walking load test procedure. In addition to the four testers who were evaluated in single-person walking force tests, two additional testers with no movement disorder and different heights and weights were selected for multi-person tests. The physical characteristics of the testers are summarized in Table 8.
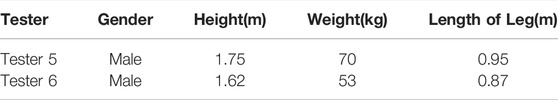
TABLE 8. Physical characteristics of testers.
Unlike walking load test conditions of individual pedestrians, it was necessary to conduct synchronous adaptability training before tests and attach an acceleration sensor on the back of the waist on each tester during walking tests. First of all, two testers were required to walk in a row less than 60 cm from each other because longer intervals could reduce the test to a one-pedestrian walking test. After several tests on the walking conditions of two people standing in a row, the testers walked side by side in two rows again. Finally, tests with 4 and 6 people were performed in the same manner. Walking time and the number of steps of the testers under all conditions were recorded throughout multi-person walking tests, as presented in Table 9.
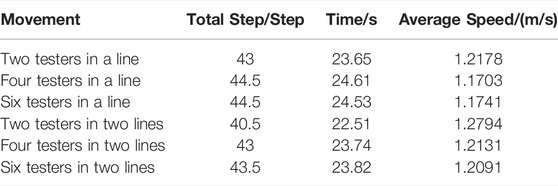
TABLE 9. Experimental data of synchronized multi-person walking.
As summarized in Table 5, Table 6, Table 7, Table 8, and Table 9 both walking time and the number of steps were increased with the increase of the number of testers, no matter they walked in one or two columns, which indicated that walking speed and step length of pedestrians crossing the bridge were decreased by increasing crowd density under normal circumstances. Total walking steps and walking time in the opposite direction were smaller than those for one or two lines, which might be because the testers were far apart before the intersection in the opposite direction without interfering with each other.
Analysis of Test Results
Time History Analysis
Dynamic load factor (DLF) of pedestrian walking load, also known as the first harmonic dynamic load factor, is a basic parameter describing the harmonic amplitude of dynamic load. Dynamic load amplitude was calculated as the product of pedestrian weight and dynamic load factor. To illustrate the effects of stride frequency and measuring position of human body on time history and DLF of pedestrian walking load, time histories of non-dimensional pedestrian walking load
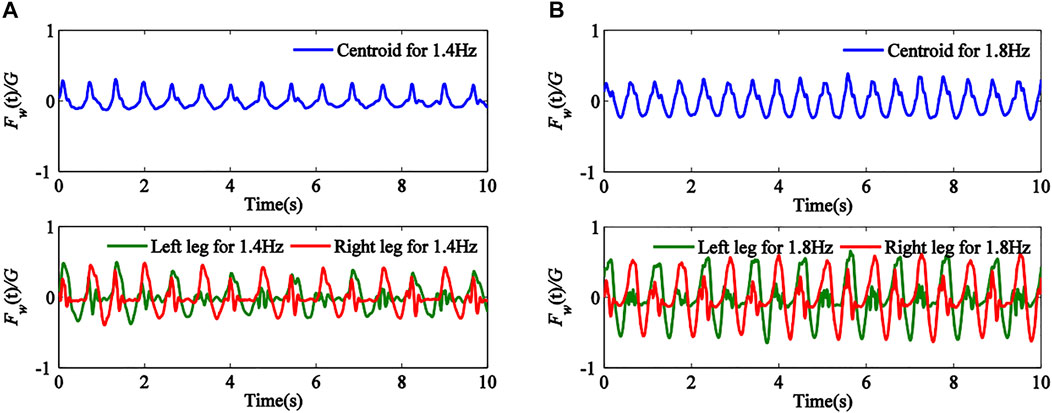
FIGURE 7. Time histories of non-dimensional pedestrian walking loads for different stride frequencies and measuring positions: (A) 1.4Hz; (B) 1.8 Hz.
It was seen from Figure 7 that when measuring position was in centroid, time history showed regular periodic changes, where the period of the time history curve with stride frequency 1.4 Hz was longer than that with stride frequency 1.8 Hz. It was also seen that when measuring position was in left and right legs, the half period of time history curve showed regular periodic changes and the other half showed irregularity. This indicated that the irregular half period of time history denoted one foot off the ground and the regular half period indicated that one foot or two feet touched the ground. In addition, DLF, defined as the amplitude of time history curve of non-dimensional pedestrian walking load, also shown in Figure 7, for stride frequency 1.4 Hz was smaller than that for stride frequency 1.8 Hz. Also, the DLF value obtained for measuring positions of two legs was higher than that with measure position located in centroid. In addition, to illustrate human weight effects on time history and DLF of pedestrian walking load, time histories of non-dimensional pedestrian walking load
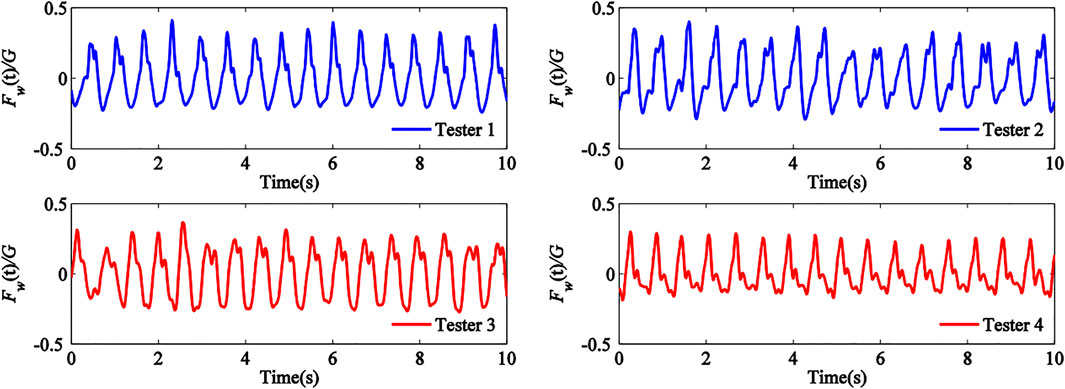
FIGURE 8. Time histories of non-dimensional pedestrian walking loads for different testers.
It was seen from Figure 8 that the amplitude of time history curves for the four testers had little differences and the tester with weight of G = 686N had the highest value. This indicated that the amplitude of time history curve was slightly increased by increasing in human weight. Therefore, the effects of human weight in pedestrian walking load model were ignored. Furthermore, to illustrate the effects of multi-person walking on the time history and DLF of pedestrian walking load, time histories of non-dimensional pedestrian walking load
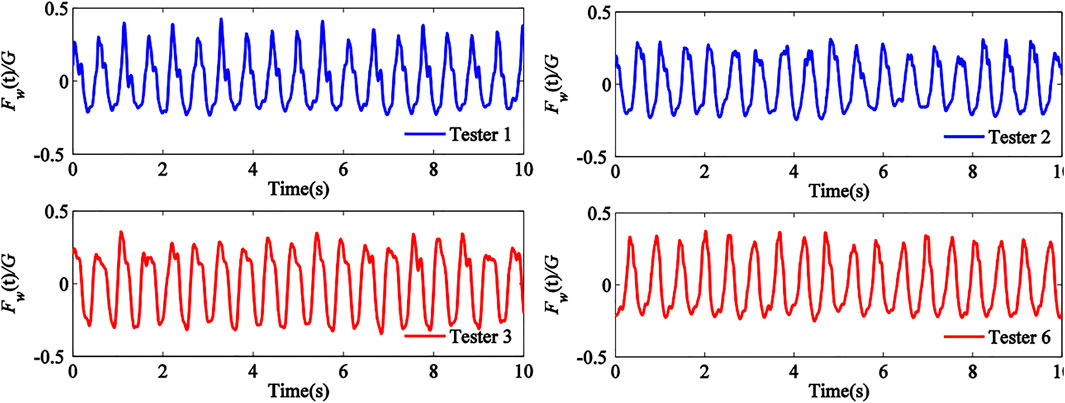
FIGURE 9. Time histories of non-dimensional pedestrian walking loads for multi-person walking.
Power Spectrum Analysis
In order to further investigate the DLF of pedestrian walking loads, power spectra of pedestrian walking loads have been analyzed in this section. To illustrate the effects of stride frequency and measuring position of human body on the power spectra and DLFs of pedestrian walking loads, the power spectrum of pedestrian walking load of tester 1 for centroid, left leg and right leg measuring positions were plotted for stride frequencies
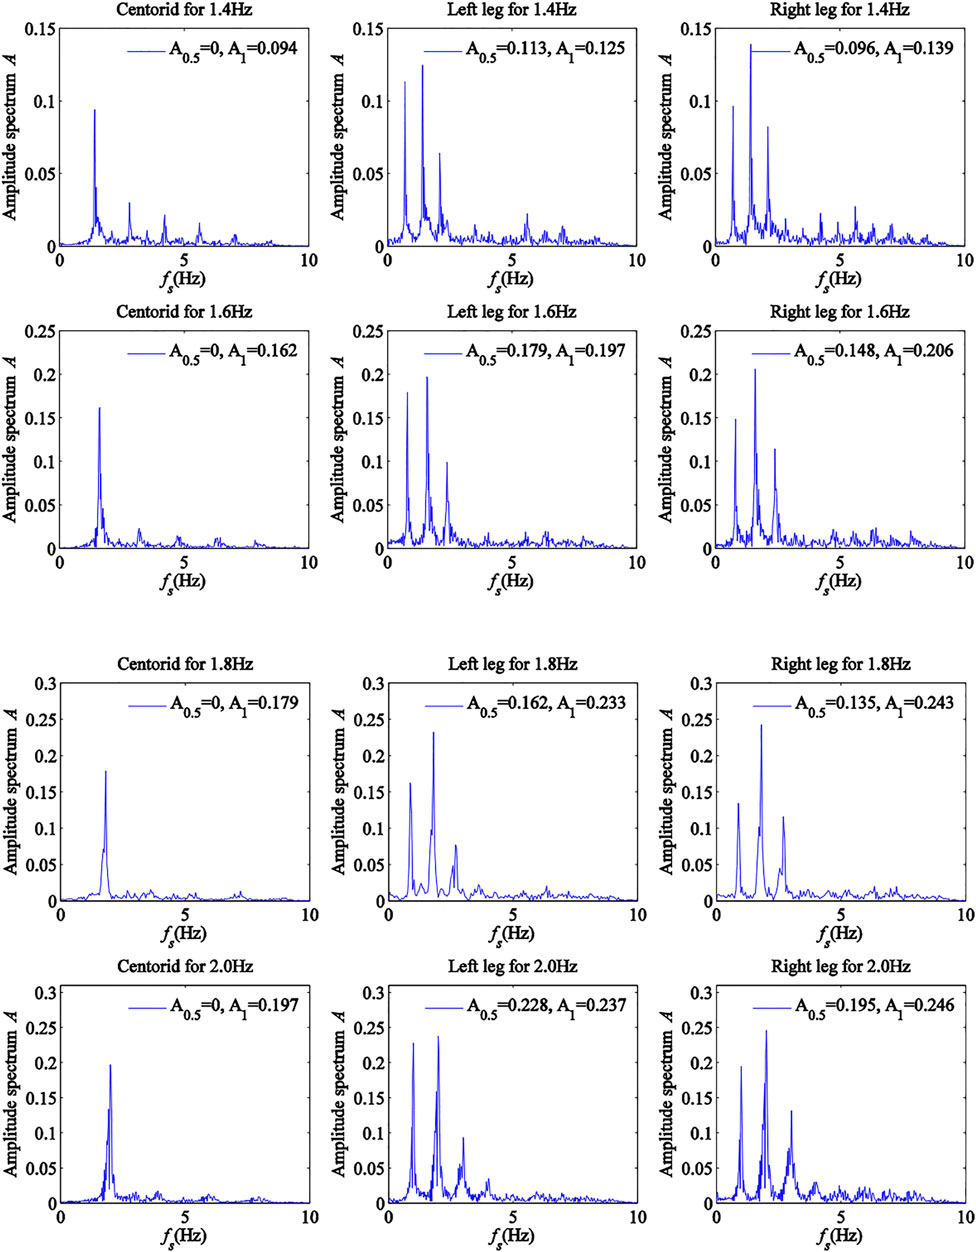
FIGURE 10. Power spectra of pedestrian walking loads for stride frequencies fw of 1.4 and 2.0 Hz
To illustrate the effects of multi-person walking on the power spectra and DLFs of pedestrian walking loads, the power spectra of pedestrian walking loads were plotted for testers 1 and 2 walking in a line and side by side (Figure 11), testers 1, 2, 3 and 6 walking in two lines (Figure 12A), testers 1, 2, 3 and 6 walking in one line (Figure 12B), testers 1–6 walking in two lines (Figure 13A), and testers 1–6 walking in one line (Figure 13B). Figure 11, Figure 12, and Figure 13 showed that when pedestrians walked together, the frequency segment near the stride frequency presented a peak in corresponding power spectrum curve, which was called DLF
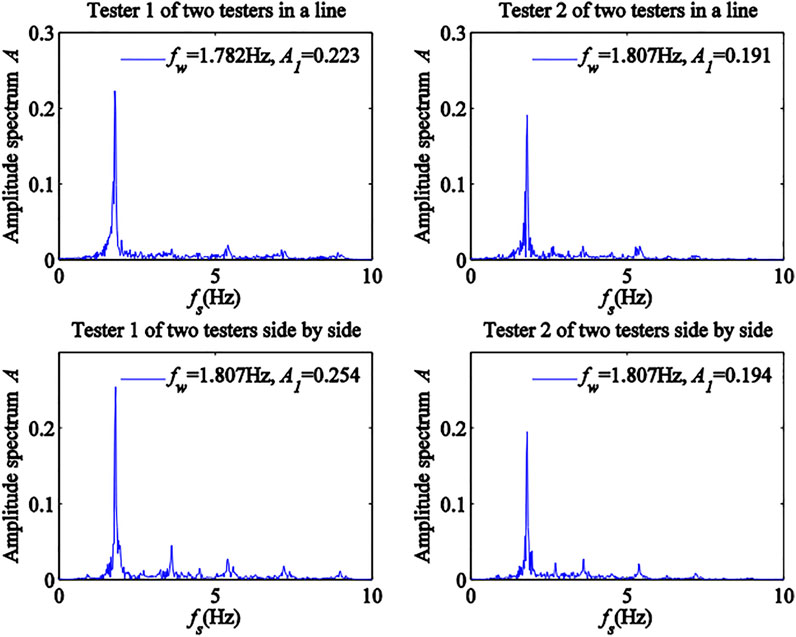
FIGURE 11. Power spectra of pedestrian walking loads for two testers in a line or side by side.
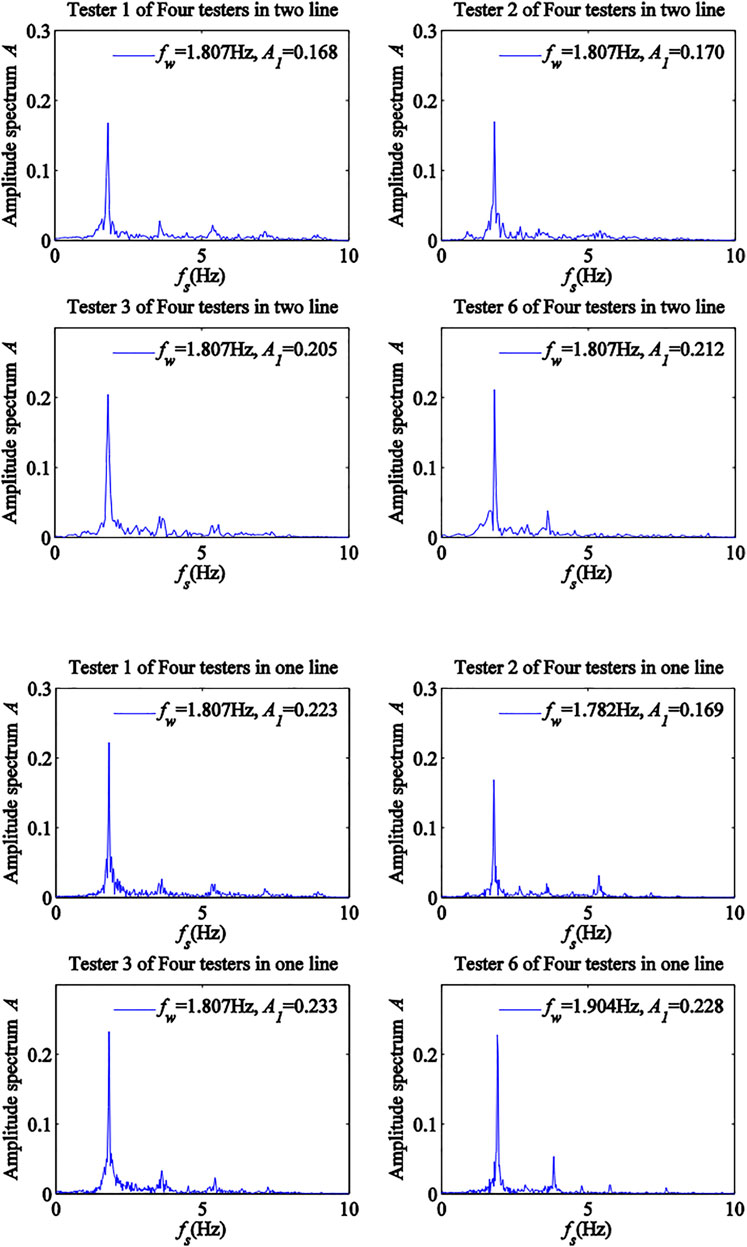
FIGURE 12. Power spectra of pedestrian walking loads for four testers.
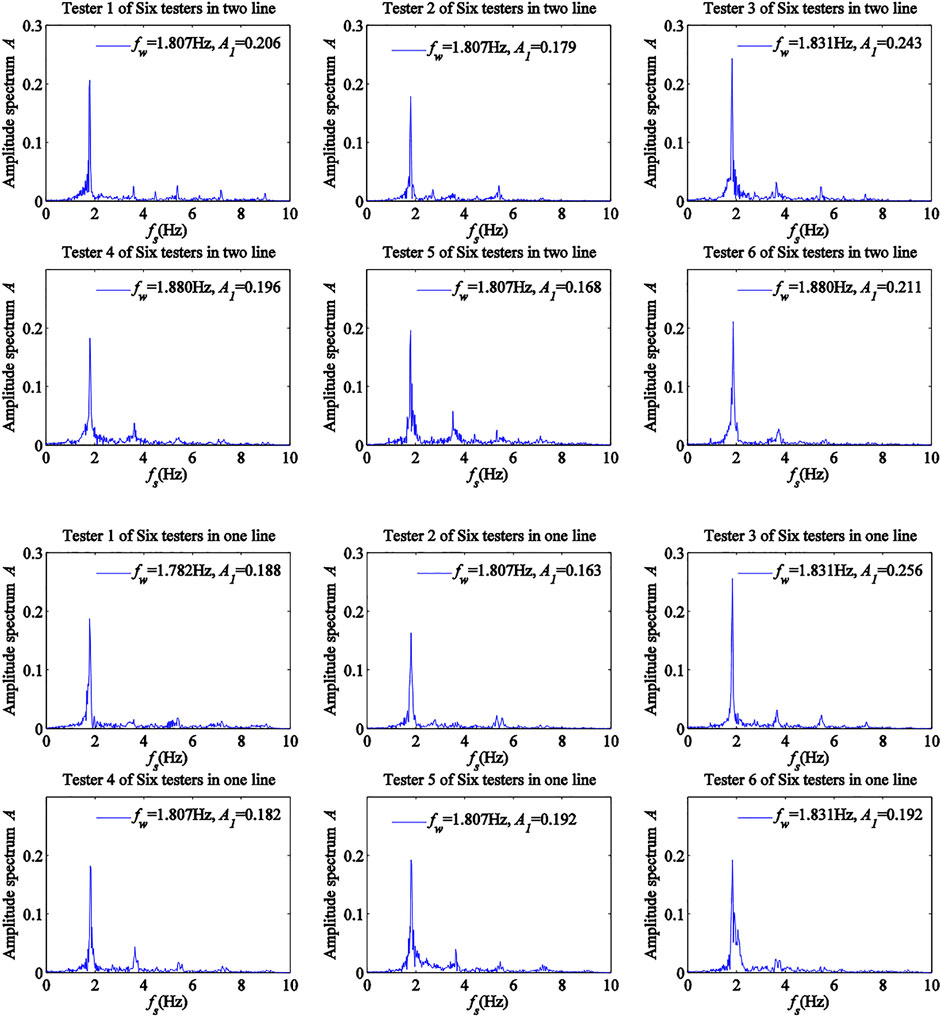
FIGURE 13. Power spectra of pedestrian walking loads for six testers.
Design Equations of Pedestrian Walking Loads and Crowd Loads
According to test results, design equations of pedestrian walking loads and crowd loads were built up in this section.
The Eq. 6 can be used to build the design equation of pedestrian walking loads, which can be given by
where A1 is the DLF of pedestrian walking loads obtained from power spectrum analysis. In order to obtain the equation of the DLF of pedestrian walking loads A1, variations of A1 obtained under various test conditions in the experiment with the stride frequency fw are shown in Figure 14. In addition, the upper and lower bounds of the relation between A1 and fw were obtained by linear fitting analysis, which is also shown in Figure 14. For safety reason, the upper bounds were applied to derive the equation of the DLF of pedestrian walking loads as:
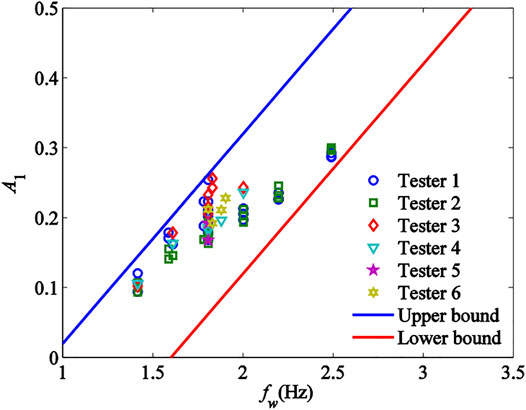
FIGURE 14. The relation between A1 and fw as well as corresponding fitting curve.
Furthermore, Eq. 8 could be used to derive the design equation of crowd loads, which was stated as
The stride frequency fw and DLF A1 of the crowd loads were obtained from the mid-value of test data. According to Figure 11, Figure 12, and Figure 13, the mid-value of the stride frequency fw of crowd loads test was 1.843Hz, and that of the DLF A1 of crowd loads test was 0.211. Therefore, the design equation of crowd loads was expressed as
Conclusion
This paper presented an experimental investigation on pedestrian walking and crowd loads for Yanluo foot bridge. A theoretical study was carried out using a bipedal walking force model. In the experimental investigation, both single-person and multi-person walking tests were performed and corresponding stride frequencies and dynamic load factors were evaluated, respectively. The average frequency and walking speed of four testers in individual pedestrian tests for eight free walks were consistent with those reported in previous studies, which verified the reliability of the tests. In addition, design equations of pedestrian walking loads and crowd loads was obtained by the analysis of time-histories and power spectra. It was found that there was a similarity in variation rules of walking forces of different testers, but due to differences in walking habits and human characteristic parameters (such as height, weight, leg length, etc.), walking force could change. It was also found that dynamic load factor was increased by increasing stride frequency, and the mid-value of the stride frequency fw of crowd loads test was 1.843 Hz, and that of the DLF A1 of crowd loads test was 0.211.
The experiments described in this paper provide a standardized load model for the response of bridge structure under impact load or periodic load, provided test results for the formulation of regulations related to structural vibrations in China and provided technical support for vibration displacement monitoring of long-span structure and composite structures.
Data Availability Statement
The original contributions presented in the study are included in the article/supplementary material, further inquiries can be directed to the corresponding author.
Ethics Statement
Ethical review and approval was not required for the study on human participants in accordance with the local legislation and institutional requirements. The patients/participants provided their written informed consent to participate in this study. Written informed consent was obtained from the individual(s) for the publication of any potentially identifiable images or data included in this article.
Author Contributions
DD, XZ, and HL contributed to conception and design of the study. ZW organized the database. DD performed the statistical analysis. DD and XZ wrote the first draft of the manuscript. DD, ZW, XZ, and HL wrote sections of the manuscript. All authors contributed to manuscript revision, read, and approved the submitted version.
Conflict of Interest
Author DD is employed by China Construction Steel Engineering Co., Ltd., Author ZW is employed by China Railway Guangzhou Group Co., Ltd., Author XZ is employed by Dongguan Hongchuan Intelligent Logistics Development Co., Ltd.
The remaining authors declare that the research was conducted in the absence of any commercial or financial relationships that could be construed as a potential conflict of interest.
Publisher’s Note
All claims expressed in this article are solely those of the authors and do not necessarily represent those of their affiliated organizations, or those of the publisher, the editors and the reviewers. Any product that may be evaluated in this article, or claim that may be made by its manufacturer, is not guaranteed or endorsed by the publisher.
Acknowledgments
The authors would like to thank all participants who provided support for our approach.
References
Ailisto, H. J., Lindholm, M., Mantyjarvi, J., and Mäkelä, S. M. (2005). “Identifying People from Gait Pattern with Accelerometers,” in Proceedings of SPIE - The International Society for Optical Engineering, 28 March 2005 (Orlando, Florida, United States: SPIE), 5779. doi:10.1117/12.603331
Bachus, K. N., Demarco, A. L., Judd, K. T., Horwitz, D. S., and Brodke, D. S. (2006). Measuring Contact Area, Force, and Pressure for Bioengineering Applications: Using Fuji Film and TekScan Systems. Med. Eng. Phys. 28 (5), 483–488. doi:10.1016/j.medengphy.2005.07.022
Bocian, M., Macdonald, J. H. G., and Burn, J. F. (2013). Biomechanically Inspired Modeling of Pedestrian-Induced Vertical Self-Excited Forces. J. Bridge Eng. 18, 1336–1346. doi:10.1061/(asce)be.1943-5592.0000490
Chen, J., Han, Z., and Brownjhn, J. (2019). Human Shaker Modal Testing Technology via Wearable Inertial Measurement Units. J. Vib. Eng. 32 (4), 644–652. doi:10.16385/j.cnki.issn.1004-4523.201904.011
Chen, Z., Chen, Z., Zhang, X., Huang, S., and Chen, Z. (2022). Dynamic Response and Vibration Reduction of Steel Truss Corridor Pedestrian Bridge Under Pedestrian Load. Front. Mater., 31.
Ebrahimpour, A., Hamam, A., Sack, R. L., and Patten, W. N. (1996). Measuring and Modeling Dynamic Loads Imposed by Moving Crowds. J. Struct. Eng. 122 (12), 1468–1474. doi:10.1061/(asce)0733-9445(1996)122:12(1468)
Gao, Y. A., Yang, Q. S., and Dong, Y. (2018). A Three-Dimensional Pedestrian-Structure Interaction Model for General Applications. Int. J. Struct. Stable. Dyn. 18 (9), 1850107. doi:10.1142/s0219455418501079
Geyer, H., Seyfarth, A., and Blickhan, R. (2006). Compliant Leg Behaviour Explains Basic Dynamics of Walking and Running. Proc. R. Soc. B 273 (1603), 2861–2867. doi:10.1098/rspb.2006.3637
Gurney, J. K., Kersting, U. G., and Rosenbaum, D. (2008). Between-Day Reliability of Repeated Plantar Pressure Distribution Measurements in a Normal Population. Gait Posture 27 (4), 706–709. doi:10.1016/j.gaitpost.2007.07.002
Han, H. X., Zhou, D., and Ji, T. (2017). Mechanical Parameters of Standing Body and Applications in Human-Structure Interaction. Int. J. Appl. Mech. 9 (2), 1750021. doi:10.1142/s1758825117500211
Han, H., Zhou, D., Ji, T., and Zhang, J. (2021). Modelling of Lateral Forces Generated by Pedestrians Walking Across Footbridges. Appl. Math. Model. 89, 1775–1791. doi:10.1016/j.apm.2020.08.081
Harper, F. C., Warlow, W. J., and Clarke, B. L. (1961). The Forces Applied to the Floor by the Foot in Walking, London: Department of Scientific and Industrial Research. Building Research Station, 495–497.
Jones, C. A., Reynolds, P., and Pavic, A. (2011). Vibration Serviceability of Stadia Structures Subjected to Dynamic Crowd Loads: A Literature Review. J. Sound Vib. 330 (8), 1531–1566. doi:10.1016/j.jsv.2010.10.032
Khan, A. M., Young-Koo Lee, Y. K., Lee, S. Y., and Tae-Seong, K. (2010). A Triaxial Accelerometer-Based Physical-Activity Recognition via Augmented-Signal Features and a Hierarchical Recognizer. IEEE Trans. Inf. Technol. Biomed. 14 (5), 1166–1172. doi:10.1109/titb.2010.2051955
Lu, H., Liu, L., Liu, A., Pi, Y.-L., Bradford, M. A., and Huang, Y. (2020). Effects of Movement and Rotation of Supports on Nonlinear Instability of Fixed Shallow Arches. Thin-Walled Struct. 155, 106909. doi:10.1016/j.tws.2020.106909
Lu, H., Zhou, J., Sahmani, S., and Safaei, B. (2021a). Nonlinear Stability of Axially Compressed Couple Stress-Based Composite Micropanels Reinforced with Random Checkerboard Nanofillers. Phys. Scr. 96 (12), 125703. doi:10.1088/1402-4896/ac1d7f
Lu, H., Zhou, J., Yang, Z., Liu, A., and Zhu, J. (2021b). Nonlinear Buckling of Fixed Functionally Graded Material Arches Under a Locally Uniformly Distributed Radial Load. Front. Mater. 8, 310. doi:10.3389/fmats.2021.731627
Mohammed, A., and Pavic, A. (2021). Human-Structure Dynamic Interaction Between Building Floors and Walking Occupants in Vertical Direction. Mech. Syst. Signal Process. 147, 107036. doi:10.1016/j.ymssp.2020.107036
Paweł, H., Roberto, P., Rafaela, S., and Silva, F. (2021). Vertical Vibrations of Footbridges Due to Group Loading: Effect of Pedestrian-Structure Interaction. Appl. Sci. 11, 1–16. doi:10.3390/app11041355
Qin, J. W., Law, S. S., Yang, Q. S., and Yang, N. (2013). Pedestrian-Bridge Dynamic Interaction, Including Human Participation. J. Sound Vib. 332 (4), 1107–1124. doi:10.1016/j.jsv.2012.09.021
Racic, V., Pavic, A., and Brownjohn, J. M. W. (2009). Experimental Identification and Analytical Modelling of Human Walking Forces: Literature Review. J. Sound Vib. 326, 1–49. doi:10.1016/j.jsv.2009.04.020
Venuti, F., and Bruno, L. (2009). Crowd-Structure Interaction in Lively Footbridges Under Synchronous Lateral Excitation: A Literature Review. Phys. Life Rev. 6, 176–206. doi:10.1016/j.plrev.2009.07.001
Wang, Q., Song, Z. G., and Wang, Z. Y. (2019). Tests for Measuring Vertical Pedestrian Loads Using Acceleration Sensors. J. Vib. Shock 38 (1), 215–220. doi:10.13465/j.cnki.jvs.2019.01.031
Wei, L., and Griffin, M. J. (1998). Mathematical Models for the Apparent Mass of the Seated Human Body Exposed to Vertical Vibration. J. Sound Vib. 212, 855–874. doi:10.1006/jsvi.1997.1473
Xiong, J., Chen, J., and Caprani, C. (2021). Spectral Analysis of Human-Structure Interaction During Crowd Jumping. Appl. Math. Model. 89, 610–626. doi:10.1016/j.apm.2020.07.030
Yang, Z., Liu, A., Lai, S.-K., Safaei, B., Lv, J., Huang, Y., et al. (2022a). Thermally Induced Instability on Asymmetric Buckling Analysis of Pinned-Fixed FG-GPLRC Arches. Eng. Struct. 250, 113243. doi:10.1016/j.engstruct.2021.113243
Yang, Z., Lu, H., Sahmani, S., and Safaei, B. (2021b). Isogeometric Couple Stress Continuum-Based Linear and Nonlinear Flexural Responses of Functionally Graded Composite Microplates with Variable Thickness. Archives Civ. Mech. Eng. 21 (3), 1–19. doi:10.1007/s43452-021-00264-w
Yang, Z., Safaei, B., Sahmani, S., and Zhang, Y. (2022b). A Couple-Stress-Based Moving Kriging Meshfree Shell Model for Axial Postbuckling Analysis of Random Checkerboard Composite Cylindrical Microshells. Thin-Walled Struct. 170, 108631. doi:10.1016/j.tws.2021.108631
Yang, Z., Wu, D., Yang, J., Lai, S. K., Lv, J., Liu, A., et al. (2021a). Dynamic Buckling of Rotationally Restrained FG Porous Arches Reinforced with Graphene Nanoplatelets Under a Uniform Step Load. Thin-Walled Struct. 166, 08103. doi:10.1016/j.tws.2021.108103
Zhu, Q. K., Chen, K., Du, Y. F., Jach, M., and Drodza, M. (2018). A Pedestrian up and Down Stairs Biodynamic Model Based on the Measured Data. J. Vib. Shock 37 (4), 233–239. doi:10.1155/2020/8015465
Keywords: bipedal walking force model, pedestrian walking load, wireless sensor, stride frequency, dynamic load factor
Citation: Deng D, Wang Z, Zhang X and Lin H (2022) Experimental Investigation on Pedestrian Walking Load in Steel Footbridges. Front. Mater. 9:922545. doi: 10.3389/fmats.2022.922545
Received: 18 April 2022; Accepted: 16 May 2022;
Published: 16 June 2022.
Edited by:
Zhicheng Yang, Zhongkai University of Agriculture and Engineering, ChinaCopyright © 2022 Deng, Wang, Zhang and Lin. This is an open-access article distributed under the terms of the Creative Commons Attribution License (CC BY). The use, distribution or reproduction in other forums is permitted, provided the original author(s) and the copyright owner(s) are credited and that the original publication in this journal is cited, in accordance with accepted academic practice. No use, distribution or reproduction is permitted which does not comply with these terms.
*Correspondence: Deyuan Deng, ZGV5dWFuX2RlbmdAMTYzLmNvbQ==