 Ran Liu
 Dalei Zhang
94% of researchers rate our articles as excellent or good
Learn more about the work of our research integrity team to safeguard the quality of each article we publish.
Find out more
ORIGINAL RESEARCH article
Front. Mater., 09 May 2022
Sec. Structural Materials
Volume 9 - 2022 | https://doi.org/10.3389/fmats.2022.910319
This article is part of the Research TopicInnovators in Structural Materials – Alloys and MetalsView all 8 articles
To prolong the service time of ship and seawater piping systems, titanium alloys have a series of excellent properties, such as their low density, high strength, and seawater corrosion resistance, and they have become the main material used in ocean engineering. A welded joint is a nonuniform structure that is composed of a weld seam (WM), base metal (BM), and heat-affected zone (HAZ). When an alloy is used, it is easier to form galvanic corrosion, stress corrosion, and pitting corrosion in a weld joint than when a single metal is used. Therefore, corrosion failure often occurs at a welded joint. In this article, classical electrochemical testing (EIS and Tafel) and surface morphology analysis (SEM and EDS) were used to study a welded joint, and microarray electrode (WBE) testing was added for the first time to study a welded joint. The corrosion behavior of each zone of a TA2 titanium alloy welded joint in flowing seawater and the overall corrosion tendency after coupling of three zones were studied at the macro- and submicroscales. Macroscopic results show that the HAZ and BM of a titanium alloy welded joint have better corrosion resistance in seawater. The microarray electrode shows that the WM is the main anode that accelerates corrosion, and at high flow rate, the electrode will change into the cathode. In conclusion, the data in this article provide a theoretical basis for the corrosion failure mechanism of TA2 welded joints.
Marine environments and the service conditions of marine engineering equipment are extremely harsh (Cheng et al., 2017). Therefore, the materials that are needed in seawater pipelines, ships, seawater desalination, and other marine fields need to have extremely excellent performance (Liu et al., 2016). Titanium alloys have low density and high specific strength resistance (Pang and Blackwood, 2016). Therefore, they are widely used in marine and ocean engineering environments (Cao et al., 2021). Titanium alloys are a kind of metal that has strong corrosion resistance and easy passivation (Pang and Blackwood, 2016; Song et al., 2020; Pan et al., 2021). However, in some environments that contain aggressive ions, a TiO2 passivation film on a surface can often be damaged (Chuvil'deev et al., 2021). As a result, the passivation film loses its protection of the alloy matrix, and this also leads to corrosion of the titanium alloy (Chen and Zhang, 2016).
Because of the presence of a weld zone (Zhu et al., 2016; Qi et al., 2018; Luo et al., 2021), welding heat input has a certain influence on the base metal zone, which is transformed into a heat-affected zone (Zhu et al., 2020). The presence of heat input may change the internal structure to make it easier for a passivation film to be produced. At the same time, it can also increase the internal defects of the alloy and increase the corrosion tendency of the alloy (Rahimi et al., 2018). Also, because of the potential difference between each area of the welded joint, there will be local corrosion. This is called galvanic corrosion (Gnanavel et al., 2022). The corrosion potential of titanium alloys is very large, and thus, the corrosion potential of the weld zone may be lower than that of the pure TA2 titanium alloy because other alloying elements have been added. Therefore, the TA2 titanium alloy may act as a cathode to mitigate corrosion (Auwal et al., 2018). Also, because of the presence of residual height and defects in the weld area, the flow state of the welded joint will change when a corrosive medium flows over the surface (Huo et al., 2017; Lyu et al., 2017; Cheng et al., 2020; Kim et al., 2021). Thus, the transmission mode and efficiency of the corrosive medium are affected, and the initiation and development of the corrosion process are indirectly changed. Hence, studying the scour corrosion behavior of seawater pipes that have a TA2 titanium alloy welded joint and clarifying the electrochemical mechanism, process, and law of the corrosion process are greatly significant (Lin et al., 2020).
At present, the corrosion of the TA2 titanium alloy has been studied by scholars at home and abroad (Ferdinandov et al., 2018). They often use techniques such as ac impedance technology and potentiodynamic polarization technology (Tang et al., 2015; Aica and Ftae, 2021; Shao et al., 2021) to study the corrosion tendency of titanium alloys or dissimilar metal joints in seawater (Blasco-Tamarit et al., 2007; Astarita et al., 2015; Luo et al., 2021). For example, Khayatan et al (2017) used erosion testing machines and investigated the properties of industrial grade pure titanium under erosion conditions. The results showed that a passivation film formed on the surface of the titanium alloy, and this significantly reduced the corrosion rate. Moreover, the gain effect of special erosion was significantly greater than that of a pure corrosion rate. Cheng (2017) studied the corrosion behavior of a TiAl alloy in seawater after tribological and electrochemical coupling. The results showed that the TiAl alloy had excellent resistance to friction corrosion. Dong et al (2019) studied the electrochemical performance of a Ti–Al–Nb–Zr alloy passivation film in the deep seawater environment. Finally, the corrosion performance of shallow seawater environments was one order of magnitude higher than that of deep seawater environments. Also, the passivation film surface that forms in deep seawater environments has more facial structure and high ion permeability, and thus, the corrosion tendency is more serious. At present, the corrosion behavior of each zone in a welded joint of the TA2 titanium alloy and characterization of the overall corrosion tendency of the welded joint after coupling of each zone are relatively rare. In this article, EIS, Tafel, and WBE testing methods were used, and surface morphology (SEM) and energy spectrum analysis (EDS) were combined; these techniques were used to study a TA2 welded joint. The macro- and micromechanisms of corrosion resistance of the TA2 welded joint in each area of a seawater pipeline were characterized (Lin et al., 2020), and changes in galvanic corrosion in the seawater scouring process after coupling of each zone were studied (Atapour et al., 2011). The results provide some theoretical basis for the corrosion leakage tendency of a titanium alloy welding joint in a seawater pipeline.
Domestic TA2 titanium alloy pipe material (BM) was used. The TIG WM and HAZ materials were analyzed. Pure titanium wire was used. Table 1 shows the chemical composition of a TA2 welded joint. The components were determined using a direct reading spectrometer (Model Q4 Tasman 130). The welded joint of the TA2 titanium alloy was cut into square samples with dimensions of 10 mm × 10 mm × 5 mm using electric spark cutting technology. Before use, the samples were polished using 240, 400, 600, 800, 1000, and 1500 molybdenum wet sandpaper (Dz et al., 2020). After the surface was smooth and the scratches were in the same direction, the experiment was only then carried out after the samples were cleaned with deionized water and anhydrous ethanol and then blown dry. Figure 1 shows the metallographic structure of three sections of the TA2 titanium alloy after it was polished and etched. Metallographic equipment used was a Zeiss electron microscope (Axio Observer A1M), and the magnification of the metallography was 200 μm. As seen in the figure, the parent material area was a fine equiaxed α crystal. The microstructure of the HAZ was similar to that of the WM, but martensite and weistensite were not found. In addition, the microstructure was both serrated α crystal, but a large serrated α crystal appears in the welded microstructure.

TABLE 1. Percentage of atoms in different areas of welded joints.
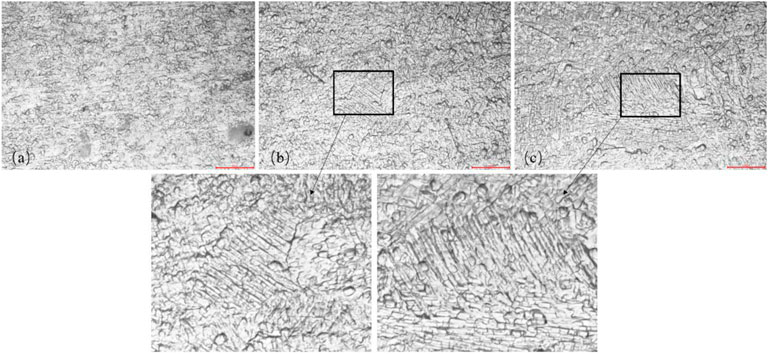
FIGURE 1. Metallographic diagram of three zones: (A) BM, (B) HAZ, and (C) WM.
The submicroscopic electrode material was an electrode wire that was cut from three sections (BM, HAZ, and WM) of the TA2 titanium alloy welding joint. The diameter of the wire was 1 mm, and its length was 50 mm. The electrode wire was processed using an EDM machine, was cleaned with anhydrous ethanol and acetone, and polished using a wet sandpaper. After welding electrode wires with row wires, they were arranged according to the actual area ratio of the welded joints, and they were installed into a predesigned card slot. The spacing between each electrode wire was 0.7 mm. The specific arrangement is shown in Figure 2A. The fixed electrode wire slot is shown in Figure 2B. The wire was put into a mold and encapsulated in an epoxy resin. This was left standing for 24 h to wait for the resin to cure, and then sandpaper was used to grind the sample until each electrode wire was exposed to the surface, which was smooth and without scratches. Then, the conductivity of each electrode wire was tested. After no error into the they are stored in a drying box after the test is errorless for later testing drying box for retention.
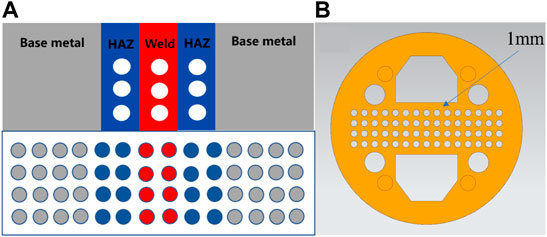
FIGURE 2. (A) is the arrangement of electrode wire, and (B) is the clamping groove of electrode wire.
The corrosive medium used in this article was artificial seawater that was configured according to the Brojevich scheme. Table 2 shows the specific configuration composition.

TABLE 2. Composition of artificial seawater.
A unidirectional flow circuit erosion test device was used in the experiment (Zt et al., 2020) (Figure 3). The experimental test area is shown in Figure 4. The device can be used to simulate the scouring process of water flow in the process of seawater pipeline transportation, and an inlet valve and return valve can be used to adjust and control the velocity of the seawater between 0 and 7 m/s. Artificial seawater was stored in a solution tank and pumped into the test device through a centrifugal pump. The solution flow leads to an overall rise in temperature in the pipeline; thus, cooling coils were put in the solution box, and cold water was introduced to control the temperature that was required during the experiment, as shown in Figure 3.
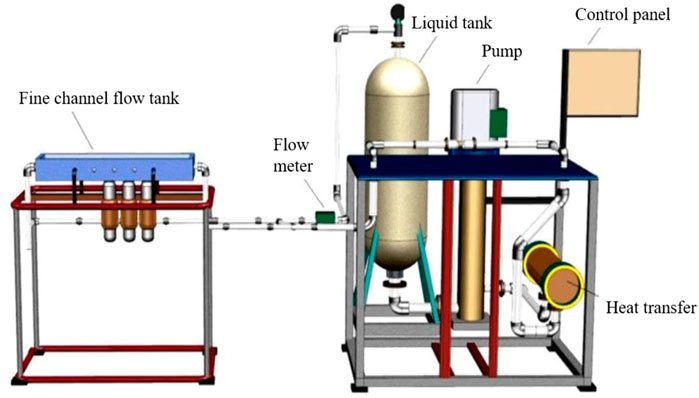
FIGURE 3. Overall schematic diagram of the scouring test device.
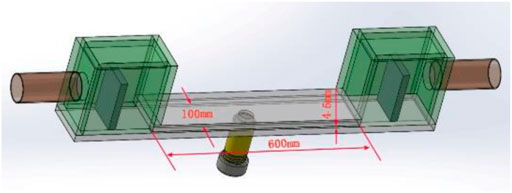
FIGURE 4. Experimental test channel.
A traditional three-electrode system (Figure 5A) was used in the macroscopic electrochemical experiments. A working electrode (WE) was required to test the three zones of the titanium alloy welded joint. The counter electrode (CE) was a platinum wire, and the reference electrode (RE) was high-purity zinc. The potential of the reference electrode was relatively stable in artificial seawater, and its relative standard hydrogen potential was −0.762 V. The system was sealed with an epoxy resin, fixed with a PVC pipe, and loaded into the scouring test circuit. The open circuit potential (OCP), ac impedance (EIS), and electrodynamic potential (Tafel) were monitored at different flow rates and times. The test pressure was the standard atmospheric pressure, and the control temperature was 40 ± 1°C after the system was cooled using a cooling plate. Experimental equipment used was a Solartron 1287 + 1255B electrochemical workstation. The frequency range of the AC impedance spectrum measurement was 100 kHz–0.01 Hz, and the amplitude of the AC excitation signal was 5 mV. The potentiodynamic polarization scanning rate was 1 mV/s, and the scanning range was −0.5∼+1.6 V vs. OCP.
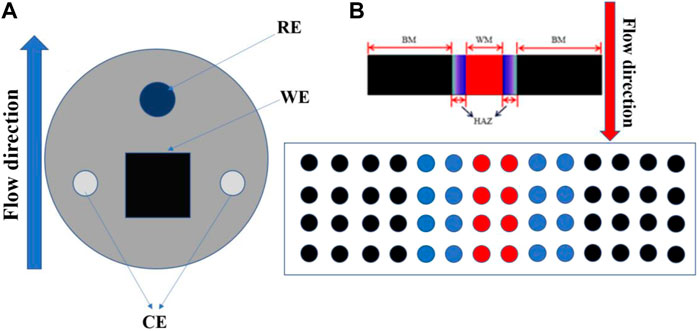
FIGURE 5. (A) is the macroscopic electrode arrangement, and (B) is the submicroscopic array electrode arrangement.
In the submicroscopic experiment, electrode array testing was used to measure the corrosion current and corrosion potential of each electrode wire after coupling the three regions of the TA2 titanium alloy welding joint (Zhang et al., 2022). The specific test layout is shown in Figure 5B. Before the galvanic current and potential of the microelectrode array at the submicroscopic scale were tested, all of the electrodes were disconnected for about 30 min until a stable open circuit potential was obtained. The local corrosion potential of the microelectrode was recorded on the basis of the corrosion potential of the reference electrode, which was pure zinc. It was necessary to short-circuit other working electrodes when testing the galvanic current. The electrode wire was connected to the measuring plate of a PXI-4071 digital multimeter and PXI-4022 effective current protection amplifier in the established sequence to separate the electrode wire from the electrode array and to measure the galvanic current between the electrode wire and the electrode array. All of the remaining electrode wire ports were connected in turn for the galvanic current test. To measure the potential, the electrodes were disconnected to measure with the other electrodes and to measure the electrode potential relative to the reference electrode. WBE test equipment used was an NI PXI microarray electrode test system.
At the end of the scouring experiment, the electrodes were removed from the scouring circuit. The surface of the working electrode was cleaned with ultrapure water. The surface microstructure of the sample was observed using SEM, and the composition of the surface products was analyzed using EDS to better explain the corrosion process and mechanism. SEM equipment used was a Zeiss Gemini300.
Figure 7 shows the impedance fitting equivalent electrical model. In the equivalent circuit diagram (Figure 7A), R1 represents the solution resistance, and CPE1 represents the double-layer capacitance between the TA2 welded joint and the medium. R2 represents the total resistance at the electrode interface. In the equivalent circuit diagram (Figure 7B), R1 is the solution resistance, and CPE is the product film capacitance. R2 represents the resistance of the product film layer, and in this article, it represents the resistance of the passivation film. CPE2 represents the capacitance of the double electric layer at the electrode/solution interface, and R3 represents the charge transfer resistance (Zhang et al., 2022). Therefore, R is the total resistance, and the total resistance R that is fitted by a single film layer is the resistance value of R2. In the double-layer equivalent circuit diagram, the total resistance was represented by the sum of the passivation film resistance and charge transfer resistance, which can be expressed as R = R2+R3 (Zhang et al., 2022). The fitted circuit diagram is an ideal model, but there are some differences between the actual test conditions and the ideal model. Therefore, the phase angle element CPE is used to replace the capacitance element.
Figure 6 shows the impedance changes and Bode diagram of the BM area of the TA2 titanium alloy welded joint at different times during 12 h of scouring in artificial seawater with three flow rates. It may discover that the Bode diagram of BM is one time constant in the 1-h test under three flow rates, so the equivalent circuit diagram shown in Figure 7A is adopted. Other moments are represented by two time constants, and for these, the equivalent circuit diagram shown in Figure 7B is adopted. For 3–12 h, the capacitive arc is in the high-frequency region, and the capacitive arc is in the middle- and low- frequency regions. The capacitive arc in the high-frequency region represents a charge transfer process, and the capacitive arc in the middle- and low-frequency regions represents the passivation film formation process. Moreover, the reactance arc gradually increased with prolonged time, and the amplitude did not change. This indicates that the corrosion process of the TA2 titanium alloy BM region did not change and always showed electrochemical control. This is because flowing seawater speeds up the transfer speed of corrosion media (such as O2 and Cl−) as the scouring process progresses, and this speeds up the reaction on the surface of the TA2 titanium alloy. The gradual formation of the TiO2 passivation film prevents the release of ions that form in the matrix to the solution and also prevents direct contact between the corrosive media in the solution and the matrix. Specifically, bidirectional ion exchange between the matrix and solution is obstructed. Supplementary Tables S1–S3 show the impedance spectral fitting data of the BM in the 12-h scouring process with 1.85 m/s, 3 m/s, and 6 m/s flow rates of artificial seawater. At these three flow rates, the impedance value R shows an overall increasing trend with prolonged time; there is a higher resistance value at a low flow rate of 1.85 m/s, and the overall minimum impedance value is at a high flow rate of 6 m/s. The reason for this is that at a high flow rate, the shear force of flowing seawater also increases with an increase in the medium transfer speed, and this has a stripping effect on the surface passivation film. The impedance value reaches a maximum at 8 h when 3 m/s of flowing seawater was used for the scouring process; it decreases at 12 h because of spalling of the passivation film, which is caused by shear force, and this reduces the corrosion resistance of the BM zone. However, because of the strong self-healing ability of the titanium alloy passivation film, the O2 transfer speed is fast in flowing seawater, and a TiO2 passivation film forms quickly to protect the BM matrix and improve the impedance value of the BM.
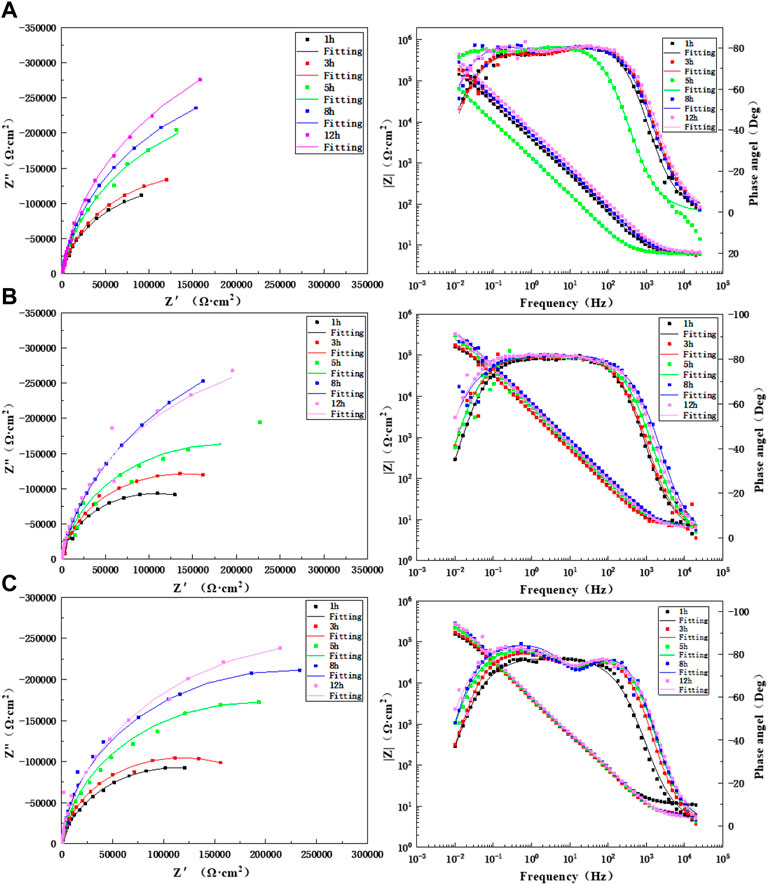
FIGURE 6. Impedance changes of BM during 12 h of scouring in artificial seawater: (A) 1.85 m/s, (B) 3 m/s, and (C) 6 m/s.
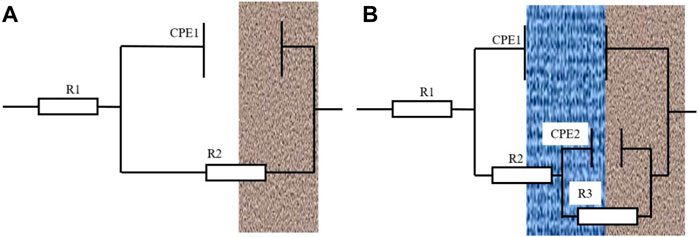
FIGURE 7. (A) is the equivalent circuit diagram fitted with a time constant, and (B) is the equivalent circuit diagram fitted with two time constants.
Figure 8 shows the changes in the electrochemical impedance in the HAZ with prolonged time when the TA2 titanium alloy welded joint was flushed for 12 h at three flow rates. The Bode diagrams show two time constants for the three flow rates, and thus, the equivalent circuit diagram (Figure 7B) was used for the fitting. As seen from the figure, the HAZ undergoes a charge transfer process in the high-frequency zone and a passivation film formation process in the low-frequency zone during flushing for 12 h at three flow rates. There was no change in the capacitive-reactance arc, and this indicates that the corrosion mechanism of the HAZ under the action of seawater erosion did not change. Also, it was still controlled by the electrochemical process. The HAZ capacitive-reactance arc increases gradually with prolonged time at three flow rates. It shows good corrosion resistance with respect to seawater. Supplementary Tables S4–S6 show the fitted data of the HAZ during 12 h of scouring in seawater with three flow rates. As seen, the HAZ has the highest impedance value at 1.85 m/s, which is up to six orders of magnitude, indicating that the HAZ is very sensitive to changes in the flow rate. The passivation film has the best tendency at 1.85 m/s, followed by that at 6 m/s. However, the impedance is the lowest at 3 m/s, and there is little difference in the impedance between 8 and 12 h. This indicates that under a flow rate of 3 m/s for scouring with seawater, the passivation film was relatively compact at about 8 h and had a good protective effect on the matrix.
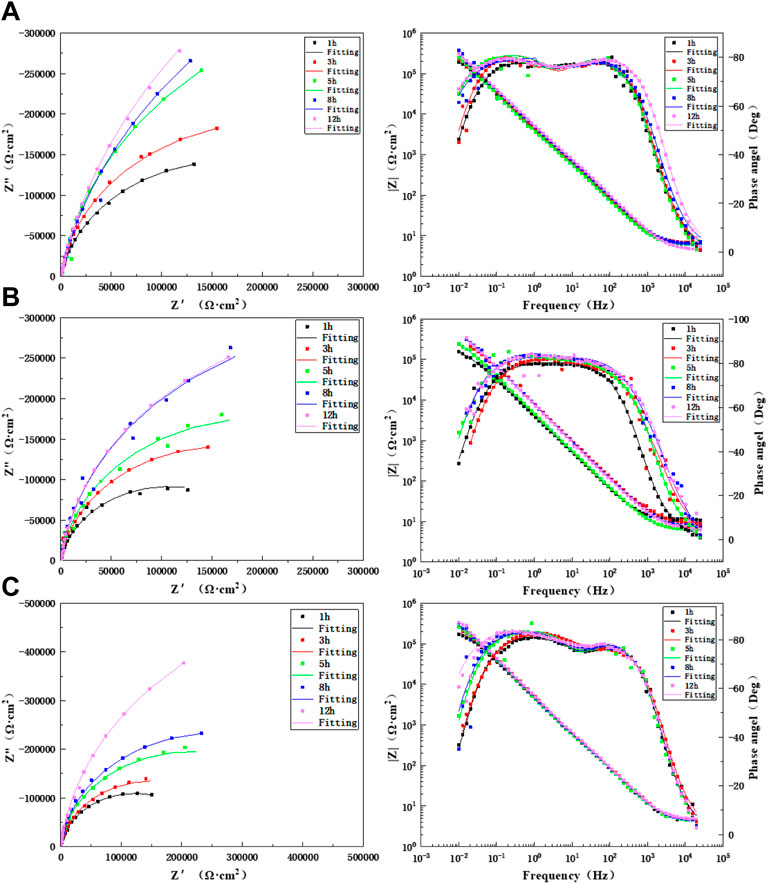
FIGURE 8. Impedance changes in the HAZ during 12 h of scouring in artificial seawater: (A) 1.85 m/s, (B) 3 m/s, and (C) 6 m/s.
Figure 9 shows Nyquist plots and Bode diagrams for different lengths of times for scouring with artificial seawater for 12 h in the WM of the TA2 titanium alloy welded joint at three flow rates of 1.85, 3, and 6 m/s. As found in the Bode diagrams of the three flow rates, the WM always presents a time constant in the early stage during the scouring process with artificial seawater at the three flow rates. Therefore, the equivalent circuit diagram shown in Figure 7A is used for the fitting. All other times are two time constants, and so the equivalent circuit diagram shown in Figure 7B was adopted for the fitting. At the three flow speeds, the WM is always composed of a medium- and low-frequency capacitive arc and a high-frequency capacitive arc with prolonged scouring time; this indicates that it is always controlled by electrochemistry. The capacitive arc increases gradually. The data after the ac impedance fitting are shown in Supplementary Tables S7–S9. The resistance value after the fitting increases gradually with prolonged time and is always greater than 1.85 m/s at 3 and 6 m/s. This is because of the accelerated mass transfer process of the flowing seawater, which accelerates the formation of a passivation film. The impedance values of the WM at flow rates of 3 and 6 m/s are not much different. This is because the high shear force is stronger than the passivation film formation process at high flow rates. However, the titanium alloy has strong ability to repair the passivation film; hence, under the action of a high shear force, a denser passivation film will accumulate on the surface at a later stage of corrosion, and this can better protect the matrix.
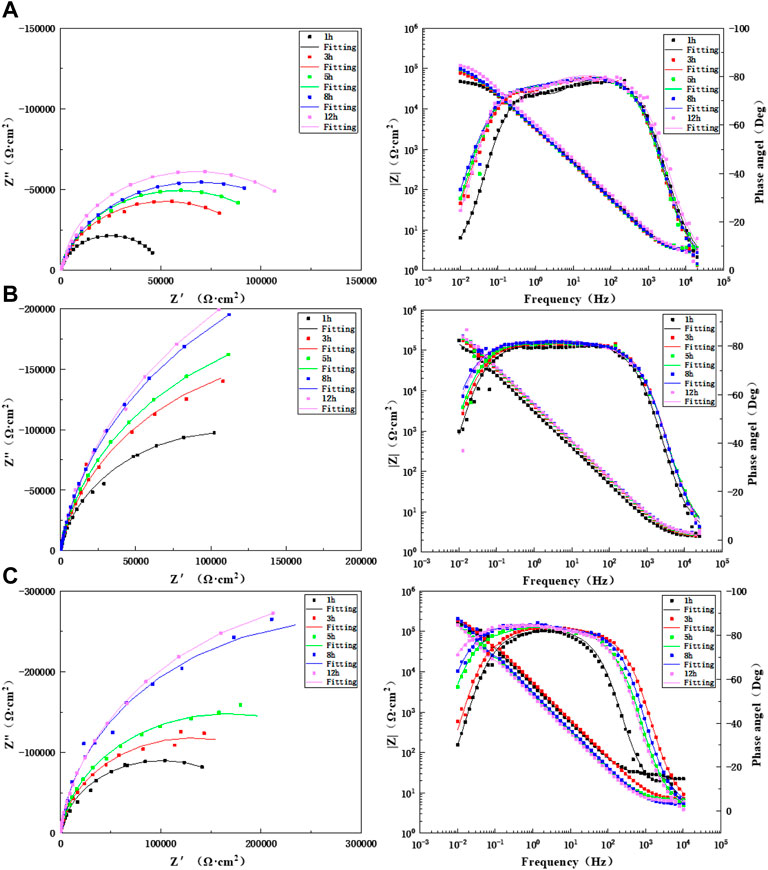
FIGURE 9. Impedance changes of WM during 12 h of scouring in artificial seawater: (A) 1.85 m/s, (B) 3 m/s, and (C) 6 m/s.
Figure 10 shows the comparison of impedance values over time in the scouring process of the BM, HAZ, and WM at different flow rates. The results show that the HAZ always had the highest impedance value and the largest capacitance arc. This indicates that the HAZ has better corrosion resistance. This is because in the welding process, heat input and thermal stress have a certain influence on the BM area and result in the formation of the HAZ. The internal structure of the TA2 alloy changed because of welding, and this makes it easier for a passivation formation reaction to occur. A metallographic structure diagram shows that the grain size in the HAZ becomes larger than that in the BM, and thus, the corrosion resistance improved. WM has a great tendency to corrode, and it increases at the high flow rate of 6 m/s in the later period. The reason is that other alloying elements are added to the welding material during the welding process; also, the WM structure is not uniform, and there are certain welding defects inside the MW. However, because of a uniform loss of components in the early stage and more spalling of the passivation film at a high flow rate, the resistance of WM is greatly improved later.
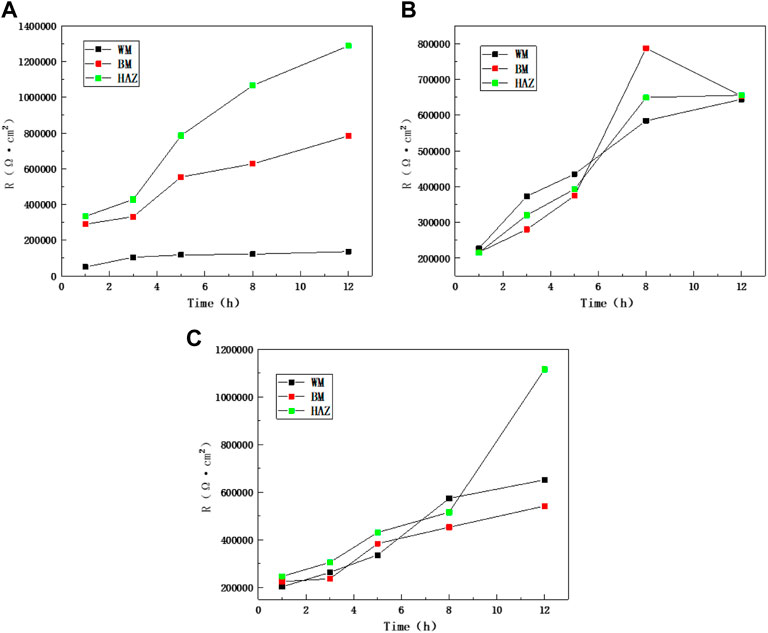
FIGURE 10. Impedance comparison between zones at different flow rates: (A) 1.85 m/s, (B) 3 m/s, and (C) 6 m/s.
Figure 11 shows the polarization curves that were measured after 12 h of scouring at flow rates of 1.85, 3, and 6 m/s for the three zones of the TA2 titanium alloy welded joint. The anodic polarization curves of the BM, HAZ, and WM in the TA2 titanium alloy welded joints have obvious passivation intervals at the three flow rates, and this shows good corrosion resistance. Moreover, the passivation interval of the BM and HAZ is significantly larger than that of the WM. Therefore, it is found that the passivation effect of the HAZ and BM is better than that of the WM. Table 3 shows electrochemical parameters fitted using the polarization curves for three titanium alloy zones at the three flow rates. Among them, the self-corrosion current and corrosion rate in the HAZ are the smallest, and those of the WM are the largest. Although WM has the largest self-corrosion potential, the self-corrosion current is the main factor that is used to judge the corrosion tendency of materials. Hence, it was found that the corrosion resistance of the HAZ is the best in the three zones at the three flow rates followed by that of the BM and WM. The TA2 titanium alloy is a blunt metal, and therefore, the blunt current Ip and blunt potential Epp are generally used to represent the corrosion tendency. When the dimensional blunt current is smaller and the blunt potential is larger, it is more likely that the material will form a passive film. This indicates that when the corrosion resistance is better, the sample is less prone to corrosion. From fitting the electrochemical parameters, it can be seen that the HAZ always showed the smallest dimensional blunt current and the largest blunt potential after 12 h of scouring in artificial seawater with three different flow rates. The blunt current and blunt potential of the BM and HAZ dimension are next to that of the HAZ. However, the WM always shows the largest dimensional blunt current and the smallest blunt potential. Additionally, the dimensional blunt current is one order of magnitude higher. This also means that the HAZ has the best corrosion resistance, and the WM has the most serious corrosion tendency. This is basically the same as the previous experimental conclusion.
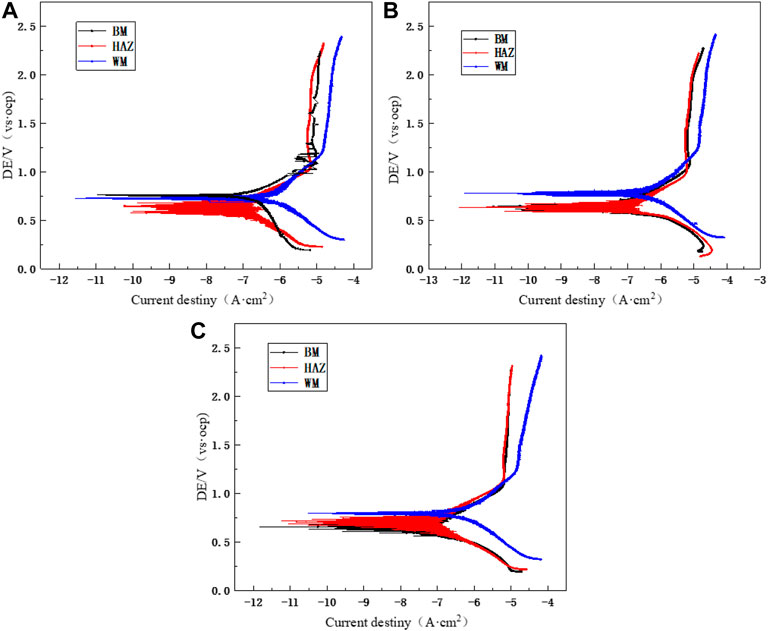
FIGURE 11. Polarization curves of the TA2 titanium alloy welded joint after 12 h of scouring in artificial seawater: (A) 1.85 m/s, (B) 3 m/s, and (C) 6 m/s.
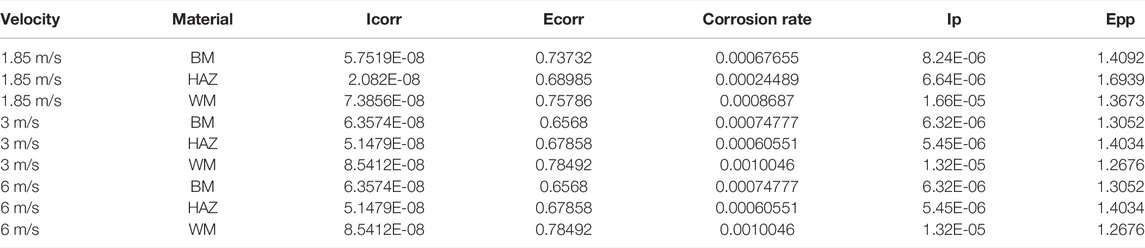
TABLE 3. Fitting data of polarization curves of the three zones after 12 h of scouring by 1.85, 3, and 6 m/s flow rates of seawater.
Figure 12 shows SEM images that were taken of the three zones after they were flushed for 12 h at three flow rates. The surface of the HAZ is relatively smooth at the three flow rates, and there is no obvious erosion pit trace. At a flow rate of 1.85 m/s, the passivation film on the surface is uniform and compact. However, at a flow rate of 3 m/s, the passivation film has scouring corrosion marks that are more serious than at the other two flow rates, for example, the red circle in Figure 12B. In the BM, there were several corrosion pits on the surface for the three flow rates, and this indicates that the passivation film was eroded after the seawater impact. The part circled in Figure 12A shows that the passivation film is corroded after the seawater impact. This shows that the seawater erosion resistance of the BM passivation film is slightly worse than that of the HAZ. As seen from the figure, the WM is corroded more seriously than the BM and HAZ among the three flow rates. There are obvious corrosion pits. There are a few corrosion products that are attached to the surface of the three zones when the three scouring velocities were used, and this indicates that the three zones have relatively high seawater corrosion resistance. EDS elements were measured on the surface after 12 h of scouring in artificial seawater. Table 4 shows the EDS elements on the surface after 12 h of scouring in artificial seawater. EDS scanning results show that the surface products mainly contained C, O, Ti, Na, Cl, Mg, Ca, and other elements. Among them, O and Ti were the majority, and they were mainly in the TiO2 passivation films that formed on the surface in the scouring process. The other trace elements are due to magnesium salt, sodium salt, calcium salt, and other crystalline precipitates in the seawater formula that attached to the surface of each part of the TA2 titanium alloy welded joint.
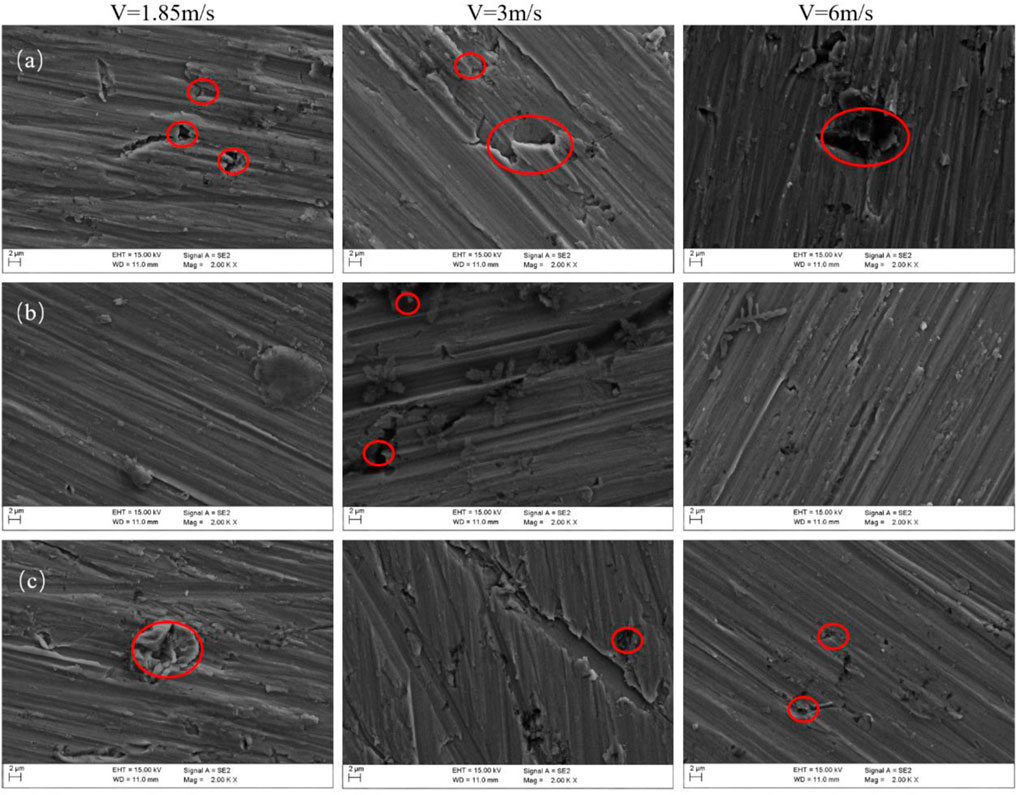
FIGURE 12. Images of surface morphology after scouring at three flow rates: (A) BM, (B) HAZ, and (C) WM.

TABLE 4. EDS test results of the material surface.
Figure 13 shows the WBE test results of the TA2 titanium alloy welded joint after coupling in each zone at a flow rate of 1.85 m/s. The BM and HAZ always exhibit cathode current density, which slows corrosion. The corrosion current density in the HAZ is always lower than that in the BM. The WM always exhibits anodic current density, which accelerates corrosion. The corrosion current density in the BM area increases gradually with prolonged time. The cathode current density in the WM decreased slightly, and the corrosion current density in the HAZ increased. The results show that in the scouring process with 1.85 m/s flow rate of artificial seawater, the HAZ and BM always correspond to the cathode, and WM always corresponds to the anode. In accordance with the aforementioned macroelectrochemical results, the impedance values of the HAZ and the BM at a flow rate of 1.85 m/s are much greater than those of the WM.
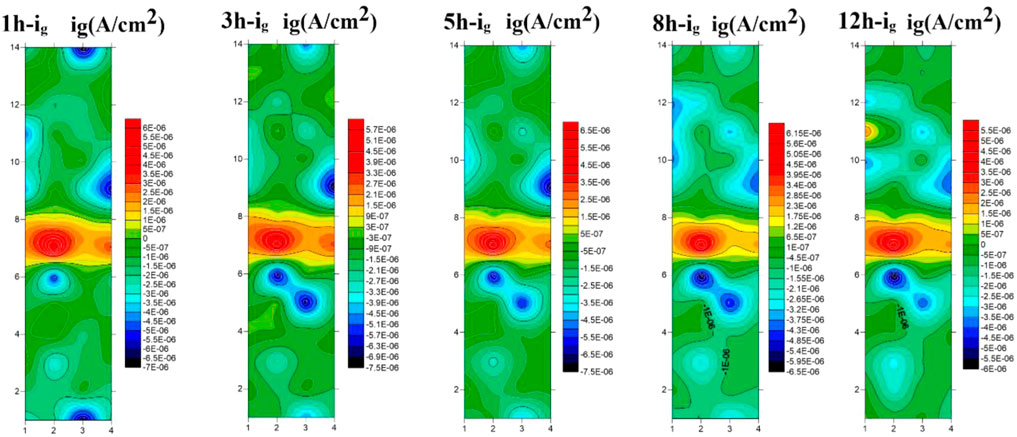
FIGURE 13. WBE test results at 1.85 m/s flushing for 12 h after zonal coupling of welded joints.
Figure 14 shows the WBE corrosion current test results of the TA2 titanium alloy welded joint after coupling in each zone at a flow rate of 3 m/s. The WM always presents the anodic current density during 12 h of scouring, and thus, it always acts as an anode to accelerate corrosion. The BM and HAZ retained cathodic current density throughout the scouring process and thus remained as cathodes to mitigate corrosion. During 1–8 h of the scouring process, the corrosion current density of the BM gradually decreased, and this indicates that the corrosion resistance improved. However, the corrosion current density increased after 12 h of scouring, and this indicates that the corrosion resistance decreased. This is because the surface passivation film flakes and reforms at higher flow rates. However, the current density always increases in the HAZ. The WM always presents anodic current density, and this gradually increases over 1–8 h of scouring and reaches its highest value at 8 h. After 12 h, the corrosion current density decreases.
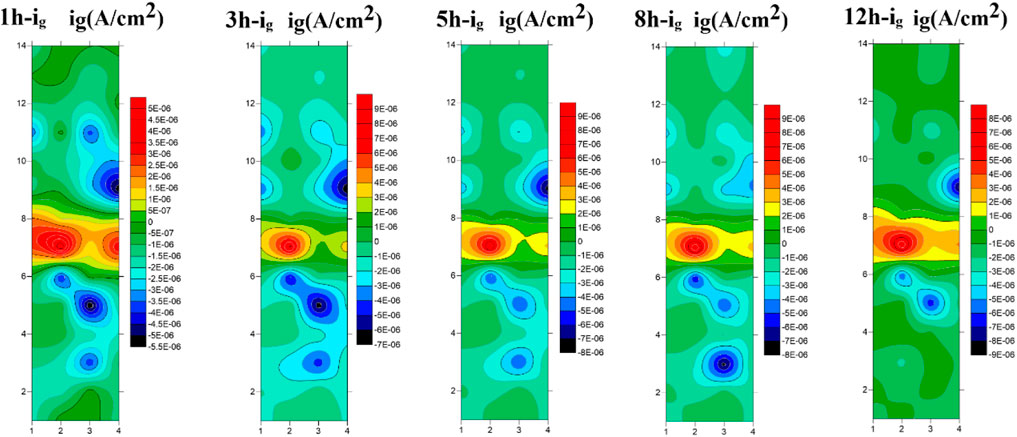
FIGURE 14. WBE test results at 3 m/s flushing for 12 h after zonal coupling of welded joints.
Figure 15 shows the WBE corrosion current test results of the TA2 titanium alloy after coupling in each zone at 6 m/s flow rate. The HAZ always corresponds to the cathode current density with prolonged time, and hence, the HAZ always acts as the cathode, slowing corrosion during the 12-h scouring process. In the first hour of scouring, the BM always corresponds to the cathode current density, whereas the weld area corresponds to the anode current density. However, in the third hour of scouring, some of the electrode wires in the BM changed and exhibited anodic current density, whereas the WM changed and exhibited cathodic current density. The WM corrosion current density changed back to anodic current density after 5 h of scouring. In addition, the corrosion current density of the BM increased slightly at 5 h. During 8–12 h of scouring, the weld always changed and exhibited cathodic current to slow corrosion. Most of the BM changed and exhibited anodic current, accelerating corrosion. The cause of the WM polarity deflection is mainly because of the incompactness of the WM structure in the TA2 titanium alloy welded joint. When scouring is conducted at a high flow rate, a higher shear force produces more Ti2+ on the WM surface and forms a denser passivation film to protect the matrix. But this comes at the cost of more elements and surface film shedding.
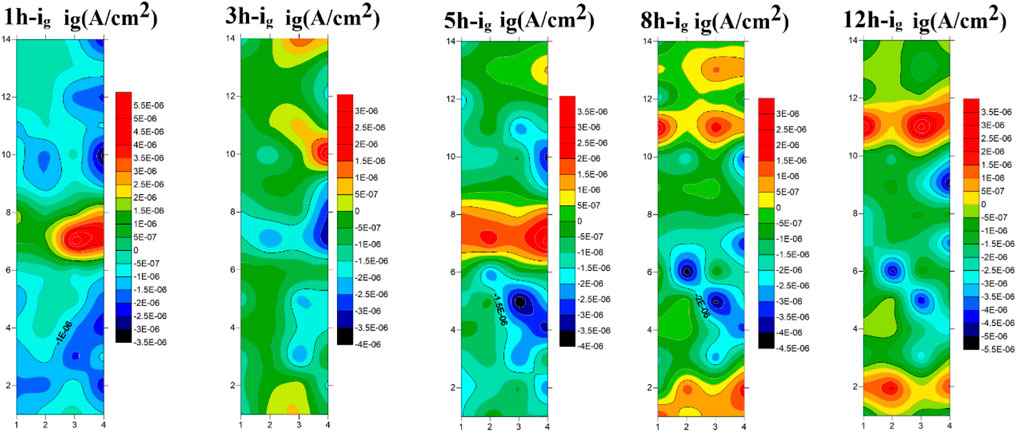
FIGURE 15. WBE test results at 6 m/s flushing for 12 h after zonal coupling of welded joints.
Anodic reaction:
Cathode reaction:
Figure 16 provides a visual depiction of the interface reaction process of erosion–corrosion of the TA2 titanium alloy welded joint in artificial seawater. The corrosion resistance of the titanium alloy is very excellent; the essential reason for this is that it is a passivated metal, easily forms a passivated film, and can hinder the contact and ion exchange reaction between the matrix and solution. In seawater, a passivation film is mainly formed according to the following process: First, the titanium alloy loses electrons and transforms into Ti2+, but Ti2+ is not particularly stable in water. Thus, it reacts with water to become Ti3+, which reacts with the OH− that is produced by the cathode to form Ti(OH)3. However, Ti(OH)3 reaches kinetic equilibrium and generates a dense TiO2 passivation film; this prevents direct contact between an alloy and corrosive medium (Lyc et al., 2021). Also, the passivation film has a strong ability to self-repair. Shear forces are also strong in seawater at higher flow rates. The surface forms a loose passivation film even if it is peeled off by a high shear force. Also, it can be repaired quickly in the rapid transmission of corrosive media such as O2 and Cl−. However, the passivation film that is formed by materials that have a more uniform and dense internal structure has better bonding effect with the matrix. This explains well the reason why the WM area has poor seawater corrosion resistance compared with the BM and HAZ.
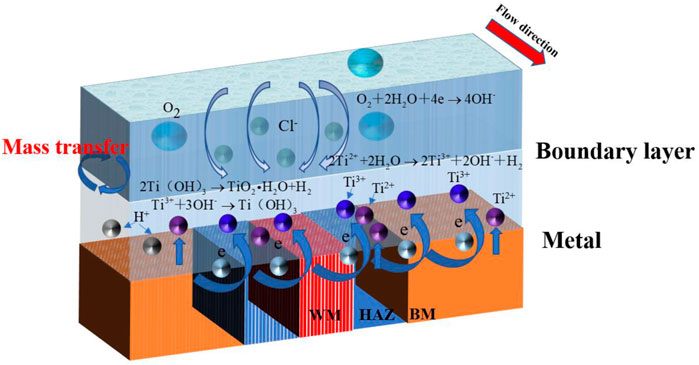
FIGURE 16. TA2 titanium alloy scouring process of the surface reaction.
This article reports the corrosion tendency and development law of the BM, HAZ, and WM of the TA2 welded joints in artificial seawater at flow rates of 1.85, 3, and 6 m/s for 12 h. Finally, it is found that different flow rates of seawater have a significant effect on the welding joint area. There are also obvious differences in corrosion behavior between different regions.
1) In the process of artificial seawater scouring, the impedance values increase obviously with prolonged time. The results show that the corrosion resistance of the three zones gradually improved. The behavior always follows the order: HAZ > BM > WM.
2) There are obvious passivation intervals in the three zones, and this indicates that the passivation film plays a very important role in the corrosion resistance of alloys with the gradual formation of a passivation film during scouring. Moreover, according to SEM and EDS component analyses, TiO2 passivation film mainly exists on the surface.
3) From the array electrode test, it is found that the HAZ always exhibits cathodic current density, which slows corrosion. The WM mainly exhibits anodic current density, which accelerates corrosion. However, at high flow rates, the polarity changes from the anode to the cathode. At the same time, the BM changes to accelerate anodic corrosion.
The original contributions presented in the study are included in the article/Supplementary Material, further inquiries can be directed to the corresponding author.
RL conducted experiments and wrote the manuscript; YL and DZ contributed to checking.
This work was conducted with financial support by the National Natural Science Foundation of China (grant no. 42176209), the Natural Science Foundation of Shandong Province (grant no. ZR2021MD064), and the Fundamental Research Funds for the Central Universities (grant no. 19CX05001A).
The authors declare that the research was conducted in the absence of any commercial or financial relationships that could be construed as a potential conflict of interest.
All claims expressed in this article are solely those of the authors and do not necessarily represent those of their affiliated organizations, or those of the publisher, the editors, and the reviewers. Any product that may be evaluated in this article, or claim that may be made by its manufacturer, is not guaranteed or endorsed by the publisher.
The Supplementary Material for this article can be found online at: https://www.frontiersin.org/articles/10.3389/fmats.2022.910319/full#supplementary-material
Aica, B., and Ftae, F. (2021). Highly Porous Ti as a Bone Substitute: Triboelectrochemical Characterization of Highly Porous Ti against Ti Alloy under Fretting-Corrosion Conditions. Corros. Sci. 49 (4), 1086–1090. doi:10.1016/j.corsci.2021.109696
Astarita, A., Curioni, M., Squillace, A., Zhou, X., Bellucci, F., Thompson, G. E., et al. (2015). Corrosion Behaviour of Stainless Steel-Titanium Alloy Linear Friction Welded Joints: Galvanic Coupling. Mater. Corros. 66 (2), 111–117. doi:10.1002/maco.201307476
Atapour, M., Zahrani, E. M., Shamanian, M., and Fathi, M. H. (2011). “Corrosion Behavior and Galvanic Corrosion Studies of Ti-6Al-4V Alloy GTA Weldment in HC1 Solution,” in TMS 140th Annual Meeting and Exhibition, 707–714. doi:10.1002/9781118062142.ch86
Auwal, S. T., Ramesh, S., and Yusof, F. (2018). A Review on Laser Beam Welding of Titanium Alloys. Int. J. Adv. Manuf. Technol. 97 (1-4), 1071–1098. doi:10.1007/s00170-018-2030-x
Blasco-Tamarit, E., Igual-Muñoz, A., García Antón, J., and García-García, D. (2007). Corrosion Behaviour and Galvanic Coupling of Titanium and Welded Titanium in LiBr Solutions. Corros. Sci. 49 (3), 1000–1026. doi:10.1016/j.corsci.2006.07.007
Cao, Y., Zou, S., and Lin, Q. (2021). Contact Corrosion of Ti-15-3 Titanium Alloy and MT700/603B Joints in Alternate Salt Spray Environment. Aerosp. Mater. Technol. 51 (4), 147–153. doi:10.12044/j.issn.1007-2330.2021.04.019
Chen, J., and Zhang, Q. (2016). Effect of Electrochemical State on Corrosion-Wear Behaviors of TC4 Alloy in Artificial Seawater. Trans. Nonferrous Metals Soc. China 26 (4), 1011–1018. doi:10.1016/s1003-6326(16)64164-x
Cheng, J., Li, F., Zhu, S., Yu, Y., Qiao, Z., and Yang, J. (2017). Electrochemical Corrosion and Tribological Evaluation of TiAl Alloy for Marine Application. Tribol. Int. 115, 483–492. doi:10.1016/j.triboint.2017.06.027
Cheng, J., Li, J., Yu, S., Du, Z., Dong, F., Zhang, J., et al. (2020). Corrosion Behavior of As-Cast Ti-10Mo-6Zr-4Sn-3Nb and Ti-6Al-4V in Hank's Solution: A Comparison Investigation. Metals 11 (1), 11. doi:10.3390/met11010011
Cheng, J. (2017). Electrochemical Corrosion and Tribological Evaluation of TiAl Alloy for Marine Application. Tribol. Int. 234 (5), 1090–1099.
Chuvil'deev, V. N., Nokhrin, A. V., and Andreev, P. V. (2021). Corrosion Resistance of Welded Joints in the Ultrafine-Grained Pseudo-alpha-titanium Ti-5Al-2V Alloy. Phys. Metals Metallogr. 122 (8), 761–767. doi:10.1134/S0031918X21080056
Dong, J. J., Fan, L., and Zhang, H. B. (2019). Electrochemical Performance of Passive Film Formed on Ti–Al–Nb–Zr Alloy in Simulated Deep Sea Environments. Acta Metall. Sin. Engl. Lett. 33 (4), 887–888. doi:10.1007/s40195-019-00958-4
Dz, A., Ly, A., and Zt, B. (2020). Corrosion Behavior of X65 Steel at Different Depths of Pitting Defects under Local Flow Conditions - ScienceDirect. Exp. Therm. Fluid Sci. 45 (5), 178–198. doi:10.1016/j.expthermflusci.2020.110333
Ferdinandov, N. V., Gospodinov, D. D., and Ilieva, M. D. (2018). “Structure and Pitting Corrosion of Ti-6al-4v Alloy and Ti-6al-4v Welds,” in 7th International Conference on Advanced Materials and Systems, 325–330.
Gnanavel, S., Ponnusamy, S., Sivakumar, K., and Priyadarshini, D. (2022). Electrochemical and Biological Behaviour of Near β Titanium Alloy for Biomedical Implant Applications. Proc. Institution Mech. Eng. Part J J. Eng. Tribol. 236 (2), 233–241. doi:10.1177/13506501211039345
Huo, D., Liang, J., and Li, H. (2017). Research Progress on Corrosion of Titanium Alloy. Hot Work. Technol. 46 (20), 29–31. doi:10.24264/icams-2018.VI.7
Khayatan, N., Ghasemi, H. M., and Abedini, M. (2017). Synergistic Erosion-Corrosion Behavior of Commercially Pure Titanium at Various Impingement Angles. Wear 380-381, 154–162. doi:10.1016/j.wear.2017.03.016
Kim, D. J., Kim, S. W., and Lee, J. Y. (2021). Flow-accelerated Corrosion Assessment for SA106 and SA335 Pipes with Elbows and Welds. Nucl. Eng. Technol. (2B), 343–354. doi:10.4028/www.scientific.net/MSF.1035.528
Lin, J. H., Dan, Z. H., and Lu, J. F. (2020). Research Status and Prospect on Marine Corrosion of Titanium Alloys in Deep Ocean Environments. Rare Metal Mater. Eng. 49 (3), 1090–1099. doi:10.1016/j.net.2021.03.026
Liu, Z., Gao, X. H., and Du, L. X. (2016). Corrosion Behaviour of Low-Alloy Steel with Titanium Addition Exposed to Seawater Environment. Int. J. Electrochem. Sci. 11 (8), 6540–6551. doi:10.20964/2016.08.25
Luo, S. J., Yan, P., and Liu, M. (2021). Electrochemical Corrosion Behavior of TA2 Titanium Alloy Welded Joint in Cl- Containing Solutions. Int. J. Electrochem. Sci. 16 (9). doi:10.20964/2021.09.08
Lyc, A., Hyz, A., and Cz, A. (2021). Corrosion Behavior and Characteristics of Passive Films of Laser Powder Bed Fusion Produced Ti–6Al–4V in Dynamic Hank's Solution. Mater. Des. 98 (12), 143–156. doi:10.19515/j.cnki.1003-1545.2020.02.018
Lyu, X., Gao, W., and Xie, J. (2017). Study on Corrosion Resistance of Titanium Alloy Tube in Harsh Downhole Environment. Hot Work. Technol. 46 (6), 58–62. doi:10.1016/j.matdes.2021.109907
Pan, C. Q., Zhong, Q. D., and Yang, J. (2021). Study on Corrosion of TI-6AL-4V Alloy in 3.5% Nacl Solution by Wire Beam Electrode. Surf. Rev. Lett. 28 (06), 131–139. doi:10.1088/2053-1591/abba4f
Pang, J., and Blackwood, D. J. (2016). Corrosion of Titanium Alloys in High Temperature Near Anaerobic Seawater. Corros. Sci. 105 (Apr), 17–24. doi:10.1016/j.corsci.2015.12.011
Qi, K., Li, R., and Wang, G. (2018). Microstructure and Corrosion Properties of Laser-Welded SAF 2507 Super Duplex Stainless Steel Joints. J. Mater. Eng. Perform. 27 (3), 495–498. doi:10.1142/S0218625X21500487
Rahimi, E., Rafsanjani-Abbasi, A., Imani, A., Hosseinpour, S., and Davoodi, A. (2018). Insights into Galvanic Corrosion Behavior of Ti-Cu Dissimilar Joint: Effect of Microstructure and Volta Potential. Mater. (Basel) 11 (10), 1021–1023. doi:10.3390/ma11101820
Shao, H., Lin, Y., Zhong, G., Zhou, J., Xu, Z., Peng, F., et al. (2021). Ti-coated Zn for Improving Corrosion Resistance and Biocompatibility. Mater. Lett. 294 (11), 129810. doi:10.1016/j.matlet.2021.129810
Song, D. J., Niu, L., and Yang, S. L. (2020). Research on Application Technology of Titanium Alloy in Marine Pipeline. Rare Metal Mater. Eng. 49 (3), 1100–1104. doi:10.1007/s11665-018-3833-5
Tang, X., Wang, S., and Qian, L. (2015). Corrosion Behavior of Nickel Base Alloys, Stainless Steel and Titanium Alloy in Supercritical Water Containing Chloride, Phosphate and Oxygen. Chem. Eng. Res. Des. 23 (2), 988–990. doi:10.1016/S1875-5372(12)60014-9
Zhang, D., Liu, R., Xing, S., Yang, L., Wei, E., and Dou, X. (2022). Multiscale Characterization of Seawater Pipe Erosion of B10 Copper–Nickel Alloy Welded Joints. Sci. Rep. 12, 2164. doi:10.1038/s41598-022-06033-w
Zhu, J., Xu, L., and Feng, Z. (2016). Galvanic Corrosion of a Welded Joint in 3Cr Low Alloy Pipeline Steel. Corros. Sci. 134 (7), 157–160. doi:10.1016/j.cherd.2015.05.003
Zhu, Y.-P., Li, C.-Y., and Zhang, L.-Y. (2020). Corrosion Resistance and Antibacterial Activity of Different Zones in TA2 Weldment by TIG Welding. Rare Met. 39 (12), 1449–1456. doi:10.1007/s12598-014-0395-z
Keywords: titanium alloy, welded joint, seawater pipeline, electrochemical, corrosion
Citation: Liu R, Liu Y and Zhang D (2022) Multiscale Characterization of Erosion of TA2 Titanium Alloy Welded Joints. Front. Mater. 9:910319. doi: 10.3389/fmats.2022.910319
Received: 01 April 2022; Accepted: 11 April 2022;
Published: 09 May 2022.
Edited by:
Liang-Yu Chen, Jiangsu University of Science and Technology, ChinaReviewed by:
Linjiang Chai, Chongqing University of Technology, ChinaCopyright © 2022 Liu, Liu and Zhang. This is an open-access article distributed under the terms of the Creative Commons Attribution License (CC BY). The use, distribution or reproduction in other forums is permitted, provided the original author(s) and the copyright owner(s) are credited and that the original publication in this journal is cited, in accordance with accepted academic practice. No use, distribution or reproduction is permitted which does not comply with these terms.
*Correspondence: Dalei Zhang, emhhbmdkYWwyMDA4QDEyNi5jb20=
Disclaimer: All claims expressed in this article are solely those of the authors and do not necessarily represent those of their affiliated organizations, or those of the publisher, the editors and the reviewers. Any product that may be evaluated in this article or claim that may be made by its manufacturer is not guaranteed or endorsed by the publisher.
Research integrity at Frontiers
Learn more about the work of our research integrity team to safeguard the quality of each article we publish.