 Weiqing Chen
 Ahmed Abdulhamid Mahmoud
- College of Petroleum Engineering & Geosciences, King Fahd University of Petroleum & Minerals (KFUPM), Dhahran, Saudi Arabia
Rheological property tuning is one key aspect of oil-well cement, not only affecting the cement slurry placement but also indirectly impacting other cementing properties such as the bonding strength and compressive strength. However, the research is scant on the rheological properties of blending magnesium oxide with class G oil-well cement, despite some studies having been conducted on its impacts on shrinkage compensation, compressive strength, bonding strength, and permeability properties of oil-well cement. This work studies the effects of micro-sized magnesium oxide on the rheological properties and compressive strength of the formulated API Class G oil-well cement slurries. Two types of micro-sized magnesium oxide (50 μm and 100 μm) were used as the mineral admixture at different dosages (3%, 9%). The base formulated slurry sample was incorporated with the silica flour and several commercialized additives such as retarder, fluid loss control agent, and defoamer. A batch of flow tests have been conducted by the use of a digital viscometer at two different temperatures, 25 and 88°C. The compressive strength has also been measured after curing the samples with the same formulation and conditions for 7 days. The variations of the rheological properties (plastic viscosity, yield stress, and gel strength), shear stress–shear rate correlations, and shear-thinning/thickening behavior are impacted by the temperature, the type, and dosage of magnesium oxide. The plastic viscosity of the tested slurries decreased by 27.0% (type II, 9%, 25°C) and 15.1% (type II, 3%, 88°C), respectively, and the yield stress increased by 258.5% (type II, 3%, 88°C) and 53.9% (type II, 9%, 25°C). The gel strength generally increases as the magnesium oxide dosage increases. However, all tested slurry samples show shear-thinning behavior and non-Newtonian characteristics. Among the tested slurry samples, it is found that better rheological performance is achieved when incorporating magnesium oxide with a smaller particle size. On the other side, the specimens of mixed magnesium oxide with a bigger particle size and medium dosage outperform their rival with a smaller particle size in compressive strength.
1 Introduction
Rheological property tuning of oil-well cement (OWC) slurry is an important part of a successful cementing operation not only for oil and gas wells but also for other geo-storage wells such as CO2 sequestration. It impacts the mixability and pumpability of slurry, as well as the flow regime and transportation capability of large particles in the slurry (Guillot, 1990; Mannheimer, 1991; Banfill, 2003; Guillot, 2006; Banfill and Frank, 2006; Murtaza et al., 2019a). It also plays a vital role in determining the quality of the set cement sheath, including cementing interfaces’ bonding strength and compressive strength (Shahriar, 2011; Abbas et al., 2014; Tao et al., 2020). Improved rheology properties will enhance the displacement efficiency of drilling fluid and lower the work loading of the pumping system at the well site (Daccord et al., 2006; Guillot, 2006; Lootens et al., 2004; Shahriar and Nehdi, 2012; Vance, 2014).
On the other hand, magnesium oxide, as a kind of expansive additive material, has been studied and applied in civil construction and geotechnical well cementing for more than 2 decades (Chen et al., 2021; Ghofrani and Plack, 1993). As for oil and gas wells, the intrinsic chemical shrinkage of cement sheath can cause micro-channeling at the cementing interfaces (casing-cement sheath and cement sheath-wellbore). This further degrades the bonding strength and supporting capability of the cement sheath to casing string. Thus, the well integrity will be compromised (Reddy et al., 2009). Using magnesium oxide is one of the promising ways to mitigate this problem (Suhascaryo et al., 2005; Rubiandini et al., 2005). In order to characterize the influence of magnesium oxide on the properties of OWC slurries, some studies have been carried out on the compressive strength (Buntoro, 2001), tensile strength (Jafariesfad et al., 2017), bulk volumetric variation (Mo et al., 2010; Jafariesfad et al., 2017), micromorphology (Mo et al., 2010; José et al., 2020), permeability (Huajun et al., 2013; Ghofrani and Plack, 1993), etc. However, the studies are scant regarding the rheological characteristics of incorporating magnesium oxide particles into oil-well cement slurry. Therefore, this study explores the effects of two types of micro-MgO on the rheological properties of the OWC (Class G) slurry samples. Meanwhile, the compressive strength of these specimens is also investigated to get more insights into the impacts of the incorporation of micro-sized magnesium oxide.
In this study, the base formulation includes several commercial additives (retarder, fluid loss control agent, and defoamer) to simulate a field case. In addition to API Class G OWC and silica flour, two types of micro-sized magnesium oxide (50 μm and 100 μm) are used as the mineral admixture at different dosages (3% and 9%) by weight of cement (BWOC). The slurry samples’ preparation, pre-conditioning, and rheology testing are referenced to the API RP 10B-2 standard (API, 2013). A batch of flow tests have been conducted by the use of a digital viscometer at two different temperatures, 25 and 88°C. The original shear rate, shear stress, and gel strength coupled with time have been measured and stored in the built-in rheology modeling software—ORCADA. Other rheological properties have been calculated by means of the regression method (plastic viscosity, PV; yield stress, YS). The compressive strength measurement has been performed using the scratch test. Through this study, an improved understanding of the impact of micro-magnesium oxide on the rheology and compressive strength of OWC slurries at different temperatures has been derived. It helps in optimizing the usage of magnesium oxide-based expansive additive for geotechnical well constructions.
2 Materials
The cement source material used in this study is a kind of API Class G oil-well cement supplied by a service company. The average particle size of this cement is 69 μm (D50) which is shown in Figure 1. The magnesium oxide material was produced by Huannai Meiye Co., Ltd. (China). Two types of magnesium oxide were selected with different particle sizes as shown in Figure 1. The silica flour and several commercial additives are also incorporated into the OWC base slurry sample to simulate the local field formulation. The silica flour was produced by Adwan Chemical Industries Co., Ltd. Those commercial additives (retarder, fluid loss control agent, defoamer) are supplied by a service company. Deionized water is used to mix the slurry samples. Its original temperature was kept at the room temperature of 25°C.
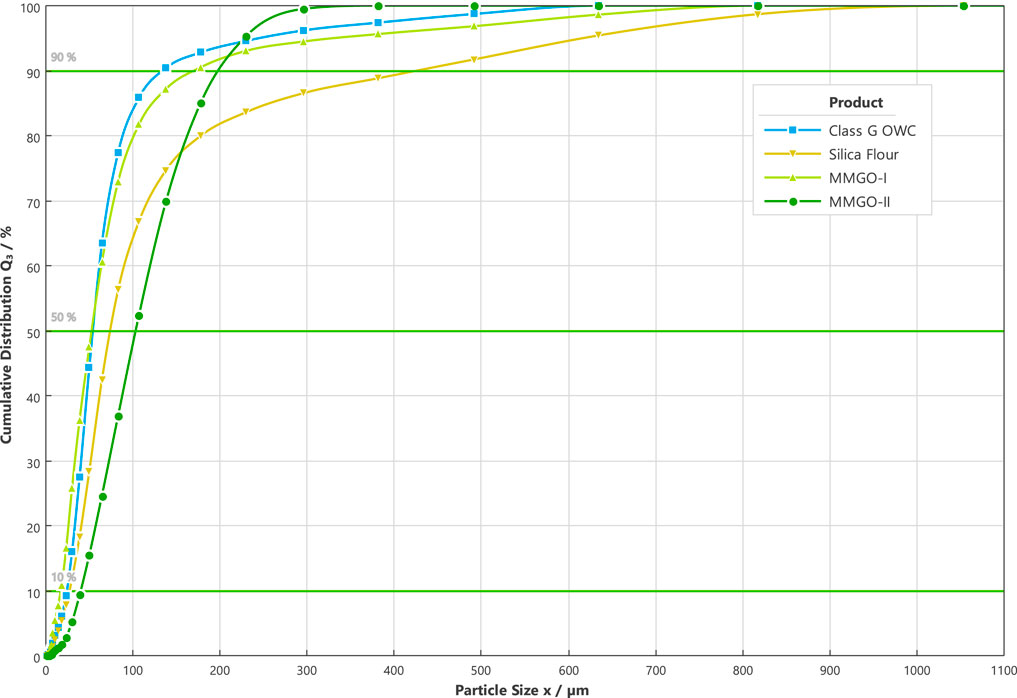
FIGURE 1. Particle size analysis result of source materials (OWC cement, magnesium oxides, and silica flour).
3 Experiment method (including apparatus and procedures)
3.1 Physical and chemical properties of source materials
The particle size analysis on the source materials was completed by using the SYMPATEC DIA particle size analyzer (made in Germany), which was based on the dynamic image analysis method. The detector lens was M5 grade with a measurement range of 2–1,252 μm. The object distance was set at 63 mm. The GRADIS disperser was deployed with a drop height of 50 cm and an outlet width of 1 mm. The vibratory feeder with a 25% feeding rate and a 1 mm gap width was selected. The image scanning rate was 175 Hz with the triggering threshold as the particle optical concentration higher than 0.05%. The particle size of OWC cement, magnesium oxides, and silica flour can be found in Figure 1.
The chemical compositions and oxide contents of the class G OWC, silica flour, and magnesium oxide are analyzed and confirmed by use of XRD (X-ray diffraction) and μXRF (micro X-ray fluorescence) techniques that are essential to proceed with the afterward experiments. The deployed XRD device is the PANalytical Empyrean Series 2 with Cr/Be filtered CuKα radiation, which was made in Netherlands. The generator settings are 40 mA and 45 kV. The scan range is from 4°(2θ) to 70°(2θ). The elemental and oxide content analyses of the source powder materials were conducted with the use of Bruker M4 Tornado Micro-XRF which uses small-spot micro X-ray fluorescence with a high spatial resolution of 25 μm. The detailed chemical composition can be found in Table 1.
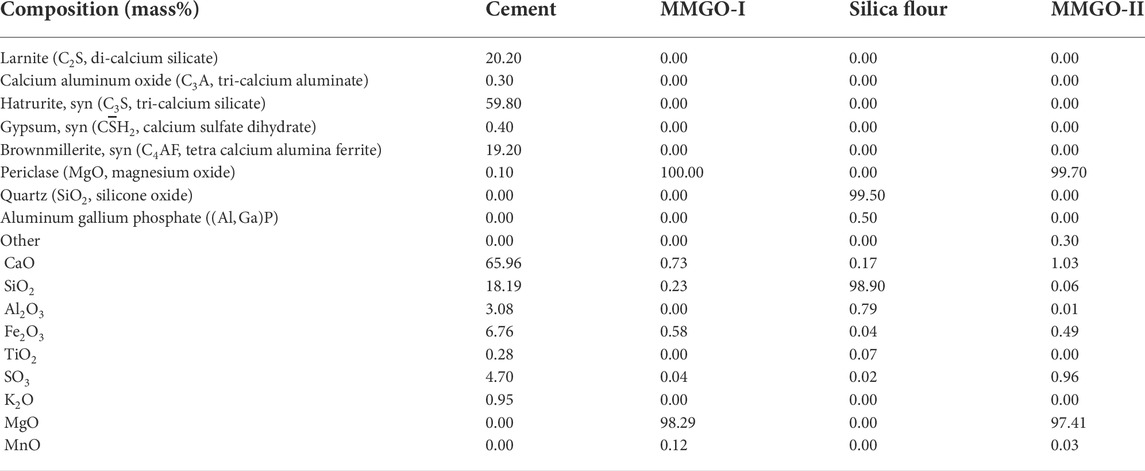
TABLE 1. Chemical composition and oxides contents of cement, magnesium oxides, and silica flour (MMI, micro-magnesium oxide—type I; MMII, micro-magnesium oxide—type II).
In order to reduce the particle size of the source materials to less than 50 μm, which is the upper limit of the ideal particle size for XRD analysis (Pecharsky and Zavalij, 2009), the fit-for-purpose ball miller, Retsch XRD-Mill McCrone, was deployed. This device could preserve the lattice structure and achieve a narrow particle size distribution. As for each source powder material, around 3 mL of powder was milled by the dry grinding method as per the instructions from the manufacturer. After this pretreatment, all the source powder materials have the proper particle size for the afterward XRD analysis (OWC: D90 = 30 μm, silica flour: D90 = 38 μm, MMI: D90 = 30 μm, MMII: D90 = 29 μm).
3.2 Slurry sample preparation
Most of the additives were dosed consistently in all cement slurry samples except the magnesia oxide powder. The W/C ratio (water to cement) is 0.44 for all slurry samples. The control cement slurry sample, shortened as MM-0-25 (MM: micro-sized magnesium oxide, “0”: zero content of magnesium oxide, 25: 25°C for rheology testing), was composed of the class G OWC, the silica flour, and the commercial additives but without the magnesium oxide. The magnesium oxide mixed cement slurry samples consisted of the class G OWC, the silica flour, the commercial additives, and the micro-sized magnesium oxide, which were denoted as MMI-3-25, MMI-9-25, MMII-3-25, MMII-9-25, …, MMII-9-88, respectively. Here, for instance, MMI-3-25 refers to the cement slurry sample dosage with 3% BWOC (“3”) type I micro-sized magnesium oxide with a 50 micron particle size (“MMI”), which was tested under 25°C. A similar naming convention applies to other abbreviated names. The detailed formulations can be found in Table 2.
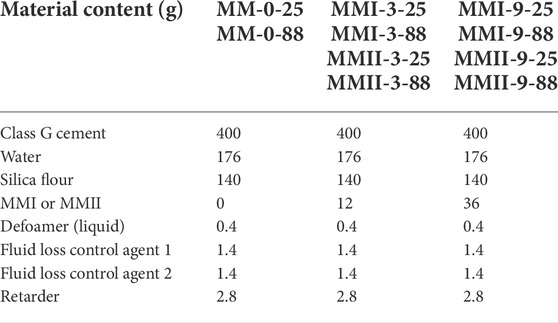
TABLE 2. Formulation of cement slurry samples.
All the experiment procedures, including cement slurry preparation and later on rheology tests, were completed as per the API standard (API, 2013) and some practical procedures. All experiments were repeated three times to ensure consistency and repeatability of the obtained results. For each cement slurry sample preparation, there are three steps namely “weighing,” “mixing,” and “conditioning.”
The first step is to weigh each source material as per the formulation required in Table 2. Since the required slurry volume to be tested with the OFITE 900 Viscometer is around 170 mL as per the physical configuration of the viscometer and the universal heat cup capacity (OFITE, 2018), and also to circumvent the unavoidable consumption of cement slurry samples derived from the residual slurry sticking to the internal surface of the containers (of the OFITE Model 20 Variable Speed Blender and the Grace M7210 atmospheric pressure consistometer), the class G cement was selected as 400 g for all slurry sample preparations. Except for the deionized water and the defoamer, all the other powder source materials were weighed by using the KERN electronic balance (for powder additives weighing, readability: 1 mg, maximum capacity: 2,100 g) and the Oertling GC-42 electronic balance (for weighing of cement powder, silica flour, and deionized water, readability: 0.1 g, maximum capacity: 4,000 g). As for the deionized water weighing, the stainless steel container of the table blender (OFITE Model 20 Blender, 1-liter capacity) was used directly to contain the water in order to minimize the water loss error during the transfer between different containers. Moreover, the fluidic defoamer was metering with the use of a syringe (15 mL capacity) and a needle (1 droplet approximately equivalent to 0.1 g).
The second step is to mix all the source materials into a slurry in terms of certain procedures. The mixing device, duration, and rotation speed are referenced from the API-10B-2 (API, 2013) standard. The OFITE Model 20 Variable Speed Blender can be run at 4,000 rpm and 12,000 rpm, respectively. On account of both solid powder and liquid source materials, the hybrid mixing procedure was used (dry mixing + wet mixing). Dry mixing means mixing different kinds of solid powder directly without introducing any fluid, which applies to the silica flour, the OWC, and the micro-sized magnesium oxide. On the other hand, wet mixing refers to mixing any additives or admixtures into the deionized water or the solution/slurry suspension system, which applies to all the other additives used in this work. All mixing practices were completed at room temperature (25 ± 1°C ) and atmospheric pressure conditions. The detailed mixing steps are depicted as three points, as follows. This mixing procedure was strictly followed for all cement slurry samples.
First, the silica flour and the micro-sized magnesium oxide powder were mixed with the class G OWC manually in a plastic container by using the dry mixing method for about 5 min. Then, the stainless container (with the required mass of deionized water contained) of the table blender was mounted onto the drive base of the blender. The blender was turned on and initialized for several seconds till the shearing speed was lowered to 4,000 rpm. Two droplets of defoamer were incorporated with the syringe needle at first. Then, all the additives were introduced into the water solution/suspension as sequentially as fluid loss control agents and retarders. To avoid the splash of fluid suspension during the high-shear stirring process, the opening of the blender container should be covered as much as possible. Meanwhile, each of these additives’ mixing should be done at 4,000 rpm shear rate within 10 s duration to make them thoroughly dispersed in the fluidic suspension. Third, the cement solid admixture was introduced into the suspension (water and chemical additives) by the use of a table blender within 15 s at 4,000 rpm. Using a plastic spatula, the materials that were sticking to the inside wall of the table blender’s container were recovered to ensure slurry homogeneity. Then, the blending was continued for this suspension for another 35 s at 12,000 rpm.
The last slurry sample preparation step is conditioning. After mixing, each cement slurry sample was immediately conditioned as per the atmospheric conditioning method (API, 2013). This conditioning could make the slurry more homogeneously dispersed and pre-hydrated (Jafariesfad et al., 2017). The atmospheric pressure consistometer used is Grace® M7210. Before loading the slurry sample into the consistometer’s container, the bath oil temperature was maintained as the ambient temperature to prevent sudden thermal shock to the slurry (Bernard and Boukhelifa, 2006). The heating ramp was then applied (if required) as quickly as possible to the desired test temperature (e.g., 88°C ± 1°C). In the meantime, started stirring the slurry at 150 rpm with a specially designed paddle. The duration from the start of the heating ramp to the stop of conditioning was kept consistent for all slurry samples at 20 min ± 0.5 min. After this conditioning, the slurry sample is ready for the rheology test.
3.3 Rheology test
A kind of Couette coaxial cylinder rotational viscometer made by OFITE (OFITE 900 viscometer) was used in this study, which is compatible with the API standard (API, 2013; OFITE, 2018). On account of the relatively low viscosity of OWC slurries, the coaxial concentric bob (cylinder with a conical upper end)–rotor (cylindrical sleeve) geometry was considered suitable for testing the rheological properties of cement slurry. The inner radius of the rotor sleeve is 18.415 mm. The outer radius of the bob is 17.245 mm. Both of them are made of stainless steel with a smooth surface to minimize the friction error during the rotation testing. The rotor sleeve would rotate around the bob during the testing. The shear gap was set to 1.17 mm for all tests that would minimize the slippage effect between the bob’s outer surface and the inner surface of the rotor sleeve in rheology tests (Saak et al., 2001).
This viscometer has the built-in rheological data analysis software—ORCADA. It can analyze the recorded shear stress-shear rate data by fitting them to certain rheological models. The viscometer configuration was kept consistent for all tests. The bob-rotor unit was pre-heated at the desired testing temperature ahead of each rheology test to avoid the possible sudden thermal shock to the slurry sample.
Before commencing the rheology tests, the viscometer was calibrated using the NIST (National Institute of Standards and Technology, United States) certified standard calibration fluid with a known viscosity of 95.6 cP at 25°C provided by the manufacturer. Facilitated by the ORCADA software, the computer-controlled calibration method was successfully conducted as per the instruction manual from the manufacturer, OFITE (OFITE, 2018). The accuracy indicator of r2 is 0.9999, which is higher than the acceptance threshold of 0.9990 (OFITE, 2018).
When starting the rheology test, both the bob and the rotor would submerge into the slurry sample. The test slurry was contained in the annular space (the shear gap between the rotor sleeve and the bob). The angular displacement of the bob was automatically measured, transformed, and stored. This viscometer could maintain the temperature constant throughout each test by the use of the heat cup and thermocouple. Since the highest test temperature in this study was 88 °C, which is much lower than the water boiling temperature at atmospheric pressure, the slurry container (heat cup) was not covered for all the tests. An illustrative diagram of the rheology testing program is depicted in Figure 2.
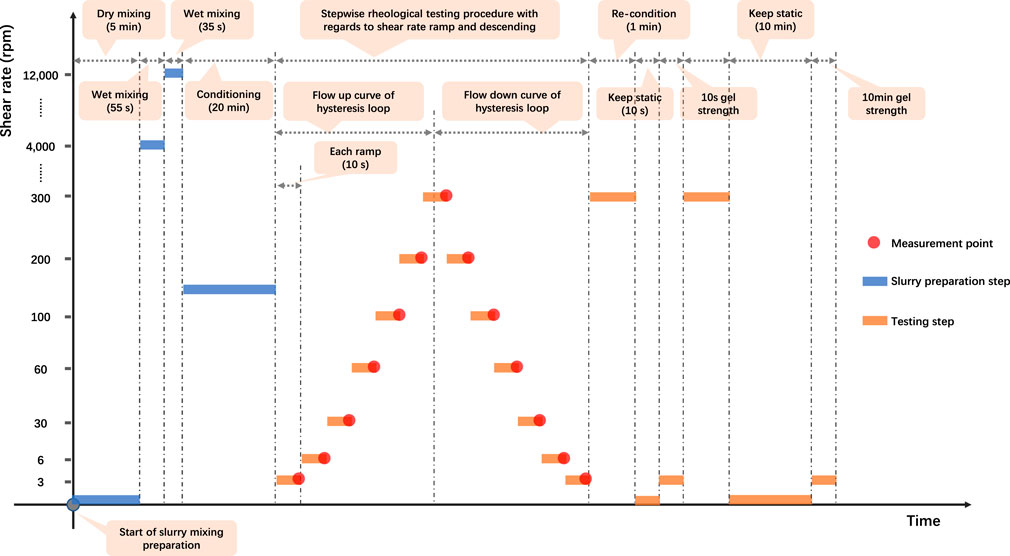
FIGURE 2. Illustrative rheology testing program used in this study.
As for rheological properties determination, each slurry sample was subjected to a stepwise shear rate ramp or steady state flow with rheology measurements, which were conducted at 7 shear rates ranging from 3 RPM (5.11 s−1) to 300 RPM (511 s−1) to get the up flow curve. At each shear rate interval, the viscometer maintains the shear rate constant for 10 s. Then, the slurry sample was subjected to a stepwise shear rate descending from 300 RPM (511 s−1) to 3 RPM (5.11 s−1) to acquire the down flow curve. The thixotropy of each slurry sample can be analyzed by this hysteresis loop (Roussel et al., 2012; Ferron et al., 2013; Kawashima et al., 2013; Shahriar and Nehdi, 2014; Kolawole et al., 2019).
As for the static gel strength (GS) determination, the initial GS (10 s GS) and final GS (10 min GS) have been measured with the same rheological testing slurry. To perform this, each slurry sample was preconditioned again at a 511 s−1 shear rate for 1 min to destruct the gel structure constructed. Then the sample remained static for 10 s and was stirred again at a 5.11 s−1 shear rate. The maximum observed shear stress value was the initial GS. Similarly, after keeping the slurry sample static for another 10 min, the peak shear stress value was the final GS.
3.4 Compressive strength measurement
The compressive strength was measured in cylindrical samples of 3.0 inches in length and 1.5 inches in diameter. The measurement was performed using the scratch test (Richard et al., 2012; Murtaza et al., 2019b; Kolawole and Ispas, 2020). After the cement slurry preparation, it was poured into cylindrical molds; the samples were then cured for 1 week using a water bath, and every sample was subjected to a specific temperature and atmospheric pressure. After demolding the samples, they were tested using the scratch testing method. The measurement was conducted by performing 8 cuts for every measurement per sample. The depth of cut used was 0.05 mm. The compressive strength was performed on three samples representing every specimen, and the actual compressive strength for the specimen was considered as the average of the three measurements. To ensure the consistency of the results, the standard deviation for the three measurements performed for every specimen was calculated.
4 Results and discussion
4.1 Data processing and rheological model choice
As mentioned above, three repetitions of the rheology experiment have been carried out for each slurry sample. The primary experiment result data are shear rate, shear stress, and time. Other rheological properties (apparent viscosity, PV, and YS) can be derived by use of the regression analysis and the rheology model. Therefore, the averaged shear stress versus the corresponding shear rate along with its standard deviation have been listed in Tables 3, 4. The apparent viscosity values shown in Figure 3 are derived by the calculation method recommended by the manufacturer. The input shear stress data are the averaged values. In addition to this, the averaged shear stress is also the base of such plots: the hysteresis loop figure (Figure 4), the plots of plastic viscosity vs. shear rate (Figure 5), and the plots of yield stress vs. shear rate (Figure 6). Moreover, the gel strength measurement is relatively independent of these properties. Hence, Figure 7 is illustrated with both the averaged gel strength values and their standard deviations.
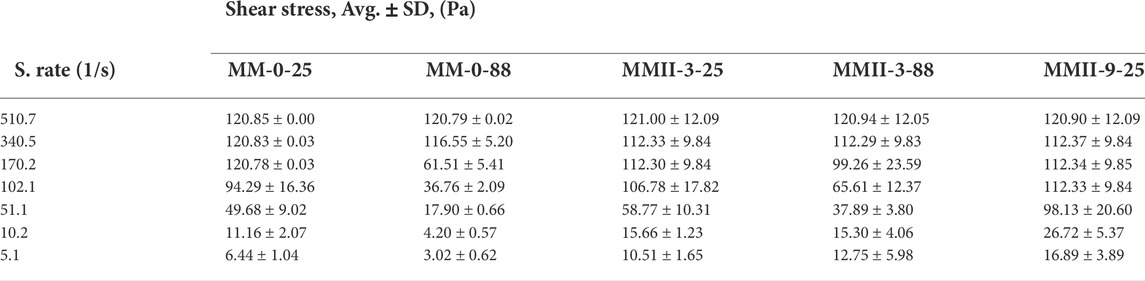
TABLE 3. Shear stress vs. different shear rates with its standard deviation of the control slurry and MMII slurry samples.
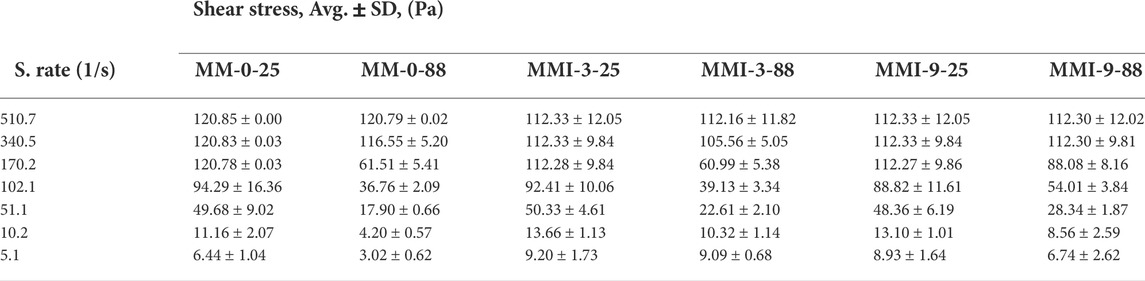
TABLE 4. Shear stress vs. different shear rates with its standard deviation of the control slurry and MMI slurry samples.
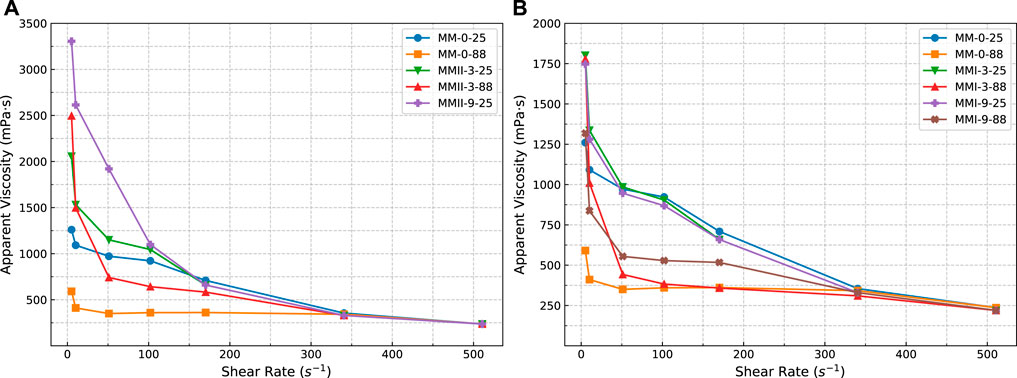
FIGURE 3. Apparent viscosity versus shear rate of slurry samples. (A) On slurry samples incorporated with MMII; (B) on slurry samples incorporated with MMI; MMI refers to type I micro-sized magnesium oxide; MMII refers to type II micro-sized magnesium oxide; MM refers to micro-sized magnesium oxide.
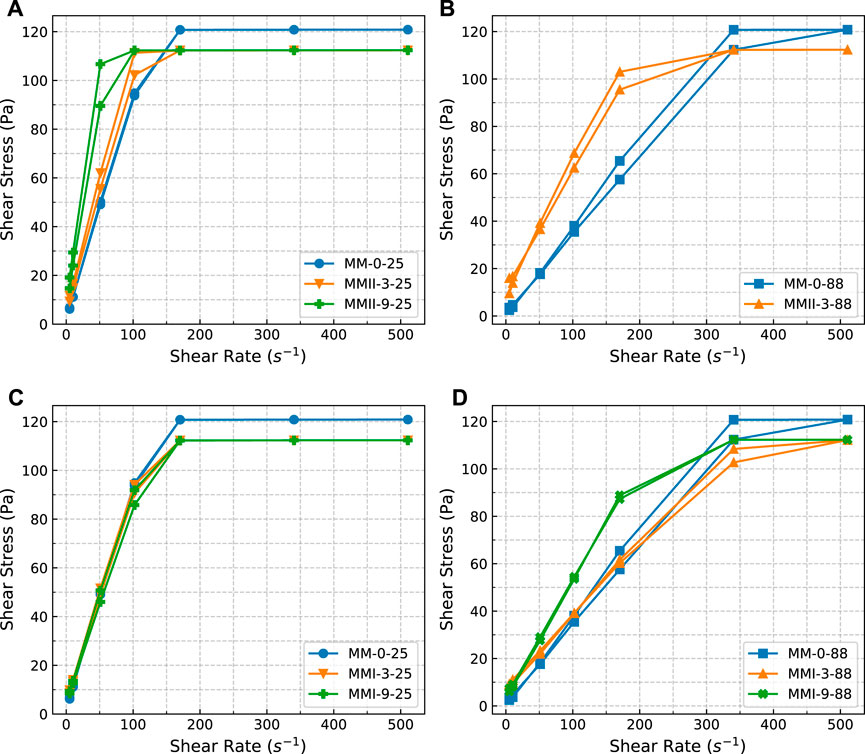
FIGURE 4. Hysteresis loops of slurry samples. (A) Slurry samples (base slurry and mixed with MMII, respectively) tested under 25°C; (B) slurry samples (base slurry and mixed with MMII, respectively) tested under 88°C; (C) slurry samples (base slurry and mixed with MMI, respectively) tested under 25°C; (D) slurry samples (base slurry and mixed with MMI, respectively) tested under 88°C; MMI refers to type I micro-sized magnesium oxide; MMII refers to type II micro-sized magnesium oxide; MM refers to micro-sized magnesium oxide.
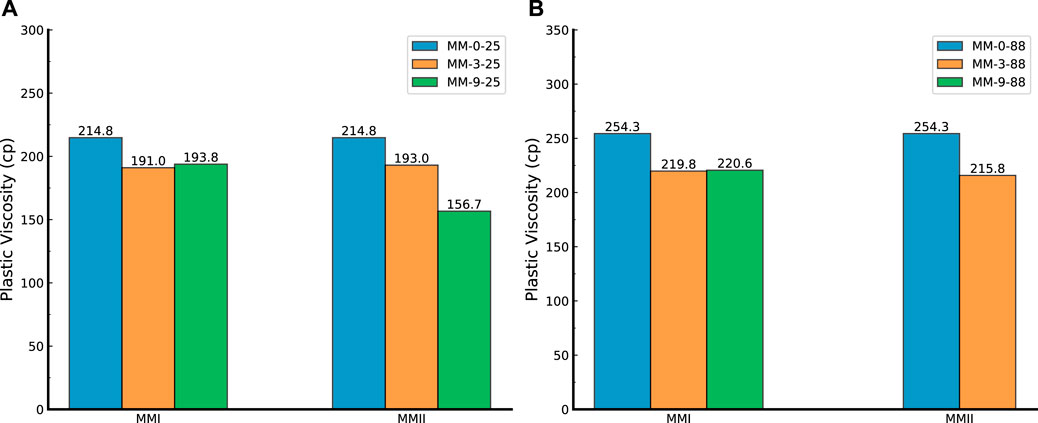
FIGURE 5. Plastic viscosity of slurry samples. (A) Slurry samples (mixed with MMII and MMI, respectively) tested under 25°C; (B) slurry samples (mixed with MMII and MMI, respectively) tested under 88°C; MMI refers to type I micro-sized magnesium oxide; MMII refers to type II micro-sized magnesium oxide; MM refers to micro-sized magnesium oxide.
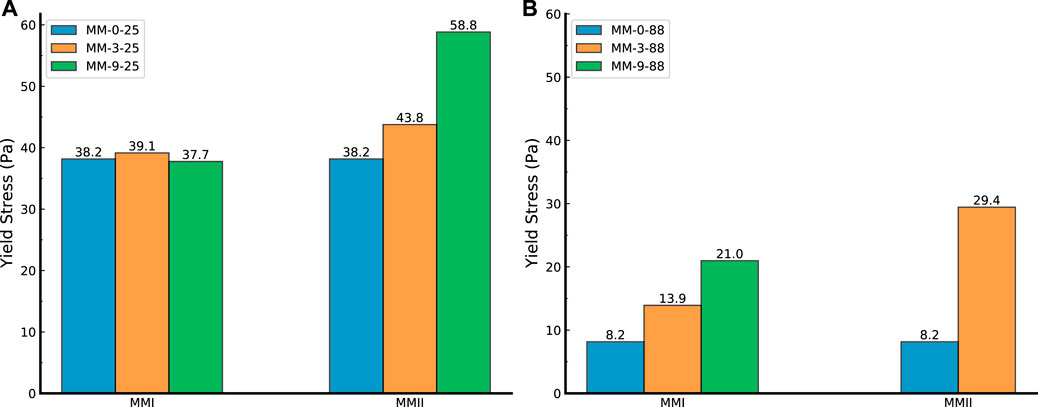
FIGURE 6. Yield point (yield stress) of slurry samples. (A) Slurry samples (mixed with MMII and MMI, respectively) tested under 25°C; (B) slurry samples (mixed with MMII and MMI, respectively) tested under 88°C; MMI refers to type I micro-sized magnesium oxide; MMII refers to type II micro-sized magnesium oxide; MM refers to micro-sized magnesium oxide.
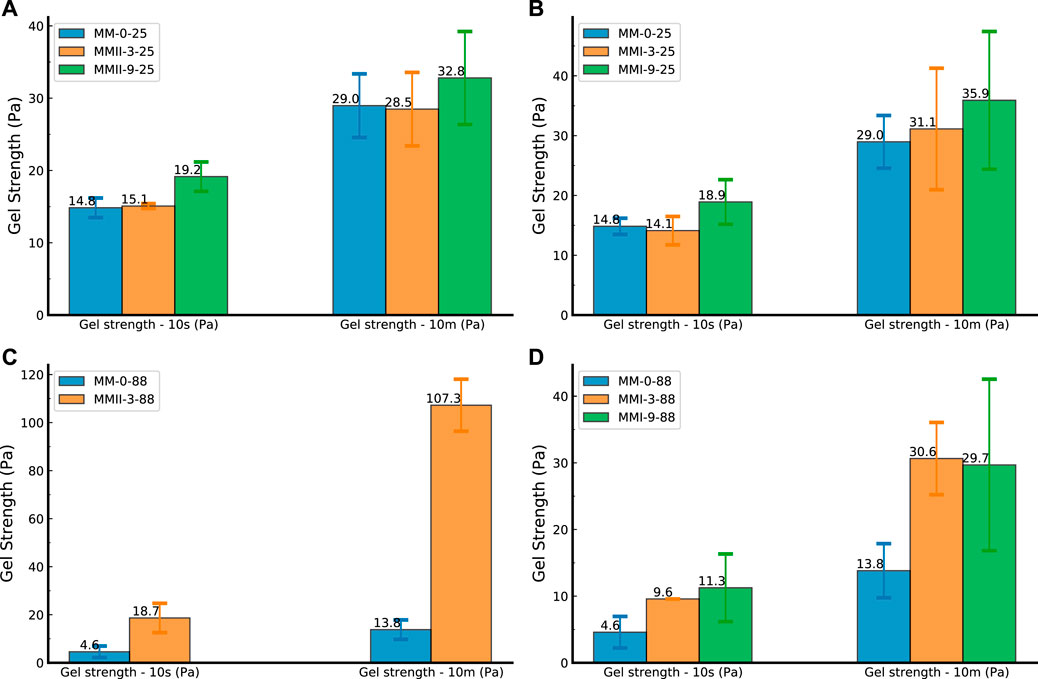
FIGURE 7. Gel strength of slurry samples. (A) Slurry samples (mixed with MMII) tested under 25°C; (B) slurry samples (mixed with MMII) tested under 88°C; (C) slurry samples (mixed with MMI) tested under 25°C; and (D) slurry samples (mixed with MMI) tested under 88°C; MMI refers to type I micro-sized magnesium oxide; MMII refers to type II micro-sized magnesium oxide.
The parameters of the three API (API, 2013) recommended rheology models are calculated by the use of the regression methods. The residual errors of each model and those model parameters can be found in Table 5. Even though the fitting accuracy of the Bingham model is not as good as the other two models’, the Bingham model is used afterward because it is the most used rheology model not only in literature but also in terms of field operations. Therefore, the rheological properties of all the slurry samples are chosen as the yield stress (τy) and the plastic viscosity (μp).
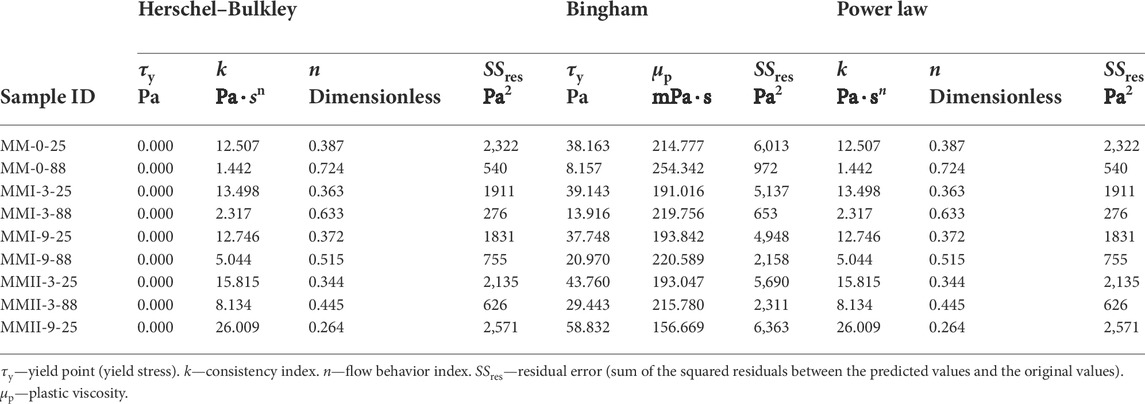
TABLE 5. Parameters of rheology models and their residual errors.
4.2 Temperature and micro-sized magnesium oxide effects on the slurries’ apparent viscosity and thixotropy
The rheological properties, especially the shear-thinning/thickening regimes, of the base (MM-0-25, MM-0-88) and extended slurry samples (MMI-3-25, MMI-3-50, ……, and MMII-9-88) were examined at two different temperatures, namely 25 and 88°C. It should be pointed out that all the corresponding rheology test results (apparent viscosity, hysteresis loop, PV, YS, and gel strength) of the MMII-9-88 sample are all missed hereby because the slurry behaved unpumpable after atmospheric conditioning, especially when the slurry sample is kept static for even a short period (e.g., during the gel strength measurement period). Maybe this arises from the coupled effect between the relative higher binder-to-water mass ratio (MMII dosage as 9% BWOC, Table 2) and the packing mechanism from MMII (Wong and Kwan, 2008; Bellotto, 2013; Tao et al., 2020) (MMII denoting type II micro-sized magnesium oxide, which has a double particle size compared with the OWC’s, Figure 1).
As shown in Figure 3, the higher temperature would generally decrease the apparent viscosity. With increasing shear rate, all slurry samples behaved in shear-thinning and non-Newtonian flow regimes (Daccord et al., 2006). When increasing the shear rate, the cement’s flocculation structure is destructed and the free water in the slurry is increased, so the slurry’s viscosity decreases gradually (Wang et al., 2021).
Meanwhile, regardless of the type of magnesium oxide and temperature, all curves converge when approaching certain high shear rate (around 340 s−1). This means the effect of temperature on rheological properties would fade away at sufficient high shear rate conditions. Because the whole rheology test was finished in the induction period of cement slurry, most of the water content is inhibited by the impermeable hydration layer on the particle’s surface, with a small amount of it hydrated (Erik, 2006). The mechanical agitation by increasing the shear rate breaks the flocculation structure among pre-hydrated particles and releases free water. The equilibrium state of flocculation and free water release probably takes place when the shear rate is increased to some extent. Moreover, the viscosity of shear-thinning fluid, such as cement slurry, has a gradually decreasing trend with the shear rate increasing within the laminar flow scope (Daccord et al., 2006). Hence, for these reasons, the apparent viscosity of slurry samples will probably converge more or less with an increasing shear rate. Nevertheless, in the medium shear rate scenarios, the shear stress would be higher in the lower temperature case. The higher dosage of micro-sized magnesium oxide causes the apparent viscosity to increase. Furthermore, the type II micro-sized magnesium oxide makes this increment more apparent than the type I micro-sized magnesium oxide. This probably arises both from the more irregular shape of MMII (the sphericities of MMII and MMI are 0.81 and 0.84 respectively, D50) and the particle packing phenomenon at the early age of the OWC slurry (Antoni et al., 2019; Chateau, 2012; Kumar and Santhanam, 2003; Mooney, 1951). In addition to the particle size, other factors, like the surface morphology, will also play an important role in the initial fluidic condition of the cement slurry. The particles with different surface morphology will impact the rheological properties of cement pastes differently even if the particles are in the same oxide chemical composition (Li et al., 2020). Based on Figure 1, the type II micro-sized magnesium oxide is around double the size of type I. Moreover, the particle size of type I micro-sized magnesium oxide is similar to that of OWC. This makes the slurry mixed with type II micro-sized magnesium oxide more packed/condense than the slurry blended with type I micro-sized magnesium oxide. Then the solid volume fraction increased in the slurry mixed with type II micro-sized magnesium oxide. Particle packing will cause the water film between particles to be thinner, which then increases the physical interaction between particles (Wong and Kwan, 2008). Thus, the fluid phase in the slurry suspension system will flow in a more difficult way in the slurry mixed with type II micro-size magnesium oxide. Then the shear stress and corresponding apparent viscosity will increase.
The slurry samples’ hysteresis loop curves are depicted in Figure 4. Based on the definition of thixotropy of cement slurry, the enclosed area of each curve represents the extent of thixotropy.
When comparing the slurry samples at different temperatures (Figure 4A vs. Figure 4B, Figure 4C vs. Figure 4D), the hysteresis takes place more prominently. This indicates that the slurry formed less structures under ambient temperature. It is probably due to the lower hydration kinetics under the lower temperature conditions.
When comparing the slurry samples regarding different types of magnesium oxide (Figure 4A vs. Figure 4C, Figure 4B vs. Figure 4D), the slurry mixed with type II micro-sized magnesium oxide is prone to higher thixotropy than the rivals from type I micro-sized magnesium oxide blended slurry. When cement slurry has different particle size and density constituents (e.g., the density of Portland cement is 3.15 g/cm3, the density of magnesium oxide is 3.58 g/cm3), settling and packing will probably occur (Ahmed et al., 2020; Ahmed et al., 2019). These mechanisms may also cause this to occur. When going through the flow-up curve, with the increasing shear rate, the “settled” packing matrix with different particle-sized OWC and magnesium oxide (type II) makes the flow more difficult than the relative unpacked matrix from type I micro-sized magnesium oxide suspension. More shear stress will be consumed to break up this “settled” packing system. Vice versa, when proceeding with the flow-down curve, the shear stress decreases more than its rival value at the flow-up curve because most of the particles are already stirred up, and the packing matrix was destructed. However, in terms of the slurries blended with type I micro-sized magnesium oxide, the whole particle suspension matrix behaves similarly regardless of the shear rate variation (the up curve and the down curve). Hence, the shear stress shows not much divergence at the same shear rate condition. Thus, the thixotropy of the slurry samples mixed with MMI is less than its rival samples mixed with MMII.
4.3 Impacts of temperature and micro-sized magnesium oxide on the plastic viscosity of slurry samples
The plastic viscosity (PV) of slurry samples plotted against the temperature and type of magnesium oxide was depicted in Figure 5. The values of PV were obtained with a linear regression based on the shear stress and shear rate data (Tables 3, 4). Therefore, it should be noted that the calculated PV does not always truly represent the tested slurry samples properly since possible errors could be involved in this fitting process (Saak, 2000; Shahriar, 2011).
Figure 5A shows the response of PV from three dosages of two types of MM under a 25°C testing temperature. In general, the PV gradually decreased with increased MMII dosage. However, in the case of MMI, the PV varies little with the increase in MMI dosage. It can be observed that PV was impacted more by the dosage of MMII rather than MMI cases under 25°C. Figure 5B correlates to the two types of MM dosages at 88°C testing temperature. The variation trend of PV behaves in a similar way as in Figure 5A.
When comparing these two subfigures, the PV increases with the increment of temperature regarding the same dosage and formulation of slurry. This perhaps arises from the higher hydration kinetics of cementitious materials when subjected to higher temperature conditions (Carette and Staquet, 2016a,b; Gastaldi et al., 2012; Shahriar and Nehdi, 2012). Moreover, the larger particle size of MMGO incorporation would decrease the PV (e.g., MMII-9-25 vs. MMI-9-25). This probably was derived from the different particle sizes and specific surface areas between the two types of magnesium oxide. Since the MMI has almost half the particle size compared with MMII particles, the interaction between particles in the MMI mixed suspension would be stronger than in the case of MMII. When cement slurry was flowing, this stronger interaction would reflect the PV increase. This trend will become more apparent coupled with dosage increment. In the case of MMI (around 50 microns), the dosage of MM has little impact on PV.
4.4 Influences of temperature and micro-sized magnesium oxide on the yield stress of slurry samples
Figure 6A depicts the influence of dosage and type of MM on the yield stress (YS) of slurry samples at 25°C testing temperature. Similarly, Figure 6B shows the cases of slurry samples under high temperature at 88°C. All of these histograms were obtained by the use of a stepwise shear rate sweep (mentioned above in the rheology test section) on those cement slurries. Then, these flow curves were applied to resolve the YS by the use of linear regression analysis.
As can be observed from Figure 6A, the YS would increase generally with the dosage of MM increasing (except in the MMI-9-25 case). The rate of increase of YS from MMII dosage samples was much higher than the rival part-the MMI mixed samples. Since the YS is the indicator of making the slurry flow from a static state, this different behavior of the YS may again arise from the particle packing factor. Compared to Figure 6A,B, temperature plays a negative effect on YS. This is likely attributed to the offset acceleration of cement particle hydration when mixing a higher dosage of MM particles. Some studies point out that the hydration of magnesium oxide does not interact with the cement particle hydration products (Vandeperre, 2008). Hence, when introducing more MM particles into the OWC slurry, the water consumption with OWC particles would be decreased. Thus, the internal interaction structure (like C-S-H gel) among OWC particles would hereby decrease.
4.5 Effects of temperature and micro-magnesium oxide on the GS of slurry samples
Figure 7 was derived by using the static GS measurement method mentioned above. Specifically, Figures 7A,B both represented the 10 s static GS and 10 min static GS of slurry samples blended with type II magnesium oxide at two temperature conditions. While Figures 7C,D refer to the cases of slurry samples mixed with type I magnesium oxide. In general, the values of 10 min GS were always higher than the values of 10 s GS. This is probably because of more internal interaction and formation of gelling structure when the slurry was subjected to the longer static state.
When comparing the subfigures from two types of magnesium oxide, they result in a contrary impact on GS development. As for the MMI samples (Figures 7C,D) with smaller particle sizes, both 10 s and 10 min GS showed a decreasing trend in terms of temperature increase. However, on the other hand, when using MMII, the higher temperature makes the 10 min GS increase substantially. A possible reason could be the same as mentioned in the above section. MMI has a smaller particle size compared with MMII. This means, with the same dosage, the water bonded with magnesium oxide particles would be more in terms of the MMI case. Furthermore, the hydration product of magnesium oxide is hydroxide, which would not interact with the C-S-H gel structure in the hydration process of OWC particles (Vandeperre, 2008). Hence, the internal structure (perhaps the C-S-H gel structure) would be less formed in the slurry sample blended with MMI. When subjected to a higher temperature, faster hydration would cause this internal structure quantity difference to increase substantially . Therefore, the GS of the slurry samples admixed with MMII would probably increase when subjected to higher temperature conditions.
In terms of the same type of magnesium oxide admixture, the GS usually has a positive correlation with the MM dosage. Higher dosage means higher gel strength. This probably is because more incorporation of magnesium oxide particles increases the solid-to-water mass ratio of the slurry suspension (Shahriar and Nehdi, 2014). In general, the trends of GS in Figure 7 were in rough agreement with those of YS in Figure 6.
4.6 Influences of curing temperature, dosage, and type of magnesium oxide on the compressive strength
As for the compressive strength tests, the standard deviation was found to be a maximum of 2.4 MPa for sample MMII-9-25, which confirmed the high consistency of the measurements. All the standard deviations and the corresponding averaged compressive strength results are plotted in Figure 8. This figure compares the compressive strength of the cement samples after 7 days of curing at 25°C and 88°C at different concentrations of MMI and MMII. As indicated in Figure 8A, for the samples cured at 25°C, the compressive strength of the samples prepared with both types of magnesium oxide (MMI and MMII) behaved similarly with the increase in the magnesium oxide concentration, where the compressive strength was increased with the addition of magnesium oxide. The rate of increase for the samples with MMII is greater than that for the samples with MMI. The compressive strength for the base sample prepared without magnesium oxide was 36.3 MPa (Figure 8A). The compressive strength of the samples increased slightly to 39.3 and 42.8 MPa after the addition of 3% and 9% of MMI, respectively, and considerably increased to 42.5 and 50.1 MPa after the addition of 3% and 9% of MMII, respectively.
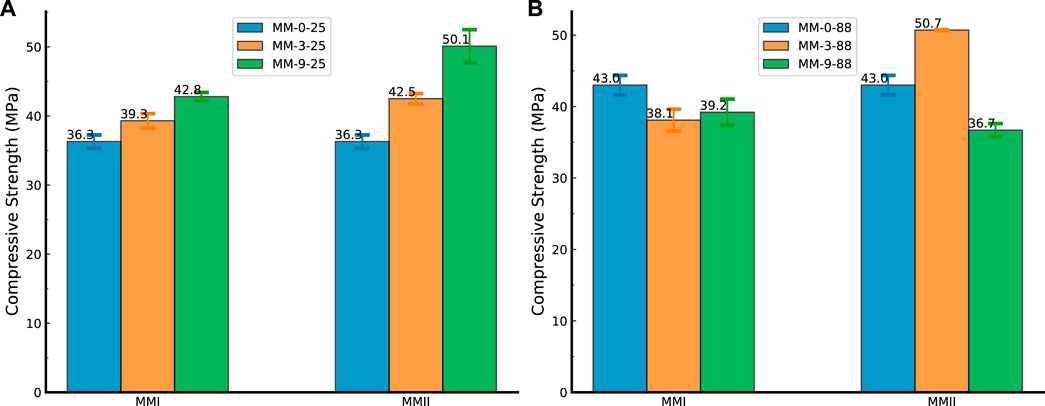
FIGURE 8. Compressive strength of the cement samples after 7 days of curing. (A) Slurry samples (mixed with MMI and MMII, respectively) tested under 25°C; (B) slurry samples (mixed with MMI and MMII, respectively) tested under 88°C; MMI refers to type I micro-sized magnesium oxide; MMII refers to type II micro-sized magnesium oxide.
The change in the compressive strength at high temperature behaved differently as shown in Figure 8B. The compressive strength for the samples with MMII increased after the addition of 3% MMII to achieve 50.7 MPa, then decreased to 36.7 Mpa, which is less than the compressive strength of the samples prepared without magnesium oxide (43.0 MPa). For the samples prepared with MMI, the compressive strength decreased slightly to 38.1 MPa after incorporating 3% of MMI; then it did not show great variation after the addition of 9% of MMI to stabilize at 39.2 MPa.
This phenomenon perhaps means that the expansion from the hydration of magnesium oxide particles in the cement slurry matrix will take different roles in terms of the whole consolidating structure formation. When the specimens were cured under low temperature, all the specimens showed a positive correlation with the dosage variations. Hence, the expansion from the hydration of magnesium oxide probably behaved synchronously with the solidification process of the cement matrix (Jafariesfad et al., 2017). This made the set cement matrix condenser and stronger. On the contrary, when the specimens were cured under high temperature, both magnesium oxides (MMI and MMII) hydrated faster. Coupled with the different particle sizes and their micromorphological features, the two kinds of specimens (mixed with MMI vs. MMII) behaved in different ways. The MMII magnesium oxide probably hydrated faster than the MMI magnesium oxide and the cement particle hydration was probably compatible with the MMII rather than the MMI magnesium oxide. So, the compressive strength of MMI specimens decreased a bit, probably because the magnesium oxide hydrated at the later stage of the consolidation process of the cement matrix (José et al., 2020). However, when the dosage of MMII was increased to a certain level (e.g., 9% in this study), the over-expansion from MMII particles would offset its positive effect of condensing the cement consolidating matrix (Hammad and Altameini, 2002).
5 Conclusion
The effects of two types of magnesium oxide additions on the rheological behavior and compressive strength of API Class G OWC slurries were investigated at 25 and 88°C. Some conclusions based on the experimental results can be drawn as stated below. With this study, more insights are obtained about the impact of micro magnesium oxide on the rheological and mechanical properties of OWC slurries at different temperatures, which will enrich the knowledge of using magnesium oxide as a kind of expansive additive, especially in terms of oil and gas well cementing surroundings.
• The PV of tested slurries decreased with the incorporation of magnesium oxide powder into the OWC slurries. The most decrements were 27.0% (type II, 9%, 25°C) and 15.1% (type II, 3%, 88°C), respectively. This would benefit the workability of the OWC slurry when undergoing the displacement operation in the field.
• The magnesium oxide powder used in this work increased the YS, which would impact the pumpability of OWC slurries negatively. For instance, the YS increased by 258.5% (type II, 3%, 88°C) and 53.9% (type II, 9%, 25°C), respectively. However, since dispersant was not used in this study, further research in terms of extended slurry samples incorporating dispersant is necessary to be conducted.
• The type of magnesium oxide plays an important role in alternating the thixotropy, GS, and YS. The GS generally increased as the magnesium oxide dosage increased. However, all tested slurry samples showed shear-thinning behavior and non-Newtonian characteristics. Based on this study, the magnesium oxide powder with a larger particle size will impact these properties more apparently than the magnesium oxide with a smaller particle size. Among the tested slurry samples, incorporation of magnesium oxide with a smaller particle size was found to achieve better rheological performance even if no dispersant exists. That probably means that in addition to the particle size, other factors could impact the initial fluidic conditions in the cement slurry, such as the particle packing, the density difference, and the different particle surface morphology features.
• The impact of these two magnesium oxides (MMI, MMII) on compressive strength varies differently depending on different curing conditions and dosages. Both magnesium oxide additions studied in this work played positive roles in improving the compressive strength of cured cement specimens under a low-temperature condition (25°C). However, when cured at a high temperature (88°C), MMI magnesium oxide addition will decrease the compressive strength by 11%. Increasing the dosage (from 3% to 9%) will mitigate this decrease. On the other hand, the compressive strength is much more sensitive to the dosage of MMII magnesium oxide. Based on this work, 3% MMII magnesium oxide addition will improve the compressive strength by 17.9%, while a 9% addition will decrease it by 14.7%.
Data availability statement
The original contributions presented in the study are included in the article/Supplementary Material; further inquiries can be directed to the corresponding author.
Author contributions
Conceptualization, WC, AM. Methodology, WC, SE, AM. Data curation, WC, AM. Writing - original draft preparation, WC. Writing - revised manuscript preparation, WC, AM, SE.
Funding
This research did not receive any specific grant from funding agencies in the public, commercial, or not-for-profit sectors.
Acknowledgments
The authors gratefully acknowledge the experiment facilities provided by the CPG (College of Petroleum Engineering & Geosciences) of KFUPM (King Fahd University of Petroleum & Minerals) and the technical help from Mr. Jaber Al Jaberi, Mr. Bandar Dhaifallah Al-Otaibi, and Mr. Murtada Al-Hashem. The authors also acknowledge the generous source material supply from Halliburton.
Conflict of interest
The authors declare that the research was conducted in the absence of any commercial or financial relationships that could be construed as a potential conflict of interest.
Publisher’s note
All claims expressed in this article are solely those of the authors and do not necessarily represent those of their affiliated organizations, or those of the publisher, the editors, and the reviewers. Any product that may be evaluated in this article, or claim that may be made by its manufacturer, is not guaranteed or endorsed by the publisher.
References
Abbas, G., Irawan, S., Kumar, S., Memon, K. R., and Khalwar, S. A. (2014). Characteristics of oil well cement slurry using hydroxypropylmethylcellulose. J. Appl. Sci. 14, 1154–1160. doi:10.3923/jas.2014.1154.1160
Ahmed, A., Elkatatny, S., Adjei, S., and Al-Majed, A. (2020). Influence of weighting materials on the properties of oil-well cement. ACS Omega 5, 27618–27625. doi:10.1021/acsomega.0c04186
Ahmed, A., Mahmoud, A. A., Elkatatny, S., and Chen, W. (2019). The effect of weighting materials on oil-well cement properties while drilling deep wells. Sustainability 11, 6776. doi:10.3390/su11236776
Antoni, A., Hardi, E., Tandean, R. D., and Hardjito, D. (2019). Mix design of low-cement concrete with particle packing concept and superplasticizer application. IOP Conf. Ser. Mat. Sci. Eng. 615, 012006. doi:10.1088/1757-899x/615/1/012006
API (2013). API RP 10B-2 recommended practice for testing well cements. Second Edition. Washington, DC: API Recommended Practice.
Banfill, G., and Frank, P. (2006). “Rheology of fresh cement and concrete,” in Rheology reviews 2006 (British Society of Rheology), 61–130.
Banfill, P. (2003). “The rheology of fresh cement and concrete — a review,” in Proceedings of the 11th International Cement Chemistry Congress Durban, South Africa.
Bellotto, M. (2013). Cement paste prior to setting: A rheological approach. Cem. Concr. Res. 52, 161–168. doi:10.1016/j.cemconres.2013.07.002
Bernard, D., and Boukhelifa, L. (2006). “Laboratory testing, evaluation, and analysis of well cements,” in Well cementing. Editors E B. Nelson, and D. Guillot.
Buntoro, A. (2001). “The effect of neat magnesium oxide (MgO) as expanding additive with burning temperature 1200 degC and 1300 degC on cement shear bond strength at high pressure and temperature,” in Proceedings of the 5th Inaga Annual Science Conference and Exhibitions (Yogyakarta).
Carette, J., and Staquet, S. (2016a). Monitoring and modelling the early age and hardening behaviour of eco-concrete through continuous non-destructive measurements: Part I. Hydration and apparent activation energy. Cem. Concr. Compos. 73, 10–18. doi:10.1016/j.cemconcomp.2016.07.002
Carette, J., and Staquet, S. (2016b). Monitoring and modelling the early age and hardening behaviour of eco-concrete through continuous non-destructive measurements: Part II. Mechanical behaviour. Cem. Concr. Compos. 73, 1–9. doi:10.1016/j.cemconcomp.2016.07.003
Chateau, X. (2012). “6 - particle packing and the rheology of concrete,” in Understanding the rheology of concrete. Editor N. Roussel (Woodhead Publishing), Woodhead Publishing Series in Civil and Structural Engineering), 117–143. doi:10.1533/9780857095282.2.117
Chen, W., Elkatatny, S., Murtaza, M., and Mahmoud, A. A. (2021). Recent advances in magnesia blended cement studies for geotechnical well construction—a review. Front. Mat. 8. doi:10.3389/fmats.2021.754431
Daccord, G., Guillot, D., and Nilsson, F. (2006). “Mud removal,” in Well cementing. Editors E B. Nelson, and D. Guillot. (Schlumberger). 143 – 190.
Erik, B.Nelson and Michel Michaux (2006). “Chemistry and characterization of Portland cement,” in Well cementing. Editors E B. Nelson, and D. Guillot.
Ferron, R. D., Shah, S., Fuente, E., and Negro, C. (2013). Aggregation and breakage kinetics of fresh cement paste. Cem. Concr. Res. 50, 1–10. doi:10.1016/j.cemconres.2013.03.002
Gastaldi, D., Canonico, F., Capelli, L., Boccaleri, E., Milanesio, M., Palin, L., et al. (2012). In situ tomographic investigation on the early hydration behaviors of cementing systems. Constr. Build. Mater. 29, 284–290. doi:10.1016/j.conbuildmat.2011.10.016
Ghofrani, R., and Plack, H. (1993). “CaO-and/or MgO-swelling cements: A key for providing a better annular sealing?,” in SPE/IADC Drilling Conference (Amsterdam: Society of Petroleum Engineers), 199–214. doi:10.2118/25697-MS
Guillot, D. (2006). “Rheology and flow of well cement slurries,” in Well cementing. Editors E B. Nelson, and D. Guillot (New York, NY), 93–142.
Guillot, D. (1990). “Chapter 4 - rheology of well cement slurries,” in Well cementing. Editor E B. Nelson, and D. Guillot (Elsevier).
Hammad, M. A. A., and Altameini, Y. M. (2002). “Cement matrix evaluation,” in IADC/SPE Asia Pacific Drilling Technology, Jakarta, Indonesia, 2002 (Jakarta: Society of Petroleum Engineers), 1–10. doi:10.2118/77213-MS
Huajun, C., Sudong, H., Qisheng, W., Changsen, Z., and Tao, Y. (2013). Effect of MgO expanding agent on early performance of oil well cement under three dimensional constraint. J. China Univ. Petroleum (ZiRanKeXueBan) 37, 153–158. doi:10.3969/j.issn.1673-5005.2013.06.025
Jafariesfad, N., Geiker, M. R., and Skalle, P. (2017). Nanosized magnesium oxide with engineered expansive property for enhanced cement-system performance. SPE J. 22, 1681–1689. doi:10.2118/180038-PA
José, N., Ahmed, H., Miguel, B., Luís, E., and Jorge, d. B. (2020). Magnesia (MgO) production and characterization, and its influence on the performance of cementitious materials: A review. Materials 13, 4752. doi:10.3390/ma13214752
Kawashima, S., Chaouche, M., Corr, D. J., and Shah, S. P. (2013). Rate of thixotropic rebuilding of cement pastes modified with highly purified attapulgite clays. Cem. Concr. Res. 53, 112–118. doi:10.1016/j.cemconres.2013.05.019
Kolawole, J. T., Combrinck, R., and Boshoff, W. P. (2019). Measuring the thixotropy of conventional concrete: The influence of viscosity modifying agent, superplasticiser and water. Constr. Build. Mater. 225, 853–867. doi:10.1016/j.conbuildmat.2019.07.240
Kolawole, O., and Ispas, I. (2020). EEvaluation of geomechanical properties via scratch tests - where are we and where do we go from here? SN Appl. Sci. 2, 1633. doi:10.1007/s42452-020-03469-5
Kumar, S., and Santhanam, M. (2003). Particle packing theories and their application in concrete mixture proportioning: A review. Indian Concr. J. 77, 1324–1331.
Li, H., Ding, S., Zhang, L., Ouyang, J., and Han, B. (2020). Effects of particle size, crystal phase and surface treatment of nano-TiO2 on the rheological parameters of cement paste. Constr. Build. Mater. 239, 117897. doi:10.1016/j.conbuildmat.2019.117897
Mo, L., Deng, M., and Tang, M. (2010). Effects of calcination condition on expansion property of MgO-type expansive agent used in cement-based materials. Cem. Concr. Res. 40, 437–446. doi:10.1016/j.cemconres.2009.09.025
Mooney, M. (1951). The viscosity of a concentrated suspension of spherical particles. J. Colloid Sci. 6, 162–170. doi:10.1016/0095-8522(51)90036-0
Murtaza, M., Mahmoud, M., Elkatatny, S., Majed, A. A., Chen, W., and Jamaluddin, A. (2019a). “Experimental investigation of the impact of modified nano clay on the rheology of oil well cement slurry,” in International Petroleum Technology Conference (Beijing, China).
Murtaza, M., Rahman, M. K., Al Majed, A. A., Tariq, Z., and Mahmoud, M. (2019b). “Scratch test for strength and toughness of oil well cement with nanoclay as an additive,” in Day 2 Tue, November 12, 2019 of Abu Dhabi International Petroleum Exhibition and Conference. doi:10.2118/197681-MS.D022S179R002
OFITE (2018). Model 900 viscometer instruction manual. Tech. rep.. Houston, Texas: OFI Testing Equipment, Inc. Copyright - Copyright OFI Testing Equipment, Inc. Updated - 2018-3-23.
Pecharsky, V. K., and Zavalij, P. Y. (2009). Collecting quality powder diffraction data. Boston, MA: Springer US. chap. 12. 301–346. doi:10.1007/978-0-387-09579-0_12
Reddy, B. R., Xu, Y., Ravi, K., Gray, D. W., and Pattillo, P. (2009). Cement shrinkage measurement in oilwell cementing - a comparative study of laboratory methods and procedures. SPE Drill. Complet. 24, 104–114. doi:10.2118/103610-PA
Richard, T., Dagrain, F., Poyol, E., and Detournay, E. (2012). Rock strength determination from scratch tests. Eng. Geol. 147-148, 91–100. doi:10.1016/j.enggeo.2012.07.011
Roussel, N., Ovarlez, G., Garrault, S., and Brumaud, C. (2012). The origins of thixotropy of fresh cement pastes. Cem. Concr. Res. 42, 148–157. doi:10.1016/j.cemconres.2011.09.004
Rubiandini, R., Siregar, S., Suhascaryo, N., and Efrial, D. (2005). The effect of CaO and MgO as expanding additives to improve cement isolation strength under HPHT exposure. Itbj. Eng. Sci. 37, 29–47. doi:10.5614/itbj.eng.sci.2005.37.1.3
Saak, A. W. (2000). Characterization and modeling of the rheology of cement paste: With applications toward self-flowing materials. Evanston, Illinois: Ph.D. thesis, Northwestern University.
Saak, A. W., Jennings, H. M., and Shah, S. P. (2001). The influence of wall slip on yield stress and viscoelastic measurements of cement paste. Cem. Concr. Res. 31, 205–212. doi:10.1016/S0008-8846(00)00440-3
Shahriar, A. (2011). Investigation on rheology of oil well cement slurries. London, Ontario: Ph.D. thesis, University of Western Ontario.
Shahriar, A., and Nehdi, M. (2014). Effect of supplementary cementitious materials on rheology of oil well cement slurries. Adv. Civ. Eng. Mat. 3, 20120027–20120478. doi:10.1520/ACEM20120027
Shahriar, A., and Nehdi, M. L. (2012). Rheological properties of oil well cement slurries. Proc. Institution Civ. Eng. - Constr. Mater. 165, 25–44. doi:10.1680/coma.2012.165.1.25
Suhascaryo, N., Rubiandini, R. R., Siregar, S., and Nawangsidi, D. (2005). “The effect of expanding additives to improve cement isolation strength to 250°C and 2000 psi conditions,” in Proceedings World Geothermal Congress 2005 (Antalya), 29–47.37
Tao, C., Kutchko, B. G., Rosenbaum, E., and Massoudi, M. (2020). A review of rheological modeling of cement slurry in oil well Applications. Energies 13, 570–655. doi:10.3390/en13030570
Vandeperre, L. J. (2008). Hydration and mechanical properties of magnesia, pulverized fuel ash, and Portland cement blends. J. Mat. Civ. Eng. 20, 3755–4383. doi:10.1061/(asce)0899-1561(2008)20:5(375)
Wang, L., Li, C., Shu, C., Yong, H., Wang, J., and Wang, H. (2021). Influence of lightly burned MgO on the mechanical properties and anticarbonization of cement-based materials. Coatings 11, 714. doi:10.3390/coatings11060714
Keywords: magnesium oxide, rheology, compressive strength, apparent viscosity, plastic viscosity, yield stress, gel strength, thixotropy
Citation: Chen W, Mahmoud AA and Elkatatny S (2022) Effect of micro-magnesium oxide admixture on rheological and compressive strength properties of class G well cement. Front. Mater. 9:902076. doi: 10.3389/fmats.2022.902076
Received: 22 March 2022; Accepted: 04 August 2022;
Published: 14 September 2022.
Edited by:
Jiapei Du, RMIT University, AustraliaReviewed by:
Leiju Tian, China University of Petroleum, Huadong, ChinaXinyue Wang, Dalian University of Technology, China
Yuqiang Xu, China University of Petroleum, China
Francesco Colangelo, University of Naples Parthenope, Italy
Siqi Ding, Harbin Institute of Technology, China
Copyright © 2022 Chen, Mahmoud and Elkatatny. This is an open-access article distributed under the terms of the Creative Commons Attribution License (CC BY). The use, distribution or reproduction in other forums is permitted, provided the original author(s) and the copyright owner(s) are credited and that the original publication in this journal is cited, in accordance with accepted academic practice. No use, distribution or reproduction is permitted which does not comply with these terms.
*Correspondence: Weiqing Chen, amVycm9teWNoYW5AZ21haWwuY29t