 Zhichao Cheng
 Shikang Qin
 Zhufang Fang
94% of researchers rate our articles as excellent or good
Learn more about the work of our research integrity team to safeguard the quality of each article we publish.
Find out more
ORIGINAL RESEARCH article
Front. Mater. , 25 April 2022
Sec. Environmental Degradation of Materials
Volume 9 - 2022 | https://doi.org/10.3389/fmats.2022.895271
This article is part of the Research Topic Machining Technology and Environmental Degradation Mechanism of Surface Microstructure of Special Materials View all 10 articles
Currently, micro-abrasive water jet machining has the problem of insufficient processing capacity in the central area. To assist with improving the processing efficiency, ultrasonic vibration is introduced. First, based on the computational fluid dynamics method, the mathematical model of the three-dimensional shape prediction of micro-holes is established using a mixed model, standard k-ε model, discrete phase model, and dynamic mesh model. The effects of the ultrasonic vibration on the static pressure, jet velocity field, abrasive particle motion state, and material erosion rate in the stagnation zone are studied. Then the accuracy of the prediction model is verified by comparing the two-dimensional section of the experimental data and the simulated data and calculating the three-dimensional mean square deviation. The established prediction model is used to further analyze the optimal frequency of the ultrasonic vibration and the specific influence of the optimal amplitude on the machining effect in micro-abrasive water jet machining. The above research results have profound guiding significance for determining how to use ultrasonic vibration in micro-abrasive water jet machining.
In recent years, with the rapid development of high-tech fields such as electrical and electronic engineering, optics, and biomedicine, the demand for microfluidic chips has continued to increase (Yeo et al., 2011; Espulgar et al., 2015; Chen et al., 2021; Ji et al., 2022). Currently, the main substrate materials used in microfluidic chips are hard and brittle materials such as silicon, glass, and ceramics. Hard and brittle materials have the characteristics of high hardness, high brittleness, wear resistance, and oxidation resistance. At the same time, these materials are easily affected by heat, so processing is difficult. K9 glass is a type of typical hard and brittle material. It has the advantages of high transparency, good optical uniformity, and stable chemical and physical properties. Hence, it is widely used in electronics, electrical engineering, and other fields (Hu et al., 2022; Qi et al., 2022).
Compared with laser beam machining, electric discharge machining, and chemical machining, the micro-abrasive water jet technology has the advantages of no thermal damage, high flexibility, and a fast cutting speed (Nguyen et al., 2018; Zhu et al., 2019; Li et al., 2021). It provides an efficient means of processing tiny geometric shapes. Although water jet processing is not selective in terms of materials, it can be used to machine tiny structures of almost any material, including ductile materials and brittle materials, and it is often used in processing hard and brittle materials and other difficult-to-process materials. In the process of micro-abrasive water jet machining, the grinding material is sprayed from the nozzle and then hits the workpiece, forming plastic deformation or a brittle fracture to achieve the purpose of material removal. When processing micro-channels, a high-pressure water jet is likely to cause a chip break. It has been found that when using a low-pressure abrasive water jet to process hard and brittle materials, high flexibility, easy control, and good surface processing quality can be obtained. However, the bottom surface of the micro-holes processed by a micro-abrasive water jet usually presents a “W” shape. The material at the center of the hole is difficult to remove, which affects the processing efficiency.
Due to the insufficient pressure and the characteristics of a stagnant zone, in the processing of micro-abrasive water jet technology, there has always been a phenomenon of insufficient processing capacity in the center area. To improve the processing effect of the micro-abrasive water jet technology, some auxiliary methods have been used. Researchers are continuously attempting to use different methods such as electrochemical-assisted micro-abrasive water jet machining (Liu et al., 2015), magnetorheological field-assisted micro-abrasive water jet machining (Lee et al., 2015), cavitation-assisted micro-abrasive water jet machining (Beaucamp et al., 2018), and ultrasonic vibration-assisted abrasive water jet processing. Among these methods, ultrasonic-assisted micro-abrasive water jet processing technology has been proven to improve the material removal rate of a workpiece, but its mechanism of action needs to be further studied.
Narayanan analyzed the formation mechanism of an abrasive water jet, analyzed the coupling mechanism between the liquid-gas-solid phase, and established a detailed mathematical model that could predict the energy of abrasive particles when they left the outlet of a polymer tube (Narayanan et al., 2013). The actual experimental results were consistent to a certain extent, but the establishment of the mathematical model was slightly too complicated. Li et al. simulated the multiple particle impact process based on FEM and used the Monte Carlo method to generate a random flow of impact particles, and they considered the heat exchange during the entire impact process (Li et al., 2014). The study found that the fracture caused by inertia was the vertical impact of the jet. The main material removal mechanism at the time and the destruction driven by thermal instability caused a higher material removal rate when the jet was tilted and impacted. Qi et al. used computational fluid dynamics (CFD) software to simulate the process of a micro-abrasive water jet eroding a workpiece with a two-dimensional model, and they analyzed the static pressure distribution in the jet field, the fluid velocity and the motion state of the abrasive particles, and the simulation results The experimental results could be successfully explained (Qi et al., 2016). Anwar et al. used an FE model to simulate the abrasive water jet milling process of titanium alloys in which the impact particles involved in the abrasive flow were modeled in layers to reduce the calculation time. These layers were very close to each other, making the particles impact. The interval was close to that of the actual abrasive water jet cutting process, and the results showed that the model could accurately predict the jet trajectory and material erosion rate (Anwar et al., 2013). Huang et al. used computational fluid dynamics software with the three-dimensional model of an abrasive water jet nozzle to numerically simulate the internal flow field of the liquid-solid two-phase flow and obtained the velocity distribution in the nozzle and the mixing chamber in all directions, as well as the relationship between the water flow velocity and the abrasive velocity (Huang et al., 2007).
In recent years, researchers have gradually discovered that the application of ultrasonic vibration can effectively increase processing efficiency and improve the processing effect. However, few people have effectively combined a model with an experiment to obtain a better prediction model of abrasive water-jet machining assisted by ultrasonic vibration, let alone further analyzed the optimal frequency of ultrasonic-assisted machining and the influence of the amplitude on the machining effect. The effectiveness of ultrasonic-assisted processing has always been a vague concept. A mathematical model that can effectively predict ultrasonic vibration-assisted abrasive water jet processing is of great significance for improving processing efficiency and guiding future abrasive water jet processing.
In this study, a mathematical model based on the CFD method is established to predict the three-dimensional shape of micro-holes. The effects of the ultrasonic vibration on the static pressure, jet velocity field, abrasive particle motion state, and material erosion rate in the stagnation zone are studied. After an experiment, the accuracy of the prediction model is verified by a two-dimensional section comparison and a three-dimensional mean square difference calculation. Using the established prediction model, we further analyze the optimal frequency of ultrasonic-assisted machining and the influence of the amplitude on the machining effect. Guidance for the vibration assistance used in the subsequent micro-abrasive water jet machining is also proposed.
Fluent has rich physical models. Fluent can be used to solve anything that involves a fluid. When using Fluent for the numerical simulation of the ultrasonic-assisted micro-abrasive water jet erosion process, the multiphase flow model, turbulence model, discrete phase model, and dynamic mesh are mainly used. For this research, the mesh model is established with ICEM and imported into Fluent. The water flow uses the standard k-ε model, and the DPM model is used to track the movement state and the trajectory of the particles. Since the air, water, and particles enter the nozzle at the same time, the mixture model can be used as the multiphase flow model in the ultrasonic-assisted micro-abrasive water jet simulation model. Considering the influence of ultrasonic vibration on the abrasive water jet machining process, a dynamic mesh is introduced into the model to make the workpiece move periodically during the simulation process. The workpiece is K9 glass, and the abrasive is composed of alumina particles. The geometric model of the micro-abrasive water jet flow field is shown in the figure below. The diameter of the nozzle is 0.125 mm (D1) and the length is 10.5 mm (L1). According to nozzle design, this nozzle aspect (length to diameter) ratio allowed the contraction coefficient of the jet to be considered as unity (Mccarthy and Molloy, 1974). Considering the external flow field distribution, simulation calculation time, and small jet impact area, the outer flow field area of the nozzle uses a cylinder with a diameter of 1 mm (D2) and a height of 2 mm (Sd), The distance of the nozzle outlet to the surface of the workpiece is Sd = 2 mm, as shown in Figure 1. For the other parameters used in the simulation, please refer to our previously published studies (Qi et al., 2016; Qi et al., 2017).
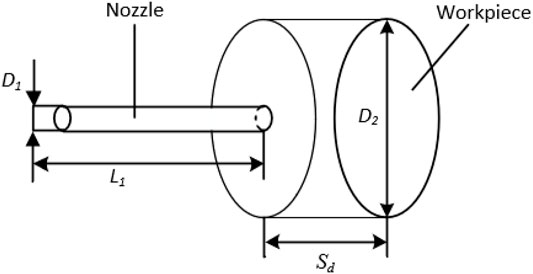
FIGURE 1. Geometry model of the flow field.
In the process of micro-abrasive water jet erosion, a stagnation zone with large static pressure forms on the surface of a workpiece, which hinders the abrasive particles from impacting the workpiece vertically, results in the decrease of the abrasive particle velocity and the deflection of the direction. Therefore, ultrasonic vibration is introduced. Figures 2A–C show the distribution of the static pressure on the workpiece surface along the radial direction before and after the introduction of ultrasonic vibration when the nozzle inlet pressures are 4 MPa, 6 MPa, and 8 MPa.
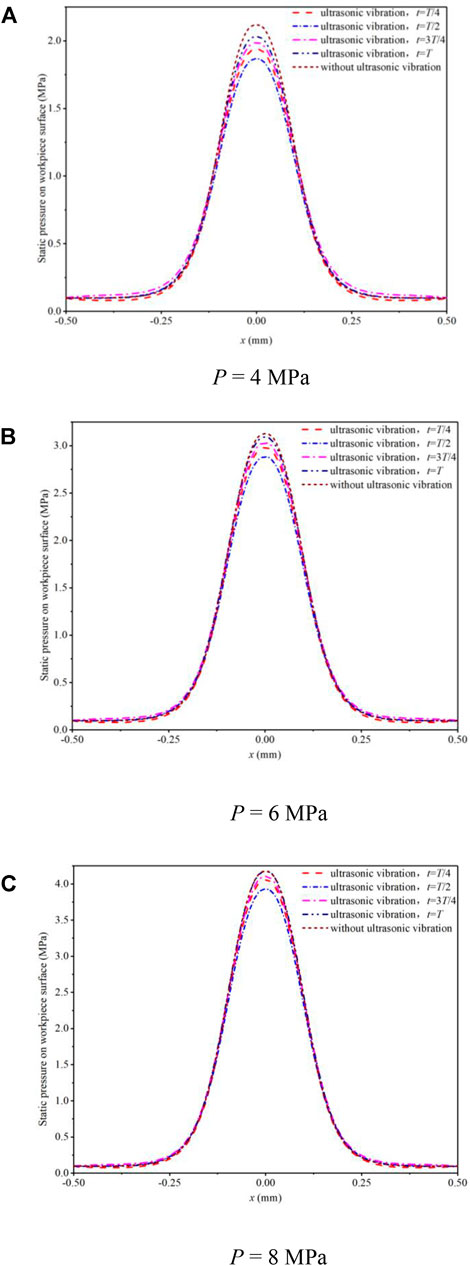
FIGURE 2. The distribution of the static pressure on the surface of the workpiece in the radial direction. (A) P = 4 MPa, (B) P = 6 MPa, (C) P = 8 MPa.
Figure 2 shows four representative moments in a vibration cycle: t = T, t = 3T/4, t = T/2, and t = T/4. It can be seen from the figure that before and after the introduction of ultrasonic vibration, the static pressure changes on both sides of the workpiece surface are not obvious. After the ultrasonic vibration is introduced into the center of the workpiece, the static pressure on the surface of the workpiece in the four stagnation zones is on the order of T > 3T/4 > T/4 > T/2. In time T, the workpiece moves towards the direction close to the nozzle at the maximum speed in the middle position, and at time T/2, the workpiece moves away from the nozzle at the maximum speed in the middle position. The velocity of the workpiece at T/4 and 3T/4 is 0. At T/4, the acceleration of the workpiece in the y-direction is negative and reaches the maximum. The acceleration of the workpiece in the y-direction at 3T/4 time is positive and reaches the maximum value. The analysis shows that the static pressure on the surface of the workpiece in the stagnation zone may be related to the velocity and acceleration of the workpiece vibration, and the influence of the velocity is greater than that of the acceleration. After the introduction of ultrasonic vibration, the static pressure in the stagnation zone of the jet is generally smaller than that without ultrasonic vibration. This may be due to the oscillation of the flow field near the workpiece during the vibration process, and the external energy is applied to the stagnation zone to break the original balance, thereby reducing the static pressure value and facilitating the removal of materials.
Based on results of previous studies (Qi et al., 2016; Qi et al., 2017), we analyze the change of the water jet velocity after adding an ultrasonic vibration field. Figure 3 shows the vector diagram of the velocity field of the water jet without ultrasonic vibration. It can be seen that when the vertical water jet reaches the vicinity of the workpiece surface, the velocity Vy in the vertical direction decreases sharply, and the velocity Vx in the horizontal direction increases rapidly from the center to the surrounding. At the same time, due to the existence of the stagnation zone, the streamline in the central region of the water jet is not perpendicular to the workpiece surface, but rather deflects a certain angle.
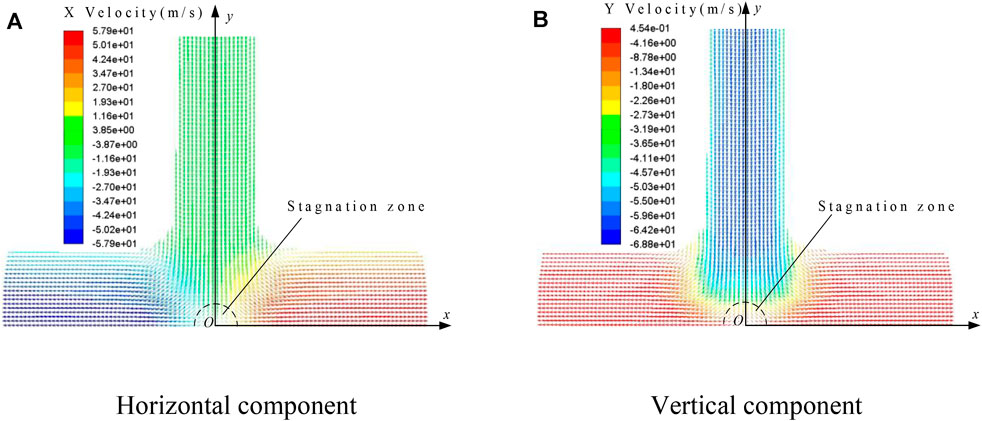
FIGURE 3. The vector diagram of the water jet velocity field without ultrasonic vibration (P = 4 MPa). (A) Horizontal component, (B) Vertical component.
Taking the surface of the workpiece as the reference system, the water flow velocities at 20 μm, 60 μm, and 100 μm from the surface of the workpiece are selected as the research object. When the nozzle inlet pressures are 4 MPa, 6 MPa, and 8 MPa, the changes of the velocity components Vx and Vy at four moments in a cycle without ultrasonic vibration and after ultrasonic vibration is introduced are analyzed, as shown in Figures 4A–I and Figures 5A–I.
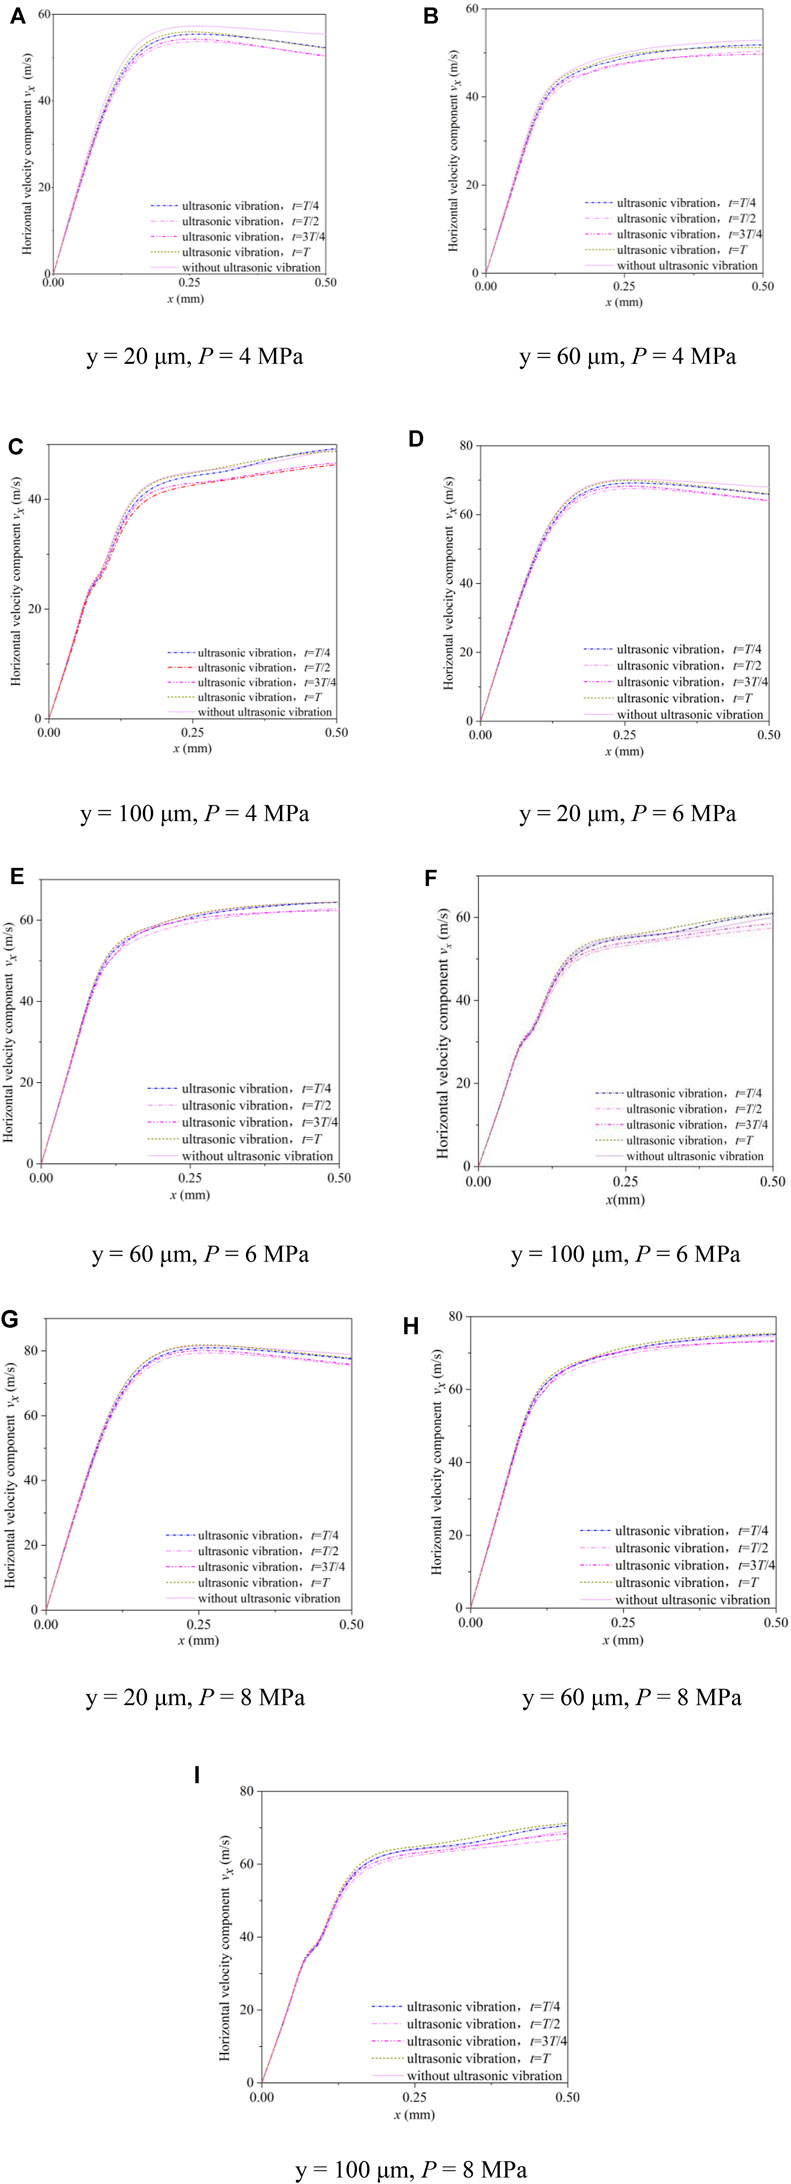
FIGURE 4. The horizontal component of the jet velocity near the surface of the workpiece. (A) y = 20 μm, P = 4 MPa, (B) y = 60 μm, P = 4 MPa, (C) y = 100 μm, P = 4 MPa, (D) y = 20 μm, P = 6 MPa, (E) y = 60 μm, P = 6 MPa, (F) y = 100 μm, P = 6 MPa, (G) y = 20 μm, P = 8 MPa, (H) y = 60 μm, P = 8 MPa, and (I) y = 100 μm, P = 8 MPa.
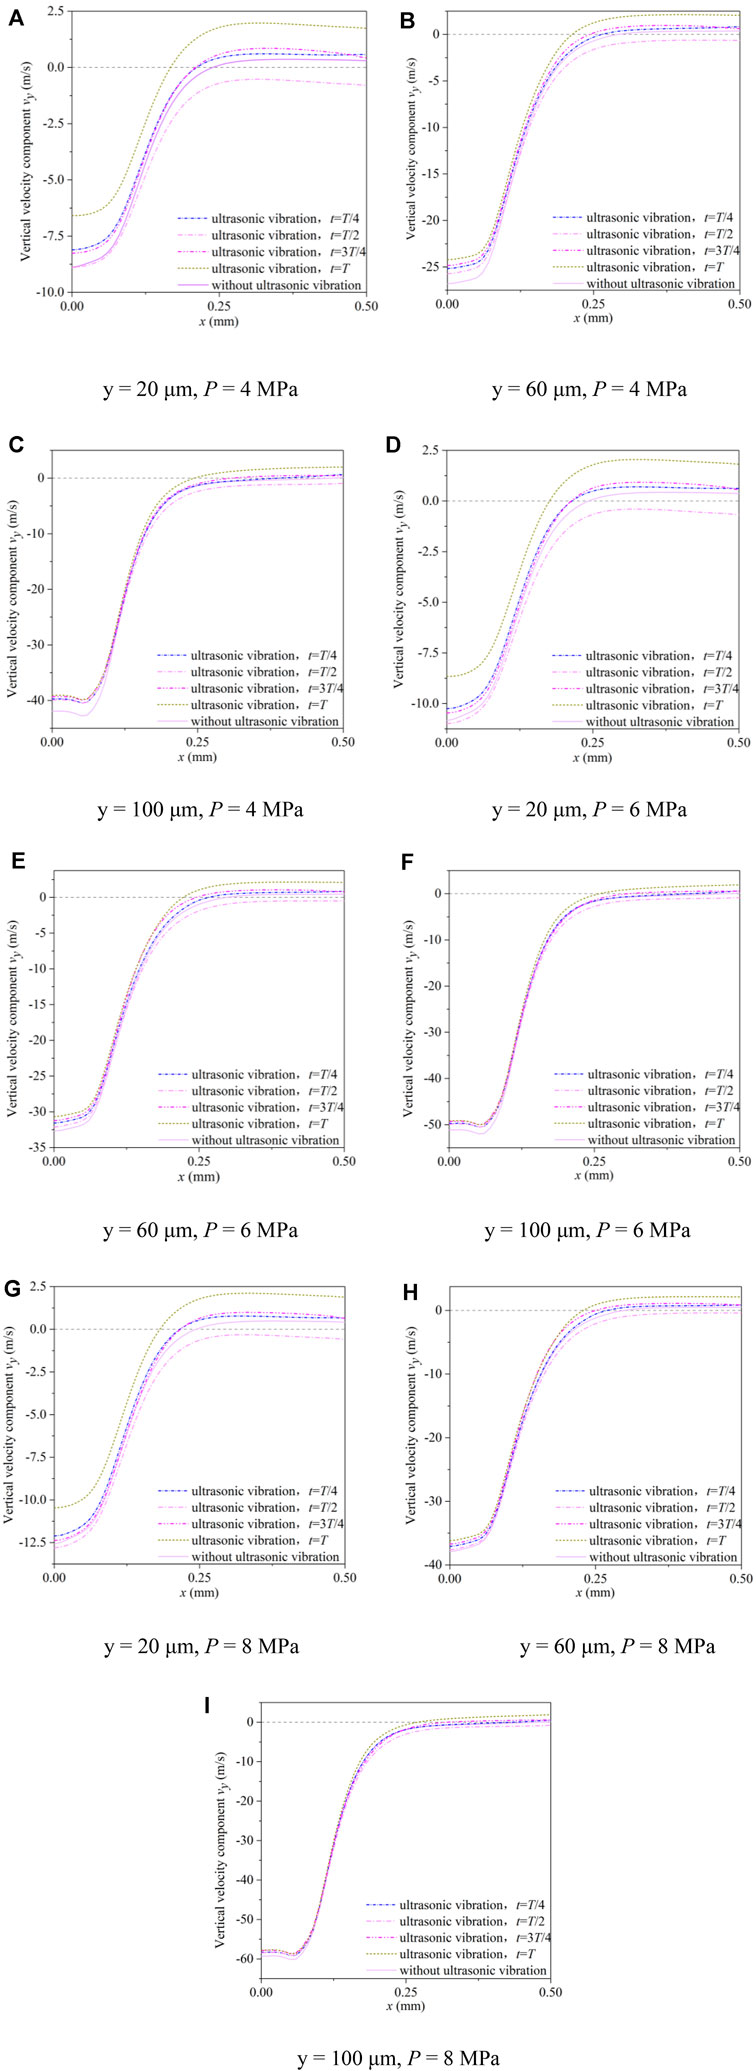
FIGURE 5. The vertical component of the jet velocity near the surface of the workpiece. (A) y = 20 μm, P = 4 MPa, (B) y = 60 μm, P = 4 MPa, (C) y = 100 μm, P = 4 MPa, (D) y = 20 μm, P = 6 MPa, (E) y = 60 μm, P = 6 MPa, (F) y = 100 μm, P = 6 MPa, (G) y = 20 μm, P = 8 MPa, (H) y = 60 μm, P = 8 MPa, (I) y = 100 μm, P = 8 MPa.
As displayed in Figure 4, after the introduction of the ultrasonic vibration, the horizontal component of the flow velocity shows a periodic change, which is slightly lower than that without ultrasonic vibration. The velocity components at time T and time T/4 are relatively close, and the velocity components at time T/2 and time 3T/4 are relatively close. In the region near the jet center, the horizontal component of the flow velocity changes linearly with the position, and the magnitude is almost independent of the ultrasonic vibration.
Figure 5 shows that when y = 20 μm, near the center of the jet, the vertical component of the flow velocity at T/4, 3T/4, and T in one period of ultrasonic vibration is smaller than that without ultrasonic vibration, and the vertical component of velocity at T is the smallest, while that at T/2 it is slightly larger than that without ultrasonic vibration. In the external flow field area far from the jet center, for the times T/4, 3T/4, and T without ultrasonic vibration, the direction of the vertical component of the velocity reverses. After the reverse, the velocity component at time T is the largest, and the velocity component is the smallest without ultrasonic vibration, close to 0. From Figure 5, it can also be found that in terms of the influence of the jet pressure on the vertical component of the flow velocity near the workpiece surface, the flow velocity in the central area of jet erosion increases obviously with the increase of the jet pressure, while the vertical component of the flow velocity at the periphery does not change obviously.
In the simulation, we study the variation of the velocities of 5 and 10 μm Al2O3 abrasive particles with the length of the moving path in the flow field, as shown in Figures 6A–F. We extract six of the particles as the research objects, of which the No. One abrasive particle is at the edge and the No. Six abrasive particle is in the middle. The abrasive particles with two sizes reach a stable velocity in the nozzle, and the velocity is independent of the particle size. When approaching the workpiece, the abrasive particle velocity decreases rapidly, but the abrasive particle velocity with a large particle size decreases more slowly.
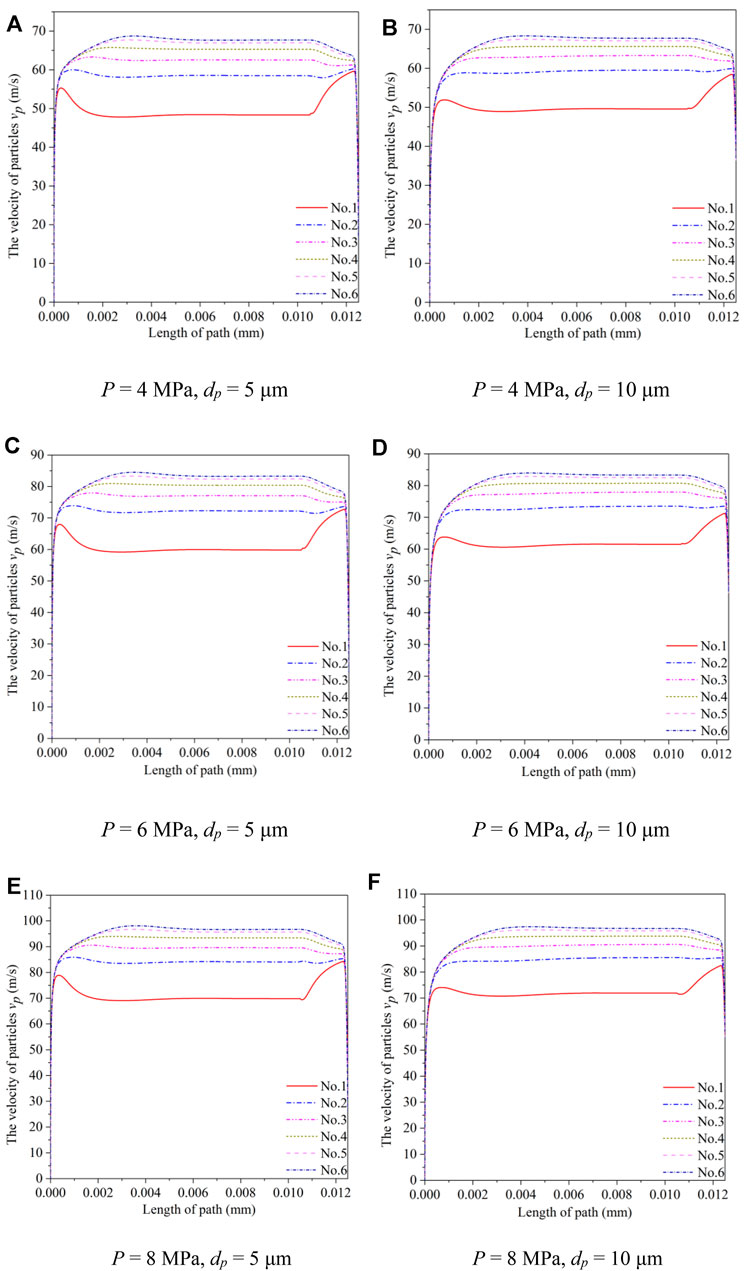
FIGURE 6. Velocity changes of abrasive particles of different sizes in the flow field along the movement path. (A) P = 4 MPa, dp = 5 μm, (B) P = 4 MPa, dp = 10 μm, (C) P = 6 MPa, dp = 5 μm, (D) P = 6 MPa, dp = 10 μm, (E) P = 8 MPa, dp = 5 μm, (F) P = 8 MPa, dp = 10 μm.
Figures 7, 8 show the velocities and angles of the No. one to six abrasive particles when they first collide with the workpiece in the jet field when the particle sizes are 5 and 10 μm. It can be seen from Figures 7, 8, that the initial impact velocity of the abrasive particles with a particle size of 5 μm gradually decreases from the edge of the jet to the center of the jet. When the abrasive particles first exit the nozzle, the velocity of the abrasive particles at the center of the jet is larger than that at the edge, indicating that the 5 μm abrasive particles lose a large amount of energy when passing through the stagnation zone of the jet, and the closer it is to the center, the greater the loss is. The collision angle increases gradually from the edge to the center, which is caused by the following effect of the abrasive particles on the fluid motion. When the particle size is 10 μm, the initial collision velocity of the abrasive particles is almost the same from the edge to the center, indicating that when the 10 μm abrasive particles pass through the stagnation zone, the velocity loss is not as large as that when the particle size is 5 μm. The collision angle also increases gradually from the edge to the center, but the change is relatively small. Comparing the impact velocities and angles of the 5 and 10 μm abrasive particles, it can be found that the impact velocity of the 10 μm abrasive particles is significantly greater than that of 5 μm abrasive particles for the same conditions, which is also consistent with the calculation results of the kinetic energy formula. It can be seen from Figure 8 that the maximum collision angle of the 10 μm abrasive particles reaches 88.31°, which is close to the vertical collision. Therefore, the 10 μm abrasive particles are more likely to cause the removal of brittle mode materials on the workpiece surface than the 5 μm abrasive particles.
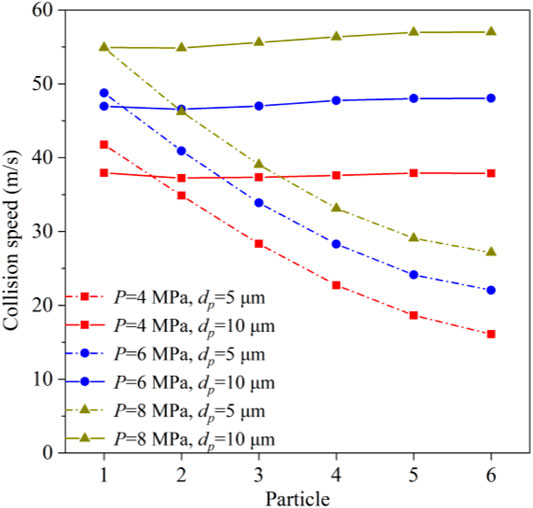
FIGURE 7. Collision speed of abrasive particles of two sizes.
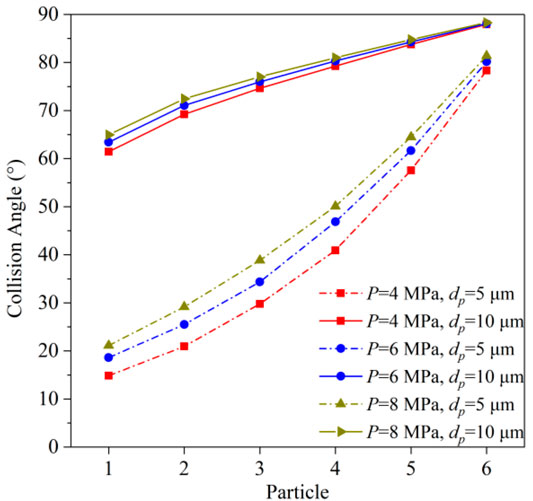
FIGURE 8. Collision angle of abrasive particles of two sizes.
Figures 9A–C reflect the changes of the angle of 5 μm abrasive particles before and after the introduction of ultrasonic vibration in the jet field with inlet pressures of 4 MPa, 6 MPa, and 8 MPa.
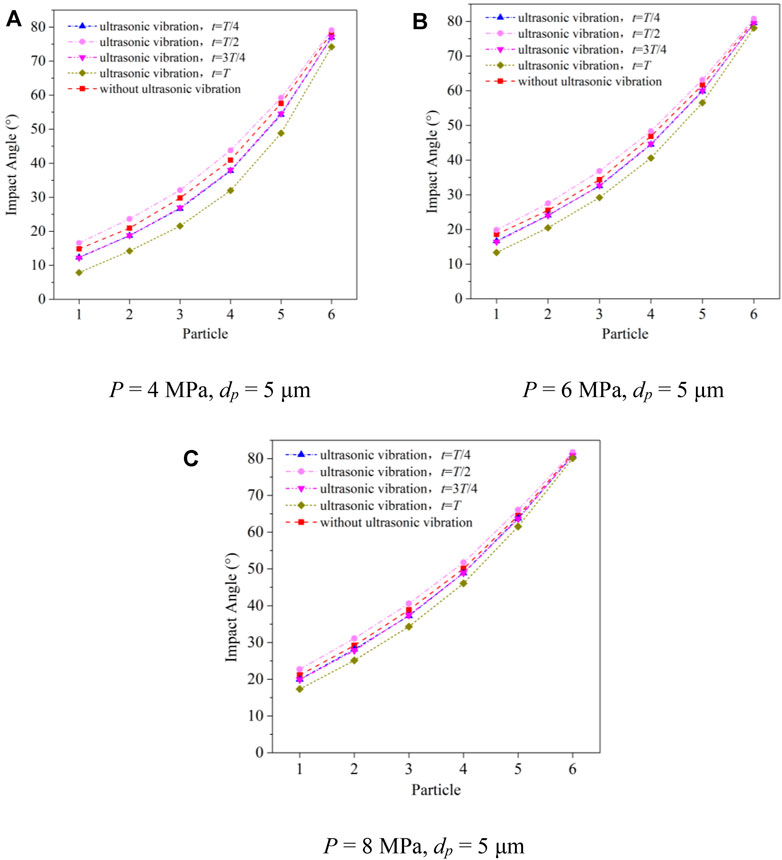
FIGURE 9. Effect of ultrasonic vibration on the collision angle of the abrasive particles in the jet field. (A) P = 4 MPa, dp = 5 μm, (B) P = 6 MPa, dp = 5 μm, (C) P = 8 MPa, dp = 5 μm.
From Figures 9A–C, it can be found that the initial impact angle of the abrasive particles is the smallest at time T and the largest at time T/2. At the same time, the initial impact angle of each abrasive particle at T/2 is larger than that without ultrasonic vibration, which has a positive effect on improving the “W” bottom morphology formed by micro-abrasive water jet erosion.
Comparing Figures 10A–C,D–F, it can be found that when the 10 μm abrasive particles are used, the material erosion rate in the stagnation zone is not much different from that around. When 5 μm abrasive particles are used, the material erosion rate in the central region is significantly lower than that in the surrounding area. It can also be found from the figure that the maximum material erosion rate of the workpiece surface caused by 10 μm abrasive particles is significantly greater than that caused by 5 μm abrasive particles, but the erosion area is smaller than that caused by 5 μm abrasive particles. This is because, in the jet field, the 10 μm abrasive particles can maintain a large impact angle and velocity, and the distribution of the abrasive particle angles and velocities at different radial positions of the jet is more uniform, so it is more prone to material removal in the brittle mode. Through the calculation of momentum equilibration numbers, we find that the small abrasive particles with the average diameter of 5 μm are more likely to follow the fluid flow streamlines and these particles deflect larger angle when impacting workpiece surface. While the average diameter of 10 μm under same experimental conditions are more likely to keep the original state of motion and impact the workpiece in a vertical direction. It is theoretically explained that the holes processed by abrasives with smaller sizes have larger diameters.
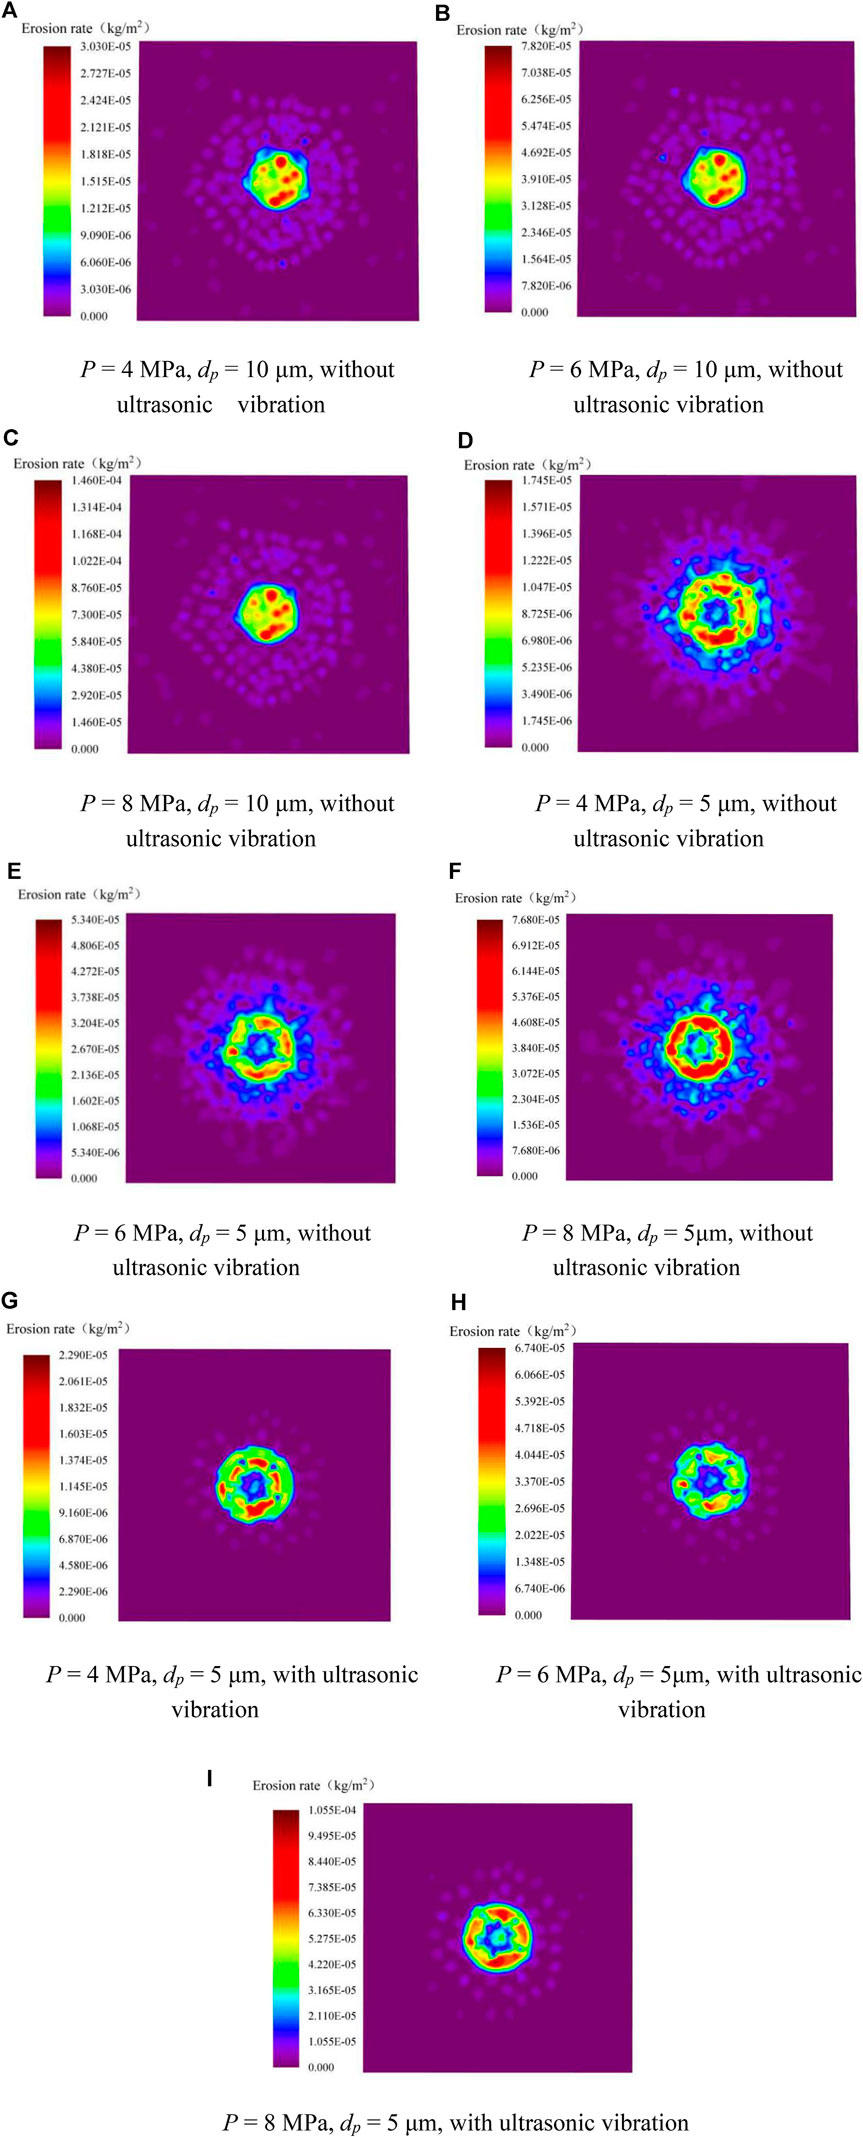
FIGURE 10. Cloud map of material erosion rate on the workpiece surface. (A) P = 4 MPa, dp = 10 μm, without ultrasonic vibration, (B) P = 6 MPa, dp = 10 μm, without ultrasonic vibration, (C) P = 8 MPa, dp = 10 μm, without ultrasonic vibration, (D) P = 4 MPa, dp = 5 μm, without ultrasonic vibration, (E) P = 6 MPa, dp = 5 μm, without ultrasonic vibration, (F) P = 8 MPa, dp = 5 μm, without ultrasonic vibration, (G) P = 4 MPa, dp = 5 μm, with ultrasonic vibration, (H) P = 6 MPa, dp = 5 μm, with ultrasonic vibration, (I) P = 8 MPa, dp = 5 μm, with ultrasonic vibration.
Figures 10 D–F,G–I illustrate the fact that when 5 μm abrasive particles are applied to the workpiece, the material erosion rate in the direct impact area of the jet is significantly increased compared with that without ultrasonic vibration. The maximum erosion rate increases most obviously when the inlet pressure is 8 MPa. After calculation, it is determined that the increase is up to 37%, and the distribution of erosion is more uniform. However, the diameter of the erosion area caused by the abrasive particles on the surface of the workpiece is significantly reduced, which also indicates that the erosion of the workpiece by the jet is more concentrated after the ultrasonic vibration is applied.
To achieve higher precision for the abrasive water jet processing of micro-holes, the corresponding processing device is designed and built independently, as shown in Figure 11. The device is composed of an abrasive water jet generating device, an ultrasonic vibration platform, and a three-dimensional motion platform. The pressurized equipment of this device is a diaphragm metering pump (LDB1/M910S) purchased from Germany. To carry out long-term stable processing and correct the pressure pulse fluctuation state of the metering pump at the same time, we install a pulse damper at the outlet of the pump. The nozzle connected with the hose is loaded on a three-dimensional motion platform with a fixture. The platform can achieve 0.001 mm precision control in the three directions of x, y, and z, which is convenient for adjusting the target distance between the nozzle and the workpiece. The workpiece is clamped on the ultrasonic vibration platform below the nozzle. The ultrasonic vibration platform has a vibration frequency of 20 kHz and the amplitude can be adjusted by itself. In all experiments, the ultrasonic vibration platform maintains an amplitude of 20 μm, and the distance between the workpiece and the nozzle is 2 mm. The remaining experimental parameters, including the jet pressure, and processing time are attached in Tables 1, 2.
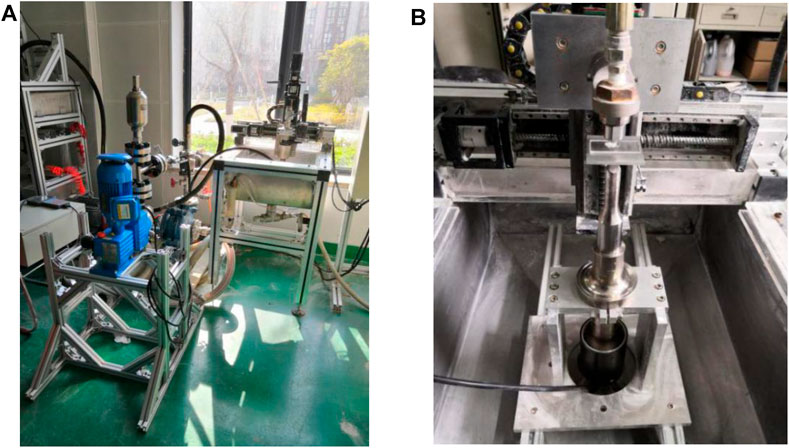
FIGURE 11. (A) Abrasive water jet integral device and (B) ultrasonic vibration device.

TABLE 1. Material properties of K9 glass for experiment.
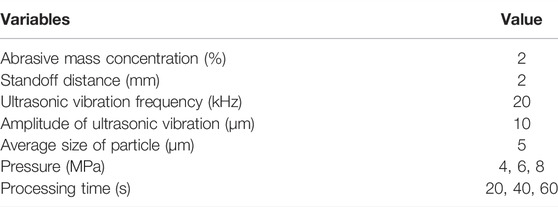
TABLE 2. Experimental process parameters and values.
The experimental design is explained as follows. Using alumina abrasive with an average particle size of five microns, the experimental processing time is divided into 20, 40, and 60 s. The water jet pressures are 4 MPa, 6 MPa, and 8 MPa. There are nine combinations. Then these nine combinations are tested independently with and without ultrasonic vibration. For the tests with these 18 conditions, each experiment needs to be repeated at least five times. The data obtained in each experiment is tested with a KEYENCE three-dimensional laser measuring microscope and the average value is taken, including the cross-section and bottom morphologies of the micropores, for further comparison and analysis.
Based on the selected three sets of experimental photographs shown in Figure 12 (images taken with a KEYENCE VHX-600E ultra-depth-of-field 3D microscope), it can be seen that the depth of the micro-hole increases significantly after the ultrasonic vibration is added, especially when the jet pressure is 8 MPa and the processing time is 60 s, and the depth increases by 52.4%. It can be seen from Figure 13 that for the selected case of 8 MPa and 60 s with vibration, there is a good agreement between the simulation data and the experimental data in the two-dimensional section. In addition, to more intuitively analyze the proximity of the prediction model, a three-dimensional diagram of the deviation between the prediction model and the experimental data is created, and the mean square deviation is marked in the figure. After completing the experiment of an ultrasonic-assisted micro-abrasive water jet impacting K9 glass, we determine whether non-ultrasonic vibration and the changing of the amplitude have a better effect on the machining process, and a series of simulation calculations are carried out with our proposed prediction model.
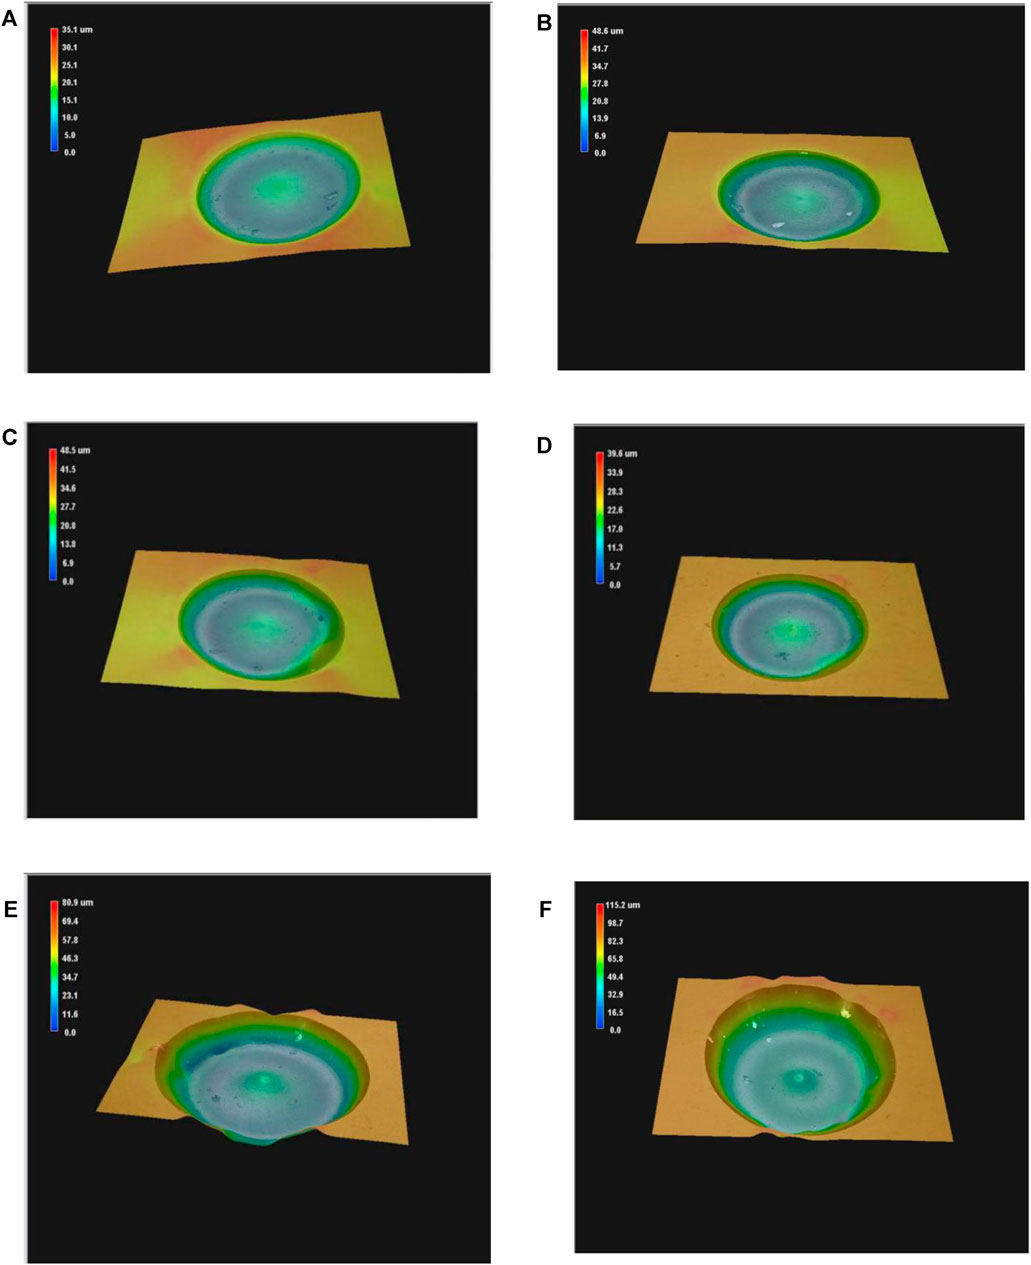
FIGURE 12. Machining performance of micro-holes under experimental conditions: (A) P = 4 MPa; t = 60 s and without ultrasonic vibration; (B) P = 4 MPa; t = 60 s and with ultrasonic vibration; (C) P = 6 MPa; t = 40 s and without ultrasonic vibration; (D) P = 6 MPa; t = 40 s and with ultrasonic vibration; (E) P = 8 MPa; t = 60 s and without ultrasonic vibration; (F) P = 8 MPa; t = 60 s and with ultrasonic vibration.
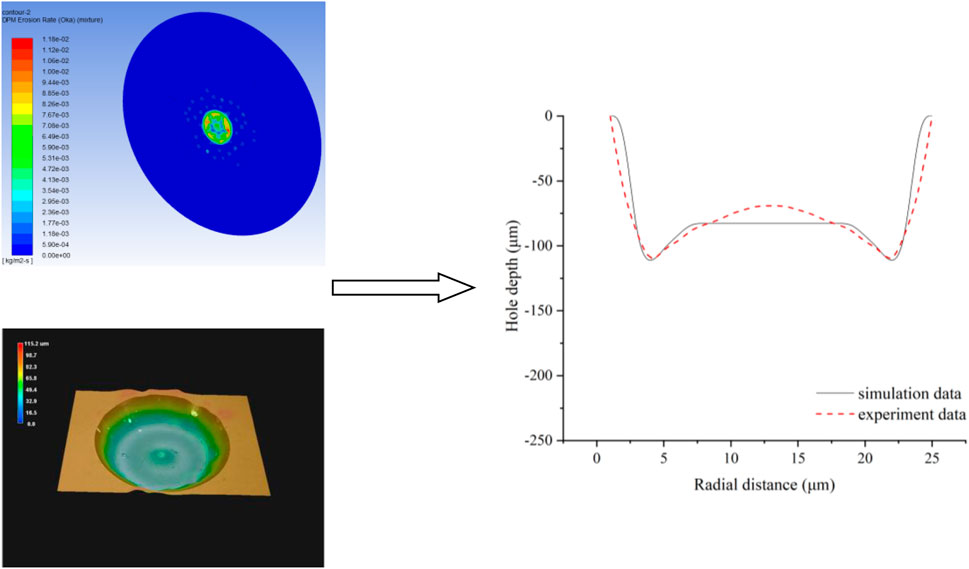
FIGURE 13. Two-dimensional cross-sections of the simulation data and the experimental data under the experimental conditions of 8 MPa and 60 s with vibration.
In Figure 12, it can be seen that when 5 μm abrasive is used to impact the workpiece, the cross-sections of the micro-holes at 4 MPa, 6 MPa, and 8 MPa all show a “W” shape. However, it can also be found that for the same experimental conditions, the addition of ultrasonic vibration to the workpiece not only increases the depth of the micro-holes but also improves the quality and morphology of the bottom surface. More of the material at the center of the micro-holes is removed to form a flatter “W”-shaped profile. In the experiment, we calculate the energy threshold to judge the material removal mechanism. With the change of pressure, the change of abrasive particle size and the introduction of ultrasonic vibration, the material removal mechanism also changed correspondingly. According to our research, the ultrasonic vibration velocity is far less than the abrasive impact velocity, so it has little effect on the kinetic energy. Ultrasonic vibration has more influence on particle trajectory (Qi et al., 2021). In the experiment, due to inevitable factors such as the particle-to-particle collision and particle size, the prediction model often has large deviations. After our further improvement of the various conditions, in Figure 14, as shown for the nine groups experimental data, the deviation value from the simulation data, the variance value relative to the depth and diameter of the micro-holes, the deviation value, and the root-mean-square value of each group of experiments are kept within a good range. Therefore, the prediction model can predict the experiment well.
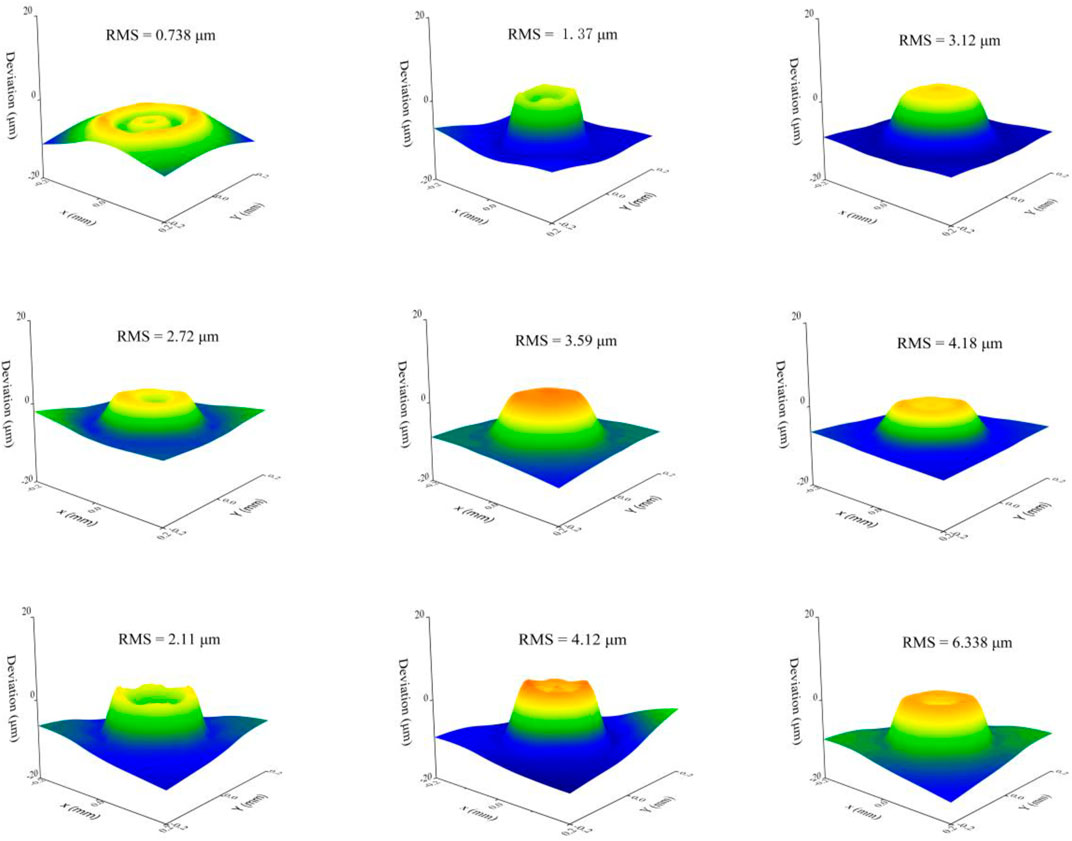
FIGURE 14. Experimental data and simulation deviation values for nine combinations and root-mean-square values.
After obtaining a high-quality prediction model, we change the dynamic mesh motion frequency of the prediction model while keeping the processing conditions such as the amplitude, pressure, and incident angle unchanged. Through the cross-sectional section shown in Figure 15, the vibration frequency can be found. For the cases of the low frequencies of 0.5, 1, and 10 kHz, the depth and the morphology of the workpiece are consistent with the results of the ultrasonic vibrations at 20 and 40 kHz.
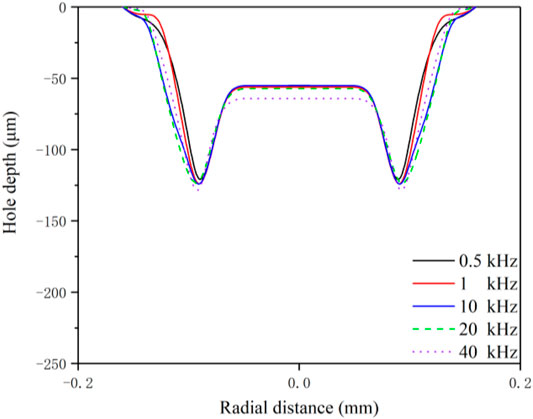
FIGURE 15. Comparison of cross-section profiles with respect to different vibrational frequencies.
As shown in Figure 16, we adjust the amplitude of the moving mesh while keeping the other conditions unchanged. It can be seen from the figure that the removal rate of the W-shaped middle convex part at the bottom of the workpiece is increased, and the bottom processing efficiency has an amplitude of 60 μm. The processing efficiency of the bottom bump with an amplitude of 10 μm is increased by about 41%. In micro-abrasive water jet processing, Qi et al. introduced a vivid term in the w-shaped middle protrusion, called a hump peak (Qi et al., 2021). The ratio of the hump peak to the depth of the micro-holes decreased, which meant that the material removal rate increased, and the bottom surface of the micro-holes became flatter. This factor plays an important role in obtaining better-processed micro-holes.
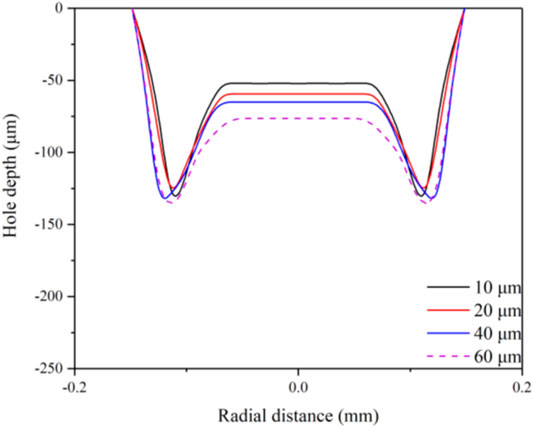
FIGURE 16. Comparison of cross-section profiles with respect to different vibrational amplitudes.
Based on the above analysis, it is obvious that the prediction model we designed has extremely high accuracy. It can be used to guide future experiments. The impact of the vibration frequency and amplitude changes obtained with the prediction model on the processing effect could allow researchers to have a more effective and reliable plan for the selection of the vibration frequency and amplitude of auxiliary processing for the same type of micro-abrasive water jet processing in the future.
To effectively predict the machining of hard and brittle materials with an ultrasonic vibration-assisted micro-abrasive water jet, a mixture model, standard k-ε model, discrete phase model, and dynamic mesh model are used to analyze the effects of the ultrasonic vibration on the static pressure, jet velocity field, abrasive particle motion state, and material erosion rate in the stagnation zone. Through the mathematical model established, we find ultrasonic vibration has a significant influence on the jet velocity field, abrasive particle motion state, and the static pressure in the stagnation zone of the jet is generally smaller than that without ultrasonic vibration. At the same time, the erosion rate increased significantly. By comparing the experimental data with the simulation data, the mean square difference is calculated to confirm the accuracy of the model. Next, the model was used to further analyze the optimal frequency of ultrasonic-assisted machining and the influence of the amplitude on the machining effect. The simulation results showed that in the experiment, the increase in amplitude could effectively increase the machining efficiency and improve the bottom flatness. However, the results were favorable when the vibration frequency was lower. These conclusions could provide effective guidance for future similar ultrasonic vibration-assisted machining experiments.
The raw data supporting the conclusion of this article will be made available by the authors, without undue reservation.
Conceptualization, ZF; Data curation, ZC; Formal analysis, ZC; Investigation, ZC; Software, SQ; Writing—original draft, ZC; Writing—review and editing, ZF.
This research was funded by Public Welfare Technology Application Research Project of Zhejiang Province under Grant No. LGG20E050020.
The authors declare that the research was conducted in the absence of any commercial or financial relationships that could be construed as potential conflicts of interest.
All claims expressed in this article are solely those of the authors and do not necessarily represent those of their affiliated organizations, or those of the publisher, the editors and the reviewers. Any product that may be evaluated in this article, or claim that may be made by its manufacturer, is not guaranteed or endorsed by the publisher.
Anwar, S., Axinte, D. A., and Becker, A. A. (2013). Finite Element Modelling of Overlapping Abrasive Waterjet Milled Footprints. Wear 303, 426–436. doi:10.1016/j.wear.2013.03.018
Beaucamp, A., Katsuura, T., and Takata, K. (2018). Process Mechanism in Ultrasonic Cavitation Assisted Fluid Jet Polishing. CIRP Ann. 67, 361–364. doi:10.1016/j.cirp.2018.04.075
Chen, H., Xu, Q., Wang, J., Li, P., Yuan, J., Lyu, B., et al. (2021). Effect of Surface Quality on Hydrogen/helium Irradiation Behavior in Tungsten. Nucl. Eng. Tech. In Press. doi:10.1016/j.net.2021.12.006
Espulgar, W., Aoki, W., Ikeuchi, T., Mita, D., Saito, M., Lee, J.-K., et al. (2015). Centrifugal Microfluidic Platform for Single-Cell Level Cardiomyocyte-Based Drug Profiling and Screening. Lab. Chip 15, 3572–3580. doi:10.1039/c5lc00652j
Hu, W., Teng, Q., Hong, T., Saetang, V., and Qi, H. (2022). Stress Field Modeling of Single-Abrasive Scratching of BK7 Glass for Surface Integrity Evaluation. Ceramics Int. 48, 12819–12828. doi:10.1016/j.ceramint.2022.01.153
Huang, C. Z., Hou, R. G., Wang, J., Lu, X. Y., and Zhu, H. T. (2007). Three-dimensional Simulation of Liquid-Solid Two-phase Flow inside the Abrasive Water Jet Nozzle. Key Eng. Mater. 329, 329–334. doi:10.4028/www.scientific.net/kem.329.329
Ji, R., Zhang, L., Zhang, L., Li, Y., Lu, S., and Fu, Y. (2022). Processing Method for Metallic Substrate of Liquid Metal Lapping-Polishing Plates. Front. Mater. 9, 896346. doi:10.3389/fmats.2022.896346
Lee, J.-W., Ha, S.-J., Cho, Y.-K., Kim, K.-B., and Cho, M.-W. (2015). Investigation of the Polishing Characteristics of Metal Materials and Development of Micro MR Fluid Jet Polishing System for the Ultra Precision Polishing of Micro Mold Pattern. J. Mech. Sci. Technol. 29, 2205–2211. doi:10.1007/s12206-015-0136-8
Li, T., Takahata, K., and Gianchandani, Y. (2021). “Chapter 4 - Batch Mode Microelectro-Discharge Machining,” in Micro Electro-Fabrication. Editors T. Saleh, M. S. Mohamed Ali, and K. Takahata (Elsevier), 89–114. doi:10.1016/b978-0-12-820049-0.00003-7
Li, W., Wang, J., Zhu, H., and Huang, C. (2014). On Ultrahigh Velocity Micro-particle Impact on Steels - A Multiple Impact Study. Wear 309, 52–64. doi:10.1016/j.wear.2013.10.011
Liu, Z., Nouraei, H., Spelt, J. K., and Papini, M. (2015). Electrochemical Slurry Jet Micro-machining of Tungsten Carbide with a Sodium Chloride Solution. Precision Eng. 40, 189–198. doi:10.1016/j.precisioneng.2014.11.009
Mccarthy, M. J., and Molloy, N. A. (1974). Review of Stability of Liquid Jets and the Influence of Nozzle Design. Chem. Eng. J. 7, 1–20. doi:10.1016/0300-9467(74)80021-3
Narayanan, C., Balz, R., Weiss, D. A., and Heiniger, K. C. (2013). Modelling of Abrasive Particle Energy in Water Jet Machining. J. Mater. Process. Tech. 213, 2201–2210. doi:10.1016/j.jmatprotec.2013.06.020
Nguyen, T., Liu, D., Thongkaew, K., Li, H., Qi, H., and Wang, J. (2018). The Wear Mechanisms of Reaction Bonded Silicon Carbide under Abrasive Polishing and Slurry Jet Impact Conditions. Wear 410-411, 156–164. doi:10.1016/j.wear.2018.06.001
Qi, H., Qin, S., Cheng, Z., Teng, Q., Hong, T., and Xie, Y. (2021). Towards Understanding Performance Enhancing Mechanism of Micro-holes on K9 Glasses Using Ultrasonic Vibration-Assisted Abrasive Slurry Jet. J. Manufacturing Process. 64, 585–593. doi:10.1016/j.jmapro.2021.01.048
Qi, H., Shi, L., Teng, Q., Hong, T., Tangwarodomnukun, V., Liu, G., et al. (2022). Subsurface Damage Evaluation in the Single Abrasive Scratching of BK7 Glass by Considering Coupling Effect of Strain Rate and Temperature. Ceramics Int. 48, 8661–8670. doi:10.1016/j.ceramint.2021.12.077
Qi, H., Wen, D., Lu, C., and Li, G. (2016). Numerical and Experimental Study on Ultrasonic Vibration-Assisted Micro-channelling of Glasses Using an Abrasive Slurry Jet. Int. J. Mech. Sci. 110, 94–107. doi:10.1016/j.ijmecsci.2016.03.013
Qi, H., Wen, D., Yuan, Q., Zhang, L., and Chen, Z. (2017). Numerical Investigation on Particle Impact Erosion in Ultrasonic-Assisted Abrasive Slurry Jet Micro-machining of Glasses. Powder Tech. 314, 627–634. doi:10.1016/j.powtec.2016.08.057
Yeo, L. Y., Chang, H.-C., Chan, P. P. Y., and Friend, J. R. (2011). Microfluidic Devices for Bioapplications. Small 7, 12–48. doi:10.1002/smll.201000946
Keywords: abrasive water jet, ultrasonic vibration, jet velocity field, root mean square, static pressure distribution
Citation: Cheng Z, Qin S and Fang Z (2022) Numerical Modeling and Experimental Study on the Material Removal Process Using Ultrasonic Vibration-Assisted Abrasive Water Jet. Front. Mater. 9:895271. doi: 10.3389/fmats.2022.895271
Received: 13 March 2022; Accepted: 29 March 2022;
Published: 25 April 2022.
Edited by:
Guijian Xiao, Chongqing University, ChinaReviewed by:
Qingyu Yao, University of New South Wales, AustraliaCopyright © 2022 Cheng, Qin and Fang. This is an open-access article distributed under the terms of the Creative Commons Attribution License (CC BY). The use, distribution or reproduction in other forums is permitted, provided the original author(s) and the copyright owner(s) are credited and that the original publication in this journal is cited, in accordance with accepted academic practice. No use, distribution or reproduction is permitted which does not comply with these terms.
*Correspondence: Zhufang Fang, ZmFuZ3podWZhbmdAemp1dC5lZHUuY24=
Disclaimer: All claims expressed in this article are solely those of the authors and do not necessarily represent those of their affiliated organizations, or those of the publisher, the editors and the reviewers. Any product that may be evaluated in this article or claim that may be made by its manufacturer is not guaranteed or endorsed by the publisher.
Research integrity at Frontiers
Learn more about the work of our research integrity team to safeguard the quality of each article we publish.