
94% of researchers rate our articles as excellent or good
Learn more about the work of our research integrity team to safeguard the quality of each article we publish.
Find out more
ORIGINAL RESEARCH article
Front. Mater. , 18 May 2022
Sec. Structural Materials
Volume 9 - 2022 | https://doi.org/10.3389/fmats.2022.888909
 Haytham F. Isleem1*
 Bassam A. Tayeh2
 Muhammad Abid3
 Mudassir Iqbal4Abdeliazim M. Mohamed5,6Mohammed Galal El Sherbiny7
The use of fiber-reinforced polymer (FRP) bars to overcome the corrosion problems in various reinforced concrete structures is now well documented in the literature. As a result, the currently available design guidelines such as North American design codes allow for using the FRP bars as alternative materials to steel bars to be incorporated into the concrete structures. In practice, hollow-core concrete columns (HCCs) are widely accepted to make a lightweight structure and reduce its cost. Due to the lack of laboratory tests, engineers may not perform a safe design of HCCs with internal FRP bars. Therefore, the presented paper has endeavored to numerically and theoretically explore using the FRP bars and spirals as internal reinforcement for HCCs and investigate the effects of several test parameters. Using the current version of Finite Element Analysis (FEA) ABAQUS (3DS, 2014), a total of 116 HCCs were simulated based on 29 specimens experimentally tested by the researchers which acted as control specimens for the FE model. The complex structural response of concrete was reasonably determined using the concrete damaged plasticity model (CDPM) and the mechanical response of the FRP rebars are considered to behave linearly up to failure with no yielding stage. The calibrated FE model can provide an excellent portrayal of the HCCs’ response. Based on the database obtained from laboratory and simulation, several Artificial Neural Network (ANN) models were further provided to predict the confined compressive load of GFRP-RC HCCs at different loading stages.
• Axial compressive behavior of GFRP-RC hollow-core concrete columns
• Evaluation of existing strength models
• Effects of key test parameters
• Artificial Neural Network (ANN) model development
Reinforced concrete (RC) structures deteriorate in corrosive and aggressive environments, resulting in reduced service life and high annual repair costs. To overcome these problems, the fiber-reinforced polymer (FRP) as a noncorrosive material by nature is a promising solution to make durable RC structures (Isleem et al., 2018). In this regard, initially established design codes and guidelines are available elsewhere [i.e., (ACI, 2015; CSA S806–12, 2012; ACI, 2006)], and many studies are still nowadays introducing new tests and models regarding the compressive behavior of concrete columns with glass or carbon fiber-reinforced polymer bars (GFRP or CFRP) [i.e., (Alsayed et al., 1999; Paramanantham, 1993; Lotfy, 2010; De Luca et al., 2010; Pantelides et al., 2013; Mohamed et al., 2014; Elmessalami et al., 2019; Elchalakani et al., 2020; Afifi et al., 2013; Hadi et al., 2016; Afifi et al., 2014a; Afifi et al., 2014b; Afifi et al., 2015; Tobbi et al., 2012; Tobbi et al., 2014; Maranan et al., 2016; Hadhood et al., 2017a; Hadhood et al., 2016; Hadhood et al., 2017c; Hadhood et al., 2017b; Ahmad et al., 2021; Hadi et al., 2020; AlAjarmeh et al., 2019a; AlAjarmeh et al., 2019b; AlAjarmeh et al., 2020)]. The compressive behavior of GFRP-reinforced solid circular concrete columns was significantly investigated in most of these studies and it was generally concluded that the compression behavior of concrete columns reinforced with glass FRP reinforcements has been similar to that with steel, but with less contribution of FRP longitudinal bars to the overall column’s strength capacity [i.e., (Paramanantham, 1993; Alsayed et al., 1999; De Luca et al., 2010; Lotfy, 2010; Afifi et al., 2013; Pantelides et al., 2013; Mohamed et al., 2014; Hadi et al., 2016; Elmessalami et al., 2019; Elchalakani et al., 2020)]. More specifically, the load-carrying capacity of the columns possessing GFRP reinforcement exhibited a reduction of about 13–16% compared with that of the steel-reinforced columns. Also, the GFRP longitudinal bars contribute to the overall load-carrying capacity of the RC columns with about 3–10%, whereas that given by the same amount of reinforcing steel bars is about 12–16%. Circular columns reinforced with GFRP helices and columns with the same amount of steel helices can provide almost similar levels of ductility and strength enhancements (Hadi et al., 2016). Moreover, the axial capacities of the carbon FRP-reinforced columns were on average 5% lower than the steel-reinforced columns, and the CFRP bars revealed about 13% of the load-carrying capacity of the columns, which is close enough to the contribution made by the steel reinforcement (16%) (Afifi et al., 2014a). Generally, it was reported that the columns reinforced with CFRP stirrups attained higher confined concrete strength than with GFRP (Tobbi et al., 2012; Tobbi et al., 2014).
Materials in the construction are a major expense, so minimizing the overall weight of the structure provides opportunities for reducing costs. In civil infrastructures including bridge piers, ground piles, and utility poles, hollow-core RC columns (HCCs) are widely used, constructed with a small amount of concrete in the columns themselves and their underlying foundations. However, the corrosion of internal steel reinforcement in hollow-core reinforced concrete columns is a major concern due to the thin wall of the columns. To overcome such problems, FRP bars have been also used in hollow-core concrete columns and their design requires careful consideration of critical factors, such as the amount of confinement, and concrete compressive strength [i.e., (Zahn et al., 1990; Mo et al., 2003; Lignola et al., 2007; Lee et al., 2015; Liang et al., 2015)]. The adequacy and application of these members depend on the cost of concrete material, strength-to-mass ratio, self-wight, and the stiffness-to-mass ratio [i.e., (Lignola et al., 2007; Kusumawardaningsih and Hadi, 2010)]. Hollow-core concrete columns reinforced with largely-spaced spirals exhibited brittle behavior, and the premature buckling of longitudinal bars leads to reduced ductility (Lignola et al., 2007). Based on experimental tests and observations, it was demonstrated by Lee et al. (2015) that when the spacing of the lateral reinforcement is reduced from 80 to 40 mm, the ductility increases by about 20% and there is limited damage in the inner concrete core. Moreover, (Mo et al. (2003) found that HCCs with concrete compressive strength increasing from 30 to 50 MPa exhibited stiffer compression resistance, but their deformation capacity was reduced by about 50% because of the faster crack propagation and concrete splitting. The deformation capacity of the columns is significantly influenced and their failure mode pattern is found to be dependent on the grade of the concrete strength.
Moreover, the aspect ratio (length to cross-sectional depth) is one of the major test aspects that affect the seismic performance of the HCCs. The mechanical response of the HCCs and its failure mode pattern also depends on the amount of internal longitudinal reinforcement [i.e., (Hoshikuma and Priestley, 2000; Paolino, 2017)]. According to the literature, several studies have investigated the mechanical behavior of steel-reinforced HCCs under different loading types [i.e., (Osada et al., 1999; Yeh et al., 2001; Yeh et al., 2002; Mo et al., 2003; Pinto et al., 2003; Pavese et al., 2004; Lee et al., 2015)]. It was confirmed that the compression behavior and its stress-strain response depend on the ratio of an inner void to the outer core diameter of the HCCs (i.o), axial-loading ratio, longitudinal reinforcement ratio, and the amount of the hoop confinement. For example, keeping the test variables constant except for the increase in the i.o ratio causes a decrease in the deformation capacity of steel-reinforced HCCs. When the peak capacity of the specimens is reached, the axial load-carrying capacity is suddenly dropped due to shear stresses developed in the HCCs [i.e., (Turmo et al., 2009; Cassese et al., 2019)]. This strength loss was more pronounced for the HCCs with higher i.o ratios [i.e., (Zahn et al., 1990; Lee et al., 2015)]. Due to buckling failure and limited axial strains developed in the steel bars, the HCCs did not exhibit a post-loading stage. Instead, the buckling of the longitudinal steel reinforcement causes cracking and crushing of the concrete material [i.e., (Kusumawardaningsih and Hadi, 2010; Hadi and Le, 2014)].
On the one hand, replacement of the steel bars and helices in the steel-reinforced hollow-core circular columns with the same amount of GFRP bars and helices achieved higher confinement effectiveness of about 15% and ductility of about 4% more (Hadi et al., 2020). AlAjarmeh et al. (2019a) have explored the potential impact of GFRP bars and spirals on the axial compression behavior of hollow-core circular RC columns. The study concentrated on assessing the influence of increasing the inner-to-outer diameter ratio from 0 to 90 mm. Based on the experimental tests, it was found that the behavior changed from a brittle manner to a pseudo-ductile manner when the i.o ratio was increased up to 0.36. The GFRP reinforced HCCs had higher deformation and confinement efficiency compared to the GFRP-reinforced solid columns and steel-reinforced HCCs. The deformation and strength capacities of the hollow-core concrete columns were 74% and 21% higher than those of the solid ones. Moreover, after spalling of the concrete cover, the failure of the HCCs with an i.o ratio of 0.16 and 0.26 was controlled by the damage of the GFRP reinforcement, while the failure of HCCs with an i.o ratio of 0.36 was mainly due to crushing of the concrete core.
Many researchers also performed finite element (FE) simulations on GFRP reinforced solid concrete columns tested under various loading types [i.e., (Chellapandian et al., 2018; Elchalakani et al., 2018; Raza et al., 2019; Isleem et al., 2021a; Raza et al., 2021)]. Raza et al. (2021) have recently performed FE analysis using the ABAQUS software (3DS, 2014) to simulate the structural performance of GFRP-RC HCCs and this model is calibrated for a wide range of material and column section properties using the same test responses. These models are found to successfully capture the structural response of FRP-RC columns accurately. The FE modeling can overcome all the deficiencies of the analytical models. Developing computational FE models that can accurately simulate the complex behavior of FRP-RC columns can also save time and cost as compared with new tests that need to be conducted (Shi et al., 2012). To simplify and speed up the FE simulation, it may be necessary to make some assumptions, but it is also essential to implement the actual environments of the experimental tests during the FE simulation. There should be a balance between the model’s complexities, types, and sizes of implemented elements to reduce the time consumed by the FE analysis and also to obtain high accuracy in the numerical findings. Strong background knowledge of the FE simulation is the most efficient tool that can help engineers to solve various problems (Matthews et al., 2000).
In addition, the power of advanced learning methods has been recently implemented in many civil engineering applications, and the properties of confined concrete are successfully estimated [i.e., (Hornik et al., 1989; Oreta and Kawashima, 2003; Hola and Schabowicz, 2005; Mansouri et al., 2016; Cascardi et al., 2017; Mansouri et al., 2017; Isleem et al., 2021b; Ghanem and Elgazzar, 2021)]. Among these studies, the ANN model that can predict the compressive strength of concrete was provided by Hola and Schabowicz (Hola and Schabowicz, 2005). This technique is also used by Oreta and Kawashima (Oreta and Kawashima, 2003) to estimate the compressive strength and strain of steel-confined circular columns. The study concluded that the ANN technique is a viable method to accurately estimate the compressive strength of concrete. It was also found that the results predicted using the ANN model are more accurate than those of other mathematical methods. Isleem et al., 2021b have recently used different ANN approaches. Their analysis considers a database of 226 FRP-confined circular and non-circular concrete specimens. Furthermore, another approach to distinguish results that exhibit a strain-softening or strain-hardening is implemented.
To date, there is still a lack of experiments and FE models on the structural behavior of GFRP-RC columns. More specifically, all the available FE and ANN models on hollow-core concrete columns have not yet, however, considered the effect of lateral spiral spacing, concrete compressive strength, ratio of inner to the outer diameter, and different types of internal reinforcement bars on the failure mode, load-strain behavior, and strength of the HCCs. The first goal of this paper is, therefore, to investigate the structural response of GFRP-reinforced concrete columns by performing finite element modeling (FEM) and comparing it with the test results. The second objective of the present work is to implement the ANN approaches using the experimental and FE results. To achieve this, a total of 29 GFRP-RC solid and hollow-core reinforced concrete columns experimentally tested in Elchalakani et al. (2020), Hadhood et al. (2017a), Hadhood et al. (2016), Hadi et al. (2020), AlAjarmeh et al. (2019a), AlAjarmeh et al. (2019b), AlAjarmeh et al. (2020) were used to build a control FE model, which can be then used for a wide range of test variables of HCCs. Due to limitations in the column tests, a full database of 116 specimens was obtained using FE simulation and all these results were then implemented in the ANN modeling process for a more generalized model which can be suitable for designing FRP-confined RC columns concerning new column parameters.
The flexural design of FRP-reinforced concrete members has been well documented [i.e., (ACI, 2015; CSA S806–12, 2012)]. However, the existing design methods recommend that the contribution of the longitudinal FRP reinforcement to the axial load-carrying capacity should not be considered in the compressive zone of the flexural member. Due to uncertainty and a lack of information about the influence of variation in mechanical properties of FRP bars, the ACI design guidelines (ACI, 2015) suggested ignoring the contribution of the FRP reinforcement under compression loads. CSA S806–12 (2012) also suggested the use of the FRP bars in concrete members under compression but without considering its contribution to the column’s capacity.
The potential use of FRP materials as a primary reinforcement material in reinforced concrete columns has been significantly studied by many researchers [i.e., (Alsayed et al., 1999; Paramanantham, 1993; Lotfy, 2010; De Luca et al., 2010; Pantelides et al., 2013; Mohamed et al., 2014; Elmessalami et al., 2019; Elchalakani et al., 2020; Afifi et al., 2013; Hadi et al., 2016; Afifi et al., 2014a; Tobbi et al., 2012; Tobbi et al., 2014; Maranan et al., 2016; Hadhood et al., 2017a; Hadhood et al., 2016; Hadhood et al., 2017c; Hadhood et al., 2017b; Ahmad et al., 2021; Hadi et al., 2020; AlAjarmeh et al., 2019a; AlAjarmeh et al., 2019b; AlAjarmeh et al., 2020)], which lead to the introduction of many theoretical models to predict their load-carrying capacities. Researchers have confirmed that ignoring the contribution of the longitudinal FRP reinforcement underestimates the overall load-carrying capacity of the specimens [i.e., (Tobbi et al., 2012; Elmessalami et al., 2019)]. In an experimental research study by Tobbi et al. (2012) on GFRP-RC circular columns, it was found that the contribution of the longitudinal FRP reinforcement to the load-carrying capacity measured in the first zone of the axial load strain response was about 35% of the maximum tensile strength. Recently, Elmessalami et al. (2019) have carefully studied and compared the test results of concrete members reinforced with different types of FRP reinforcement. Generally, it was stated that columns reinforced with FRP bars showed lower resistance than the steel-reinforced concrete columns. It was also found that the enhancement contributed by the GFRP rebars is about 3–14% at peak load and that made by the CFRP bars is about 6–19% mainly depending on the FRP reinforcement ratio. Based on the existing findings, it was also found that taking the axial strain of the FRP rebars to be equal to the peak strain of the unconfined concrete (i.e., 0.003) in the proposed strength models reveals a good correlation with the test data (Hadhood et al., 2017c).
It is, however, noted that the existing experimental and analytical investigations focused largely on solid FRP-RC columns. Also, the proposed models for the axial load carrying capacity mainly estimate the maximum value in the elastic region of the axial load-axial strain response. Compared with that, the hollow-core concrete columns reinforced with FRP bars revealed significantly different failure modes and load-strain responses [i.e., (AlAjarmeh et al., 2019a; AlAjarmeh et al., 2019b; AlAjarmeh et al., 2020)]. Due to the reduced amount of concrete in the column themselves, the HCCs failed at a lower axial load-carrying capacity. As also reported by Hadi et al. (2016), the load-deformation response of the GFRP-reinforced concrete columns exhibited two peak loads. The first one is the maximum load-carrying capacity that is measured in the elastic zone of the response, while the second load is the failure load that considers the confinement effects by the GFRP spirals. Since the present paper considers a wider range of test parameters, it was found that the second load in most of the specimens was significantly influenced by both the amount of GFRP spirals and that of the longitudinal GFRP reinforcement. Clear comparisons regarding these effects are provided in the following discussions.
Therefore, it has been concluded by the researchers that the first peak represents the ultimate load-carrying capacity of the unconfined concrete core, while the second one represents the ultimate load-carrying capacity of the confined concrete core. The available models proposed for estimating the first load-carrying capacities are evaluated in Table 1, which provides the overall ratios of the model predictions to the experimental test results of a total of 29 specimens tested by the researchers (Elchalakani et al., 2020; Hadhood et al., 2017a; Hadhood et al., 2016; Hadi et al., 2020; AlAjarmeh et al., 2019a; AlAjarmeh et al., 2019b; AlAjarmeh et al., 2020). Figure 1 provides detailed comparisons associated with the errors estimated using the statistical factors (AAE, MSE, SD). Generally, the design method provided in CSA S806–12 (2012) significantly underestimates the axial compressive loads of the FRP-reinforced columns. The ratio of the model predictions to the experimental results was about 0.85 at the first peak load 0.91 at the failure load. This is mainly because the contribution of the FRP reinforcement in the proposed expression is not taken into account. Another important feature of this assessment is that the estimated errors for the load-carrying capacities at failure are higher than those resulting in the first peak loads. In light of research demands, the objectives of the next sections of the present paper are to develop FE and ANN models that can accurately predict the structural response of solid and hollow-core concrete columns reinforced with longitudinal GFRP or CFRP rebars and spirals.
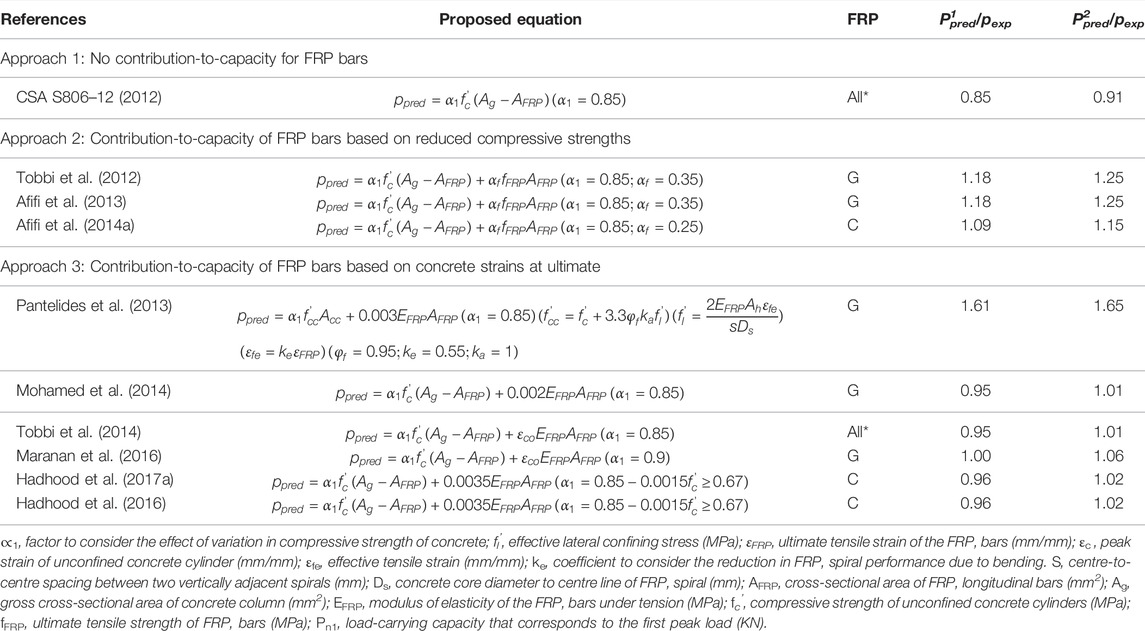
TABLE 1. Summary of mathematical expressions reported by the researchers for GFRP-RC columns.
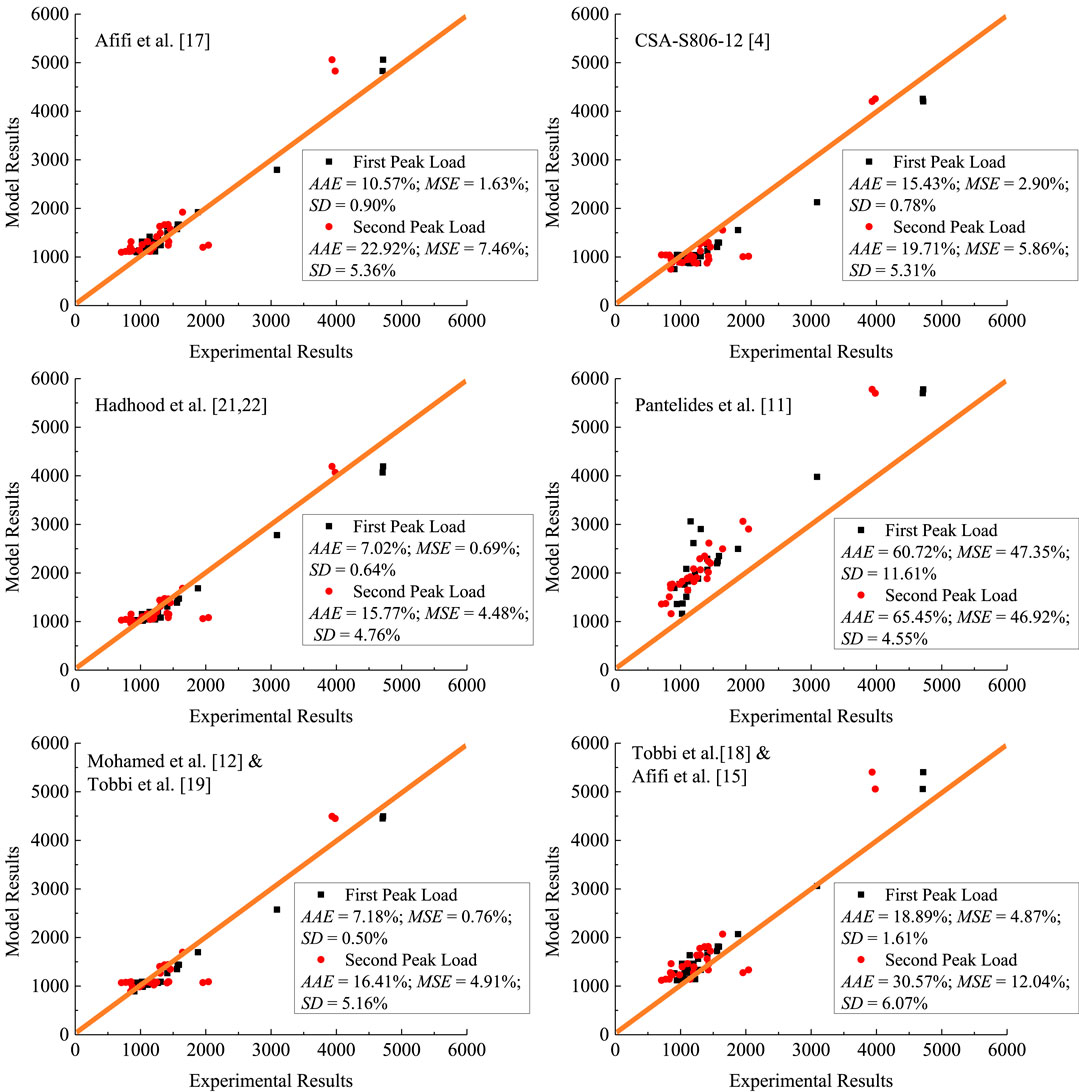
FIGURE 1. Comparison of experimental and existing model results for the peak and ultimate axial strengths of FRP-RC specimens.
The first experimental project investigated the effect of the longitudinal reinforcement amount as a primary test variable on the failure mode and structural response of hollow-core GFRP-reinforced concrete columns. The tests in (AlAjarmeh et al., 2019b) included only six specimens with a height of 1,000 mm and a diameter of 250 mm. The specimens included sand-coated GFRP bars with diameters of 12.7, 15.9, and 19.1 mm and ratios ranging from 1.78 to 4.02%. The GFRP lateral reinforcement had the same vertical configuration (i.e., center-to-center vertical spacing = 100 mm) and the hoop reinforcement ratio of about 1.93%. The second scheme of the tests (AlAjarmeh et al., 2019a) included four hollow-core concrete specimens reinforced with longitudinal and lateral GFRP bars. The effect of varying inner hole diameter on the failure mode and structural response of hollow-core GFRP-reinforced concrete columns was investigated. All specimens were reinforced with six longitudinal GFRP bars, and the GFRP spirals were vertically spaced at 100 mm on centers along 500 mm length at the column’s mid-height, and a spacing of 50 mm was within a length of 250 mm at the top and bottom of the specimens to avoid premature failure caused by the stress concentration. Six longitudinal GFRP bars were used with an effective ratio of about 2.58% (on average) (within the acceptable range of 1–4%). The reinforcement details were similar for all specimens to investigate the size effect of the internal hole. The inner void to column cross-section diameter ratios were 0, 0.16, 0.26, 0.36. The third part of the tests (Lignola et al., 2007) has focused on the effects of the varying volumetric ratio of GFRP spirals and the compressive strength of concrete cylinders. In their tests, seven concrete columns with the same dimensions were considered to be suitable for their testing machine. All specimens were longitudinally and laterally reinforced with the same details (AlAjarmeh et al., 2019a), except the spiral spacing being 50 mm, 100, and 150 mm. The ratio of the longitudinal reinforcement was 2.79%, and the ratio of the spirals ranged from 0% to 3.84%. In the tests (AlAjarmeh et al., 2019b; AlAjarmeh et al., 2020), the inner void to column cross-section diameter ratio was kept constant at 0.36. The specimens of their tests in Table 2 were first denoted by C followed by a number which indicates the grade of concrete (i.e., C25), then by the hoop spacing (i.e., H100), and finally the number of longitudinal bars, bar diameter, and its type (i.e., GF = GFRP, CF = CFRP). For example, specimen C25-H100-8#5-90-GF had eight #5 GFRP bars. The diameter of the inner hole equals 90 mm. The last notation refers to the inner void’s diameter. The details of the internal GFRP reinforcement and the specimens’ dimensions are shown in Figure 2.
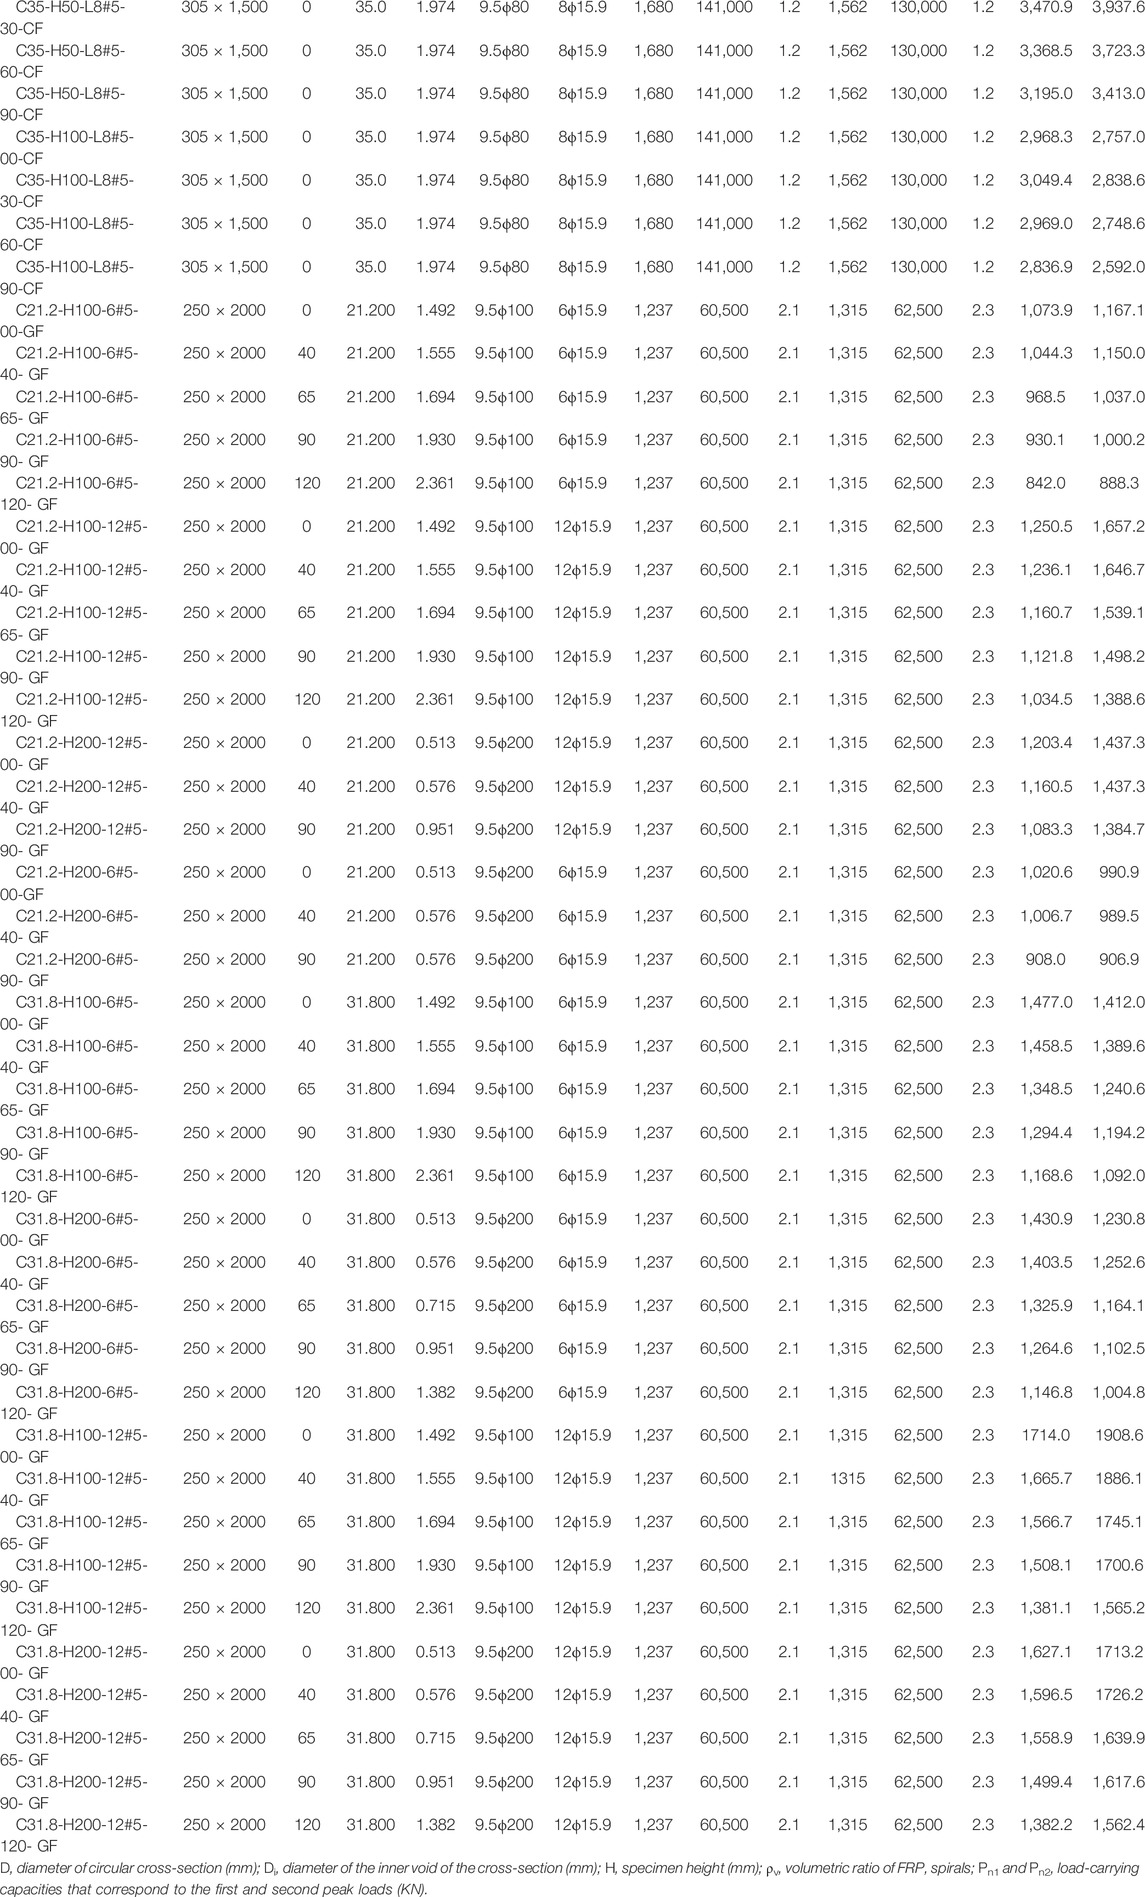
TABLE 2. Test database of GFRP RC columns.

FIGURE 2. Cross-sectional and GFRP reinforcement details.
Elchalakani et al. (Elchalakani et al., 2020) have recently investigated the effect of four variables on the behavior of GFRP reinforced members. These considered the longitudinal reinforcement type (i.e., steel, GFRP), the amount of longitudinal reinforcement, the vertical spacing of the GFRP spirals, and the loading type (i.e., concentric). In this paper, four specimens with two major variables were selected and simulated using the ABAQUS software (3DS, 2014). Information regarding the investigated parameters and tested material is provided in Table 2. The variables included the pitch of the GFRP spirals being 40 mm, 80 mm, and 120 mm, and the number of longitudinal reinforcing bars being 3 or 4. Moreover, this study focused on testing a relatively larger height-to-diameter ratio (H = 1,150 mm and D = 215 mm) equal to 21.4 compared with 16.3 (on average) as tested by other researchers. The details of column cross-section and GFRP confinement are provided in Figure 2 and the slender geometry of the tested members is depicted in Figure 3.
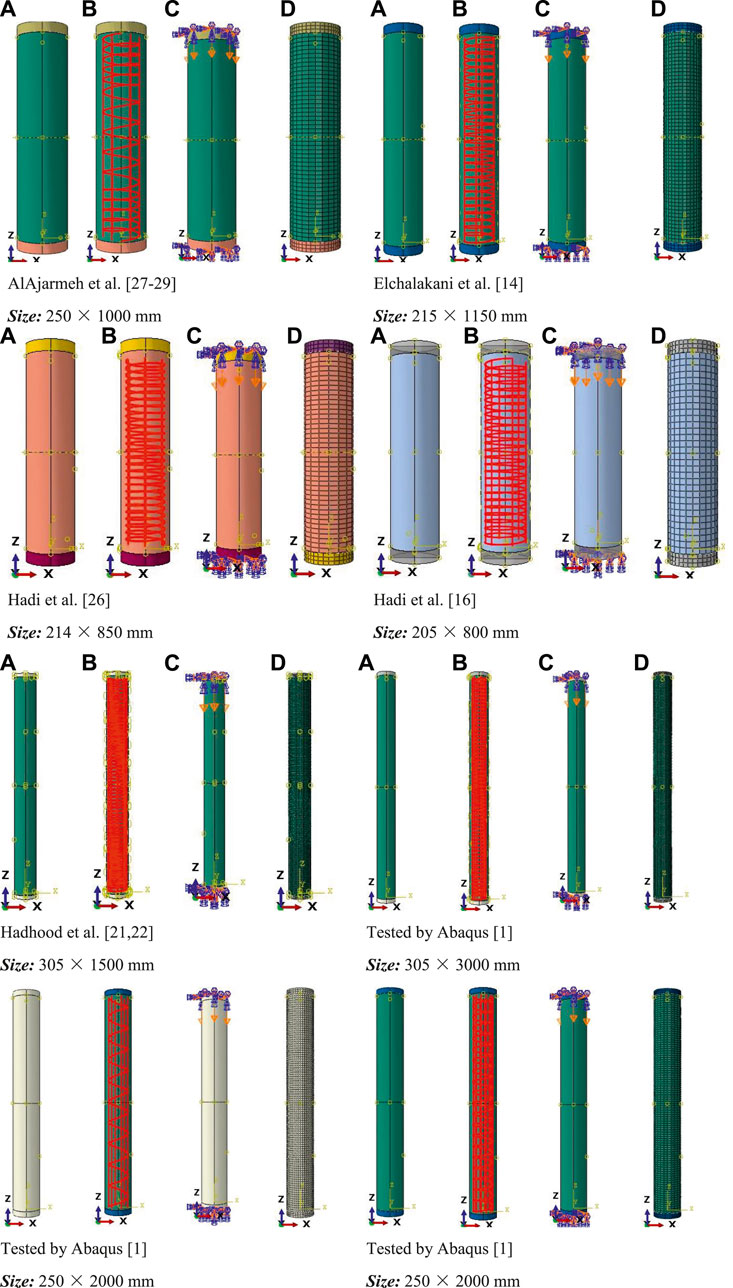
FIGURE 3. FE modeling of HCCs showing the assembly part (A), longitudinal FRP bars and spirals (B), the applied loads (C), and element meshing (D). To be able to describe relationships between the elements of the structures, a three-dimensional coordinate axis system is also provided.
Tests by Hadi et al. (Hadi et al., 2016; Hadi et al., 2020) included two experimental schemes to study the mechanical performance of GFRP-reinforced solid and hollow-core concrete columns. The first program (Hadi et al., 2016) included solid-sectioned specimens which were 205 mm in diameter and 800 mm in height and tested under different loading conditions (i.e., concentric, eccentric). The slenderness ratio of the tested columns is about 16, which is within the limit of short concrete columns. The major variables of these tests were the type of the longitudinal bars and helices (steel, GFRP), the pitch of the transverse reinforcement, and the eccentric loading ratio. In the present paper, only the concentrically loaded specimens were selected and simulated (Refer to Table 2). The experimental program (Hadi et al., 2020) focused on the same experimental variables for hollow-core circular concrete columns reinforced with GFRP bars and helices. The slenderness ratio of the tested columns is almost the same as in the previous test program (214 mm in diameter and 850 mm in height). In the concentrically loaded tests (Hadi et al., 2016; Hadi et al., 2020), the major variable was the pitch of the GFRP spirals to be 30 mm, 60 mm, and 90 mm. Figure 2 provides the details of column cross-section and GFRP confinement and Figure 3 depicts the short-scale geometry of the tests. Because the dimensions of these specimens were chosen to be suitable to the capacity and condition of the testing machine in the laboratory, the test matrix of these specimens is, therefore, expanded in the FE modeling to consider a wide range of variables (i.e., varying ratio) while keeping one or two parameters to be constant.
Tests included two experimental programs conducted on full-scale GFRP and CFRP-reinforced solid concrete columns under different loading types. All specimens are with a height of 1,500 mm and a diameter of 305 mm and the slenderness ratio of the columns is about 19.7, which is within the limit of short concrete columns. The specimens of the test program (Hadhood et al., 2017a) were reinforced with internal GFRP bars and spirals, whereas those in Hadhood et al. (2016) were reinforced either with steel or CFRP bars and spirals. Among all the tests compiled in this paper, only those from Hadhood et al. (2017a) were constructed with high-strength concrete (Refer to Table 2). The major variables in these two tests were the amount of longitudinal reinforcement and the loading eccentricity. Since the present paper focused on the concentric loading type, only those specimens which were tested under pure compression loading were selected. Figure 2 shows the details of column geometry and GFRP reinforcement.
The Finite Element (FE) simulations consist of 116 specimens with varying dimensions and materials properties and configurations. The designed specimens are composed of a wide range of test variables (i.e., height of the specimens, amount of GFRP or CFRP confinement or reinforcement). For example, due to the limited size of PVC pipes in the market, AlAjarmeh et al. (2019b) reported the effect of limited values of the ratio on the compression performance of GFRP-RC HCCs, while all the tested columns were with the same material and configuration and amount of the bars and spirals (i.e., the pitch of the GFRP spirals for all specimens = 100 mm). Therefore, the present work expanded the range of investigated i.o ratios being between 0 and 0.48 (i.e., C31.8-H100-6#5-00-GF, C31.8-H100-6#5-65-GF, C31.8-H100-6#5-90-GF, C31.8-H100-6#5-120-GF). For a comprehensive development of a numerical model, columns with larger column height, amount of longitudinal reinforcement, and largely spaced GFRP or CFRP spirals were considered (i.e., C31.8-H200-6#5-00, C31.8-H100-12#5-40, C31.8-H50-6#5-65-GF), i.e, Table 2. Figure 2 shows the details of the tested geometry and FRP reinforcing bars.
This subsection provides essential details considered to numerically simulate the behavior of GFRP-RC columns using the commercial ABAQUS software (3DS, 2014). The present FE model takes into account the initial stiffness of concrete, crack propagation behavior, peak and ultimate loads, post-cracking stiffness, and different failure mechanisms of the tested columns. The complex nature of reinforced concrete in terms of elastic and plastic behaviors was successfully defined using the Damage Plasticity Model (CDPM), and the internal longitudinal and lateral GFRP bars were considered as linear elastic material up to the failure strength. To validate the proposed FE model, the experimental results of a total of 29 columns from Elchalakani et al. (2020), Hadhood et al. (2017a), Hadhood et al. (2016), Hadi et al. (2020), AlAjarmeh et al. (2019a), AlAjarmeh et al. (2019b), AlAjarmeh et al. (2020) were used to check the numerical results of first peak load, second peak load, ductility of confined concrete, the strain developed in the longitudinal and lateral reinforcement, and the testing failure mode. The key results of the specimens tested by the researchers and those obtained from the ABAQUS simulations are listed in Table 2, whereas Figure 2 shows the cross-section and reinforcement details of the test specimens.
The homogenous 3-dimensional solid stress element (C3D8R) commonly used for the concrete column and the steel endplates was assigned in the present model. The internal glass-fiber-reinforced bars were modeled as a 3-dimensional deformable wire which was assigned with the element T3D2. The top and bottom surfaces of the simulated columns were fixed from moving and only allowed to translate in the vertical direction at the top surface (θx, θy, θz = 0; Ux and Uy = 0, Uz ≠ 0). The bond between the concrete and the embedded GFRP bars is commonly defined by the ‘“embedded region” constraint, which connects the compatible degrees of freedom (DOF) of the T3D2 truss element assigned for the GFRP bars to the required DOF of the C3D8R concrete element (Raza et al., 2019). All columns were tested in the ABAQUS software using the displacement control method by applying a vertical displacement of 50 mm at the top of the columns, which was uniformly distributed over the top surface of the column. The thickness of the steel endplates was 50 mm, and this meets the environmental condition of the experimental tests. To successfully transfer the loads from the steel endplates to the concrete column, the “tie” constraint was used to connect the plates with the top and bottom ends of each tested specimen. To well perform this step, the steel plate’s bottom surface was considered the master surface and the column’s top surface was the slave surface. Likewise, the top surface of the bottom plate was the master surface and the bottom surface of the tested specimen was the slave surface. The structural geometry and general background of the GFRP RC columns, such as applied loading conditions, the interaction of internal reinforcement, and meshing properties are depicted in Figure 3. Other key details of assigned elements and FE simulation parameters are as follows: the mesh size of 25 mm for all column parts including concrete section, longitudinal, and lateral GFRP bars provided good performance; the initial, minimum, and maximum step sizes were 0.005, 1E-08, and 0.01, respectively; the concrete and steel end plate element type was Standard C3D8R/Geometric Order: Linear/Family: 3D Stress; the GFRP re-bars and spiral element type was Standard T3D2/Geometric Order: Linear/Family: Truss; the Interaction constraint of FRP reinforcement to concrete was performed using the embedded Region; the Step-1 type was Static, general; the equation solver was direct; the automatic stabilization was “Use damping factors from previous general steps”; the Nlgeom (Accounting for Nonlinearity) was “OFF”.
Concrete is a composite material and it is a challenging task to be well defined in the FE simulation. The elastic behavior of concrete was defined by the elastic modulus and Poisson’s ratio parameters. The elastic modulus was determined using Eq. 1 (ACI 363, 1984) and the Poisson’s ratio was assumed to be 0.2 (Hassan et al., 2019). The density of normal-weight concrete was taken as 2,400 kg/m3. For the plastic condition of the concrete, there are various models in ABAQUS software, such as the brittle crack model (BCM), Drucker-Prager model (DPM), the smeared cracking model (SCM), and the damaged plastic model (CDPM). In the current study, the CDPM was used for modeling the plastic behavior of concrete. Many studies confirm the ability of this model to accurately model the complex nature of concrete. It has been widely considered in many existing non-linear simulations (Prakash et al., 2010; Youssf et al., 2014; Alfarah et al., 2017). The elastic characteristics of concrete under compression and tension loading, the inelastic behavior, and the damaging criteria of concrete are all considered in the CDPM.
where, fc′ (MPa) = the 28-days compressive strength of concrete cylinders.
The inelastic response of concrete was defined by the expressions provided in the ABAQUS user manual 6.14 (3DS, 2014), which considers five essential parameters for the CDP model. These parameters are the ratio of biaxial to uniaxial stresses (
where, fc’’ (MPa) is herein considered to be 80% of the concrete cylinder strength to consider the size effects of full-scale tests, fc’; ɛc1 (mm/mm) = the strain of the unconfined concrete at the first peak load; likewise, ɛcc1 (mm/mm) = the strain of the GFRP-confined concrete at the first peak load. Eq. 3 (Majewski, 2003) for the axial compressive strain of unconfined concrete and Eq. 4 (Zeng, 2016) for the peak strain of confined concrete were used in the present work to simulate the behavior of columns confined with internal GFRP bars. Moreover, Eq. 6 (Majewski, 2003) was used to determine the ultimate strain of the unconfined concrete.
where, Ie = a non- dimensionless factor to account for the confinement effect; ρv = the volumetric ratio of the lateral GFRP bars.
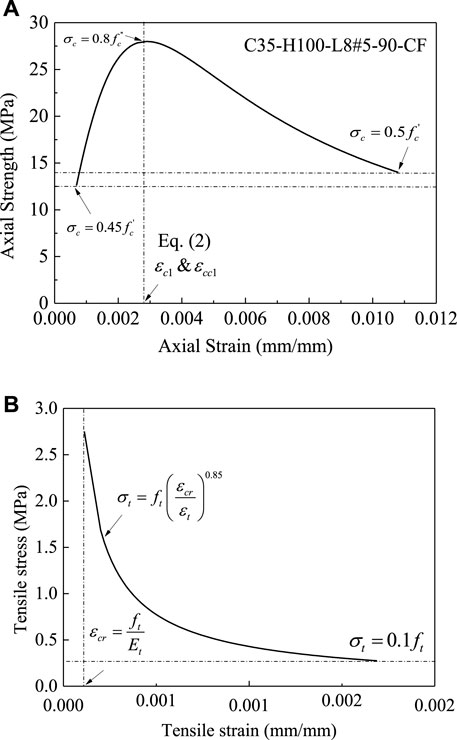
FIGURE 4. Modeling the response of GFRP-confined concrete: (A) Tests under compression loading; (B) Tests under tension loading.
The damage parameters of concrete under compression and tensile loads were determined using Eqs (7, 8), respectively. For a selected specimen, the variation of dc and dt parameters concerning the plastic strain values are drawn in Figures 5A,B, respectively.
where, ft (MPa) is the maximum strength of concrete under tension and is determined by Eq. 9, which is suggested in the current study using the test results from (International Code Council, 2015).
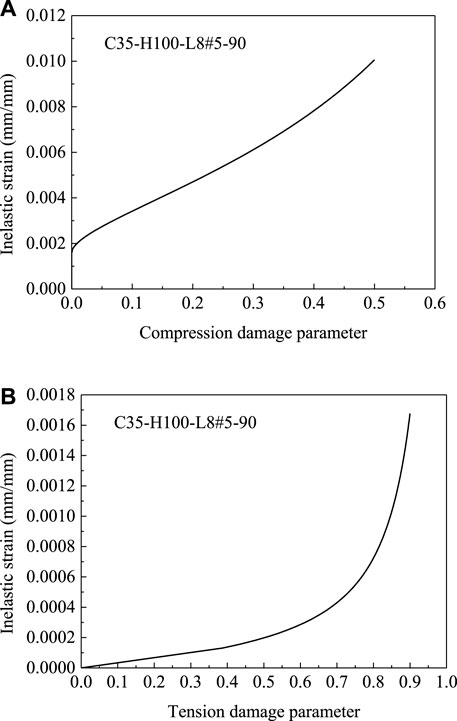
FIGURE 5. The inelastic strain of confined specimen C35-H100-L8#5-90-CF versus the damage parameter; (A) for the concrete under compression; (B) for the concrete under tension.
The cracking strain ɛcr (mm/mm) that corresponds to ft was determined as
where, ɛocel (mm/mm) = the strain of compressive concrete in the elastic zone, which is determined as
3D deformable wires were considered to define the reinforcement elements. Their mechanical properties from their original tests are given in Table 2. The GFRP bars were simulated as a linear anisotropic elastic behavior, which was defined by the density (2.1 × 10⁻⁹ ton/mm3), the modulus of elasticity, the contribution of the longitudinal GFRP bars in compression, and the Poisson’s ratio (0.25) [i.e., (Chellapandian et al., 2018; Elchalakani et al., 2018; Raza et al., 2019; Isleem et al., 2021a; Raza et al., 2021)]. The contribution of the different types of longitudinal bars in compression was, in this paper, considered to be 35.5% for both GFRP and CFRP bars (on average) of the ultimate tensile strength measured for a straight bar. Finally, the contact between the reinforcement in lateral and vertical directions and the concrete surrounding the bars was modeled by the “embedded region” constraint.
A 3D deformable steel material was used for the endplates of all specimens. The “tie” constraint as a boundary condition for the end plates is used. A linear elastic behavior for the steel material was assumed, which was defined by the density (7.8 × 10⁻⁹ ton/mm3), the modulus of elasticity (Es = 200 × 103 MPa without any yield limit), and the Poisson’s ratio of 0.30.
In the previous discussions, it was shown that the comparisons between the predictions given by the proposed FE model and the test results portrayed lower percentages of errors for all the tested specimens compared with the previous models (Elchalakani et al., 2020; Hadhood et al., 2017a; Hadhood et al., 2016; Hadi et al., 2020; AlAjarmeh et al., 2019a; AlAjarmeh et al., 2019b; AlAjarmeh et al., 2020). In the present subsection, the axial-load-strain curves obtained from laboratory testing and FE simulation for specimens selected from AlAjarmeh et al. (2019b), AlAjarmeh et al. (2020) are shown in Figure 6. The specimens were selected for additional reasons, namely 1) none of the other references provided the full details of the test results (i.e., load-strain response), they possess varying volumetric ratios of GFRP spirals, 2) they have a different compressive strength of unconfined concrete, and 3) they have varying amount of longitudinal reinforcement. The evaluation of other test variables can be understood by other discussions in the present paper. Generally, it is seen that the proposed FE model predicted the first region of the load-strain response, first peak load, second peak load, and the post-loading stage in a good manner and can be generalized for simulating specimens with different test parameters.
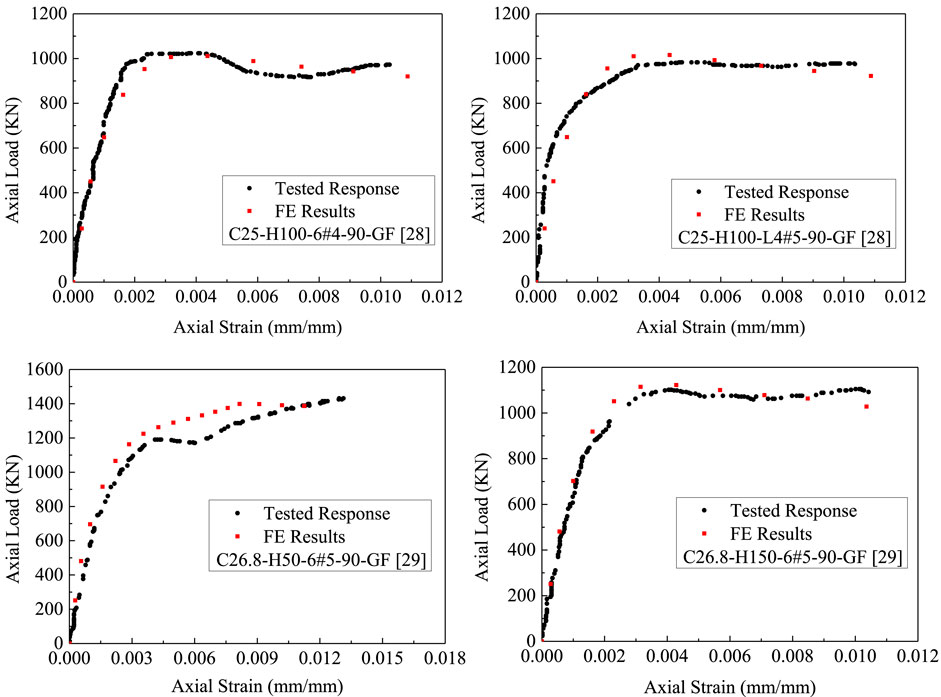
FIGURE 6. Comparison between selected test responses and FE results of GFRP-RC specimens (AlAjarmeh et al., 2019b; AlAjarmeh et al., 2020).
The linear and nonlinear trends between all variables considered in the analysis are visualized in Figures 7A, B respectively using the Pearson and Spearman correlation methods. It is generally seen from the results that the two variables Ac and i.o have no significant impact on the experimentally resulted LR ratio (the ratio of the second ultimate load to the load at the first peak condition) as denoted by the white-colored index. The other test variables
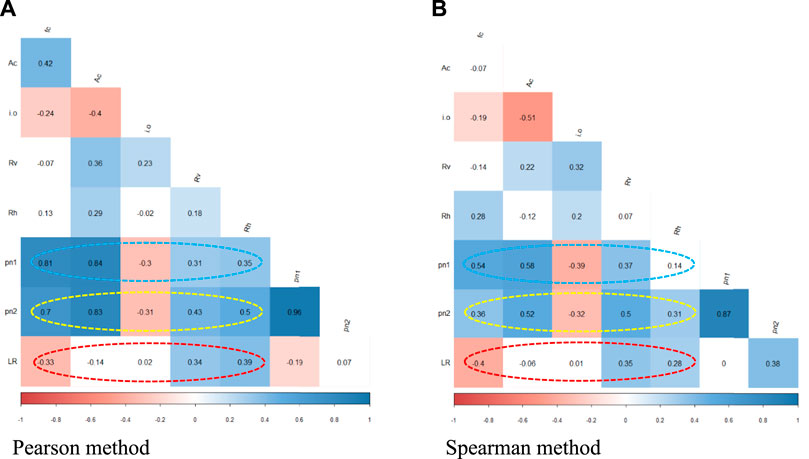
FIGURE 7. Correlation coefficients for the key test variables. (A) Pearson method. (B) Spearman method.
Although the results of Figure 7 declare insignificant effects for the i.o ratio on the trend of the second zone of the load-strain response (i.e., the correlation coefficient is 0.02 in Figure 7A), it is reported by AlAjarmeh et al. (2019a) that the complexity of its effect is closely associated with the amount of the longitudinal and GFRP spirals. A stress index was provided for the confined concrete and the lateral GFRP spirals independently (AlAjarmeh et al., 2019a). It can be seen from Figure 8A that when the stress index of the lateral GFRP spirals is higher than that of the confined concrete, the damage starts in the GFRP spiral first followed by the crushing of the concrete core as for the case of columns with i.o ratios of 0.16 and 0.26 (i.e., C31.8-H100-L6#5-40-GF and C31.8-H100-L6#5-65-GF in Table 2, respectively). On the other hand, when the concrete stress index of the column with i.o ratios of 0.36 is higher than that of the GFRP spirals, the concrete core fails before the rupture of longitudinal bars and without fracturing of spirals. The i.o of 0.36 (i.e., C31.8-H100-L6#5-90-GF in Table 2) is, as a result, considered to be an important design threshold, as it results in a ductile failure. It is to be noted that Figure 8A was drawn by AlAjarmeh et al. (2019a) based on very limited tests, in which the amount of longitudinal and GFRP spirals was constant. The present paper aims at exploring the effects of a wide range of test parameters. Figure 8B presents the results of nine groups of experimental and FEM tests, among them one group namely C31.8-H100-6#5-GF was tested by AlAjarmeh et al. (2019a), and their results are provided in Figure 8A. These groups consider the effects of all the parameters investigated in the present paper. It can be seen from Figure 8B that the whole trend can be divided into four segments which are varied at different i.o ratios that are within the range of 0.1-0.26. For example, the trends of C35-80-L6#5-CF and C35-100-L6#5-CF showed a continuous flat response with an insignificant decrease in the slop, whereas the slop of the trend of C35-80-L6#5-CF is increasing up to a ratio i.o of about 0.1 and after that, the slope is decreased but with slight improvement comparing with those of C35-80-L6#5-CF and C35-100-L6#5-CF. A close inspection of specimens C21.2-H100-L6#5-GF and C21.2-H100-L12#5-GF reveals that the first slope of the first segment is increasing up to an i.o ratio of about 0.16, while the second trend for the two specimens is flat or slightly decreased up to a threshold i.o of about 0.26. The last trend is finally increased. That means that when the damage starts in the concrete first for the i.o range of 0.16-0.26 the longitudinal bars are still activated to resist the loads as this indicated by the slightly improved trend after the i.o = 0.26. Typical features can be also noticed for specimens C31.8-H200-L6#5-GF and C31.8-H200-L12#5-GF, where both of them are increasing up to a threshold of about 0.16, the concrete starts failing as revealed by the decreasing trend up to 0.26, and finally, that possessed a larger amount of reinforcement exhibited an improved trend compared with a flat one for the specimens with a lower amount of longitudinal reinforcement. For columns with lower compressive strength, the additional vertical reinforcement resulted in a more ductile type, and the effect is significant when the spacing of the GFRP spirals is reduced, i.e., C21.2-H100-L12#5-GF, which possess an almost a flat response in the first third regions up to an i.o ratio of 0.26 and finally resulted in a slightly improved trend. In conclusion, the present discussion confirms that it is complex to draw an optimum i.o ratio as the response of the columns is significantly affected by the amount of GFRP reinforcement and the concrete compressive strength.
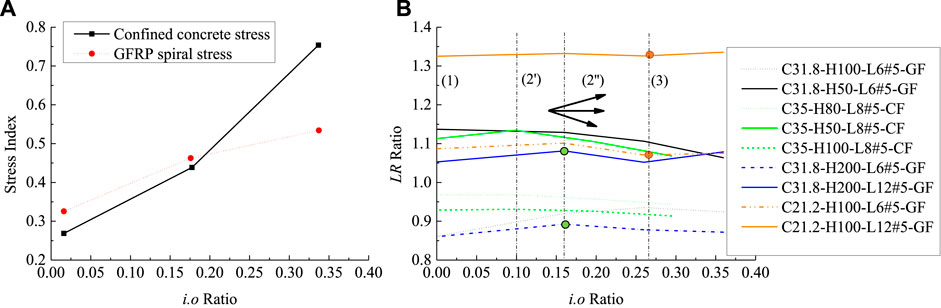
FIGURE 8. The effect of increasing the i.o ratio on the experimental strength results for columns with varying concrete compressive strength and ratio of longitudinal and lateral reinforcement. (A) Test results from (AlAjarmeh et al., 2019a); (B) Results of Current simulated columns with different variations of test variables.
Figure 9 presents the results of 16 groups of specimens, in which four relative groups are provided in each part of the figure. For a comprehensive comparison, Figures 9A, B contain results with fc’ = 31.8 MPa, whereas those in Figures 9C, D contain results with fc’ = 21.2 MPa. All these results clearly show that reducing the spiral spacing from 200 to 100 mm provides less enhancement in the load-carrying capacities compared with the case of increasing the longitudinal reinforcement amount from 6#5 to 12#5. Figure 10 provides the load-strain results from the FE simulation considering the effects of the investigated variables. As seen, the second trend of the load-strain response becomes more significant with increasing the amount of the longitudinal reinforcement (Figures 10B, D) as compared with less improvement resulting due to the effects of the variation in the fc’ and the hoop confinement (Figures 10A, C), in which the trend is descending or flat response. The more significant effect due to varying the i.o ratio as compared with the variation in the fc’ is shown in Figures 10E, F, in which, for the specimens with fc’ of 21.2 MPa, reducing the i.o ratio from 0.16 to 0 improved both the loads at peak and ultimate conditions, and the extent of the second zone becomes larger compared with that of the specimens with fc’ of 31.8 MPa. However, the responses of the two specimens (i.e., C21.2-H200-6#5-00-GF and C21.2-H200-6#5-90-GF) remain flat, indicating that varying the i.o ratio has no impact on the experimentally resulted from LR ratio.
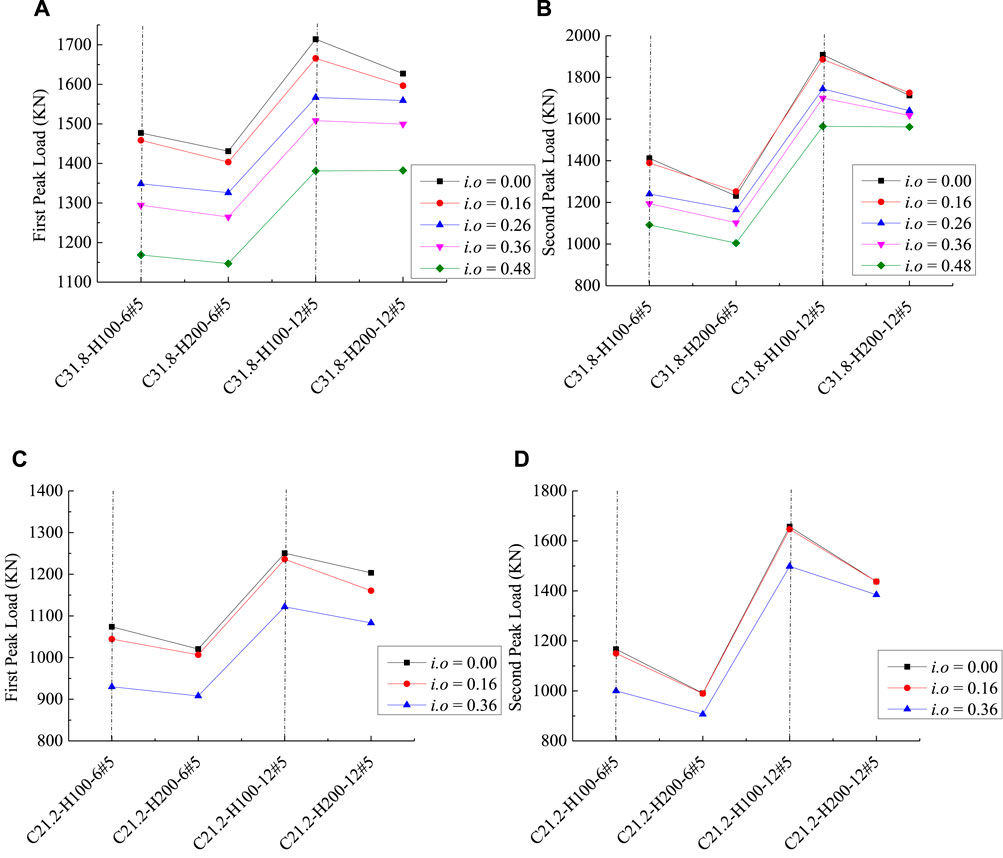
FIGURE 9. Effect of the amount of confinement and longitudinal reinforcement on the load-carrying capacities for columns with different compressive concrete strengths. (A, B) GFRP-RC HCCs with concrete strength of 31.8 MPa; (C, D) GFRP-RC HCCs with concrete strength of 21.2 MPa.
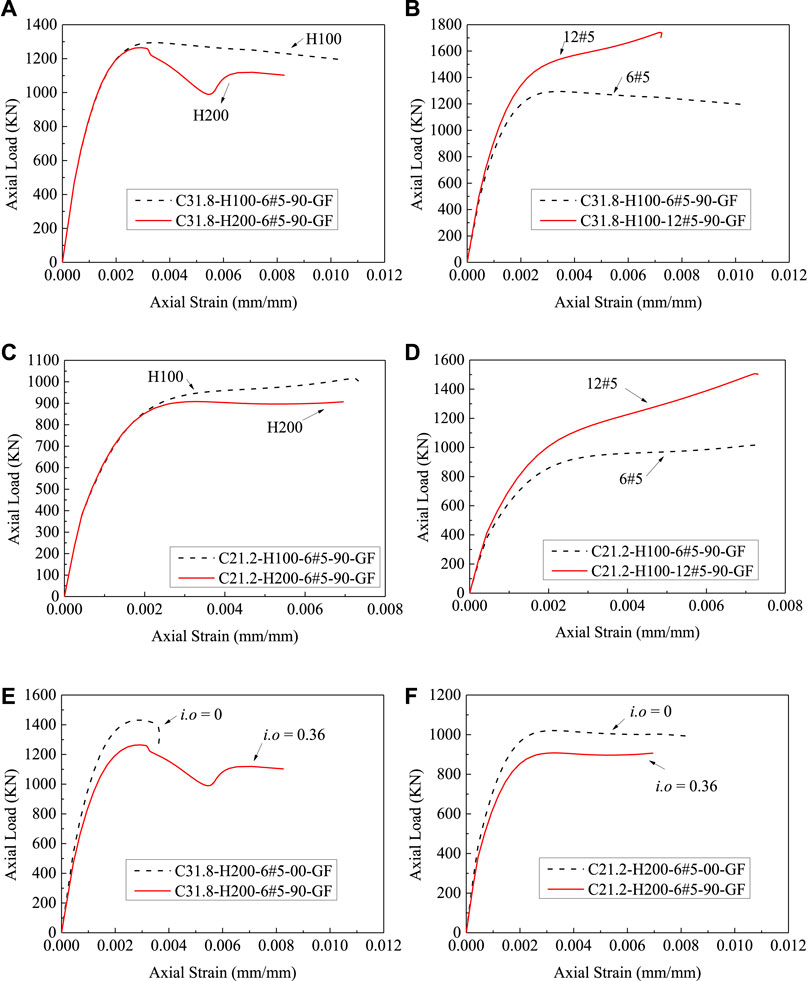
FIGURE 10. Test parameters effects on load-strain response. (A, C) GFRP-RC HCCs with different hoop reinforcement ratios and concrete strengths; (B, D) GFRP-RC HCCs with different longitudinal reinforcement ratios and concrete strengths; (E, F) GFRP-RC columns with different inner-to-outer diameter ratios and concrete strengths.
Figure 11 presents comparisons between the test results (AlAjarmeh et al., 2019a; AlAjarmeh et al., 2019b; AlAjarmeh et al., 2020) and those obtained using the FE simulation. Concerning the ultimate tensile strain of the GFRP bars, Table 3 presents the experimental and numerical ratios of strains Xb, pn1 and Xb, pn2 measured in the GFRP longitudinal bars, respectively, at the first and second peak loads and those for the GFRP spirals Xs, pn1 and Xs, pn2. Generally, the comparisons show that the averaged results from both the experimental and numerical tests at the second peak loads are closely matched. Although there is a limited discrepancy existed between the numerical and tested strains in the longitudinal bars from AlAjarmeh et al. (2019a), AlAjarmeh et al. (2019b), AlAjarmeh et al. (2020), the numerical results agree well with the conclusions drawn by Elmessalami et al. (2019), in which the strain in the FRP bars, at the first peak loads, was considered to be within the range of 0.002 and 0.0035. The results of Table 3 revealed that the experimental and numerical strain ratios of the GFRP spirals corresponding to the first peak loads (Xs, pn1) are 6.25 and 8.13%, respectively. This result (7.19% on average) agrees well with the study by Tobbi et al. (2012), in which At the first peak load level, the strain in the hoop reinforcement was equal to 0.001, which is equal to 6.89% of the ultimate tensile strain of GFRP (ɛFRP = 0.0145). At the second peak load level, the experimental and numerical strain ratios of the longitudinal reinforcement were 52.3%, which is within the range reported in AlAjarmeh et al. (2020) (50.2–64.5%). In conclusion, the FE simulation and its associated data provide an accurate representation of the experimental tests.
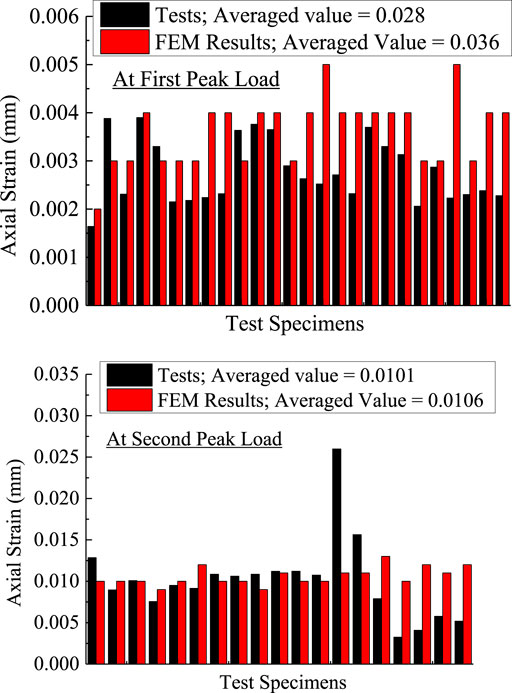
FIGURE 11. Comparison of FE strain results of longitudinal bars at first and second peak loads with the experimental data from AlAjarmeh et al. (2019a), AlAjarmeh et al. (2019b), AlAjarmeh et al. (2020).
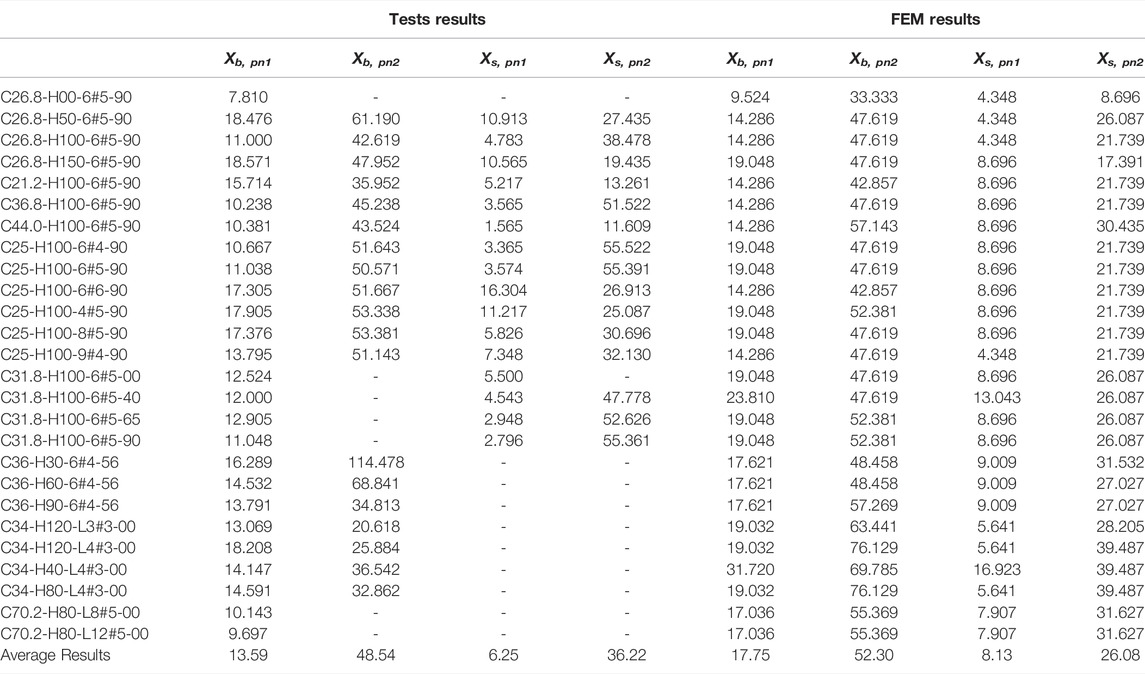
TABLE 3. Experimental and FEM strain results of longitudinal and spiral reinforcement bars.
As a preliminary prediction model, it was assumed that there exist linear relationships between the response variables (Pn1 and Pn2) and the explanatory variables (Ac, fc’, i.o, Rv, and Rh). This assumption is similar to that of the existing models. As a result, the “lm” command using the R Language Programming was used. The test database was, one at a time, divided randomly into training (75%) and test (25%). Figure 12 presents comparisons between the test results (Table 2) and those obtained from the proposed linear Eqs 13, 14. The comparisons reveal good accuracy for both the training and testing data, and the correlation coefficient R2 was 99.01% for the first peak load and 97.41% for the second peak load. However, the first part of the model (i.e., Eq. 13) reveals a positive correlation between the i.o and Pn1, which contradicts the test findings and the results of Figure 7 as well. It seems that the effects of the test variables are not well quantified. For accurate modeling, more advanced methods are, therefore, provided in the following discussions.
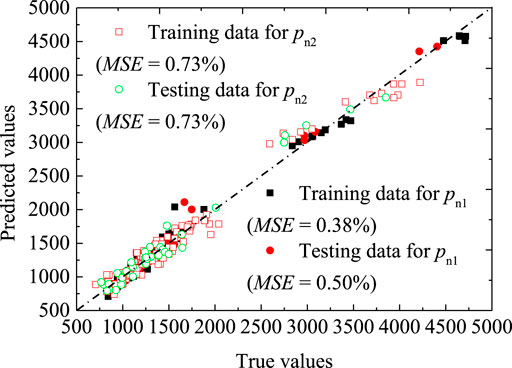
FIGURE 12. Proposed linear model via the tested Pn1 and Pn2.
The present analysis aims at examining the potential application of the Artificial Neural Network (ANN) in predicting the test results in a more generalized manner compared with the techniques that often suggest proposing forms of mathematical formulas that may be suitable only for the data often used in the model development as discussed in (Isleem et al., 2021b). Since the compressive behavior of FRP-confined concrete is controlled by several test variables with nonlinear or with unknown interrelationships and the test data are noisy, the ANN technique is widely acceptable to solve various problems, and it can be used for classification and data modeling. The application of the ANN in predicting the confined concrete was used before for columns internally reinforced with steel bars and externally wrapped with FRP (i.e., (Mansouri et al., 2016; Cascardi et al., 2017; Mansouri et al., 2017; Isleem et al., 2021b; Ghanem and Elgazzar, 2021)). The present analysis employed the ANN algorithms to predict the key findings of the GFRP and CFRP reinforced concrete columns as summarized in Table 2.
For all specimens experimentally and numerically tested, 144 in total, an ANN predictive model was first structured, then trained over several parameters, and finally checked using the R Language Programming. The test database was, one at a time, divided randomly into training (75%) and test (25%). To build a network that can be generalized for unseen data, the network was trained by selecting suitable parameters from a hyper search using the “caret” package. The trained “nnet” algorithm consists of five input variables, one output, and the size of the hidden layer was varied from 0 to 10, which is assumed to be close to the sum of the input and output variables. It is to be noted that due to the unavailability of a multi-objective algorithm to predict several output variables, the present model was trained three times for each response variable independently. The input variables investigated in previous discussions were Ac, fc’, i.o, Rv, and Rh. The responses that correspond to Pn1 and Pn2 were independently trained and predicted. For accurate modeling, all the data of the input layer are first scaled to be within the range of 0 and 1 using the maximum and minimum values of each input variable provided in Table 4. The relationship between the actual inputs (denoted by xi) and the actual normalized inputs (denoted by xN, i) is presented in Eq. 13.
where, xN, i = the ith normalized value in the dataset; xi = the ith value in the input dataset; min(x) = the minimum value in the input dataset; max(x) = the maximum value in the input dataset.
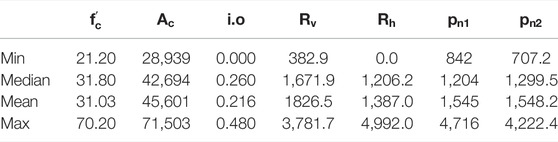
TABLE 4. Summary of data used to develop the ANN model.
Using R Langauge Programming, Figures 13A, B by the “nnet” algorithm show the network structure respectively for the Pn1 and Pn2. The models revealed a small learning rate (decay = 10-4). For the training stage, the N5-6-1 structure with five input variables, six hidden nodes, and one output node (Pn1) revealed the best performance, whereas acceptable results for the output Pn2 were given by the N6-1-1 model, in which the Pn1 variable was considered as the sixth input. The final results of the weights and biases of the N5-6-1 and N6-1-1 models are provided in Tables 5, 6, respectively. The relative importance of each input variable is provided in Table 7, which reveals that all the major input variables (Ac, fc’, i.o, Rv, and Rh) are considered during the training process and revealed an impact on the network results. The relative importance scores of the input parameters to the first output are denoted in the figures by different widths and colors of the network connections. The relative importance rankings agree well with the correlation results as before provided (refer to Figure 7). In particular, over the first peak load, the three important variables that control the shape of the axial load-strain response are Rh (20.6%), fc’ (15.4%), and Rv (14.8%). Due to their significance, several models have been provided for predicting the response of FRP-confined concrete [i.e., (Isleem et al., 2021b)].
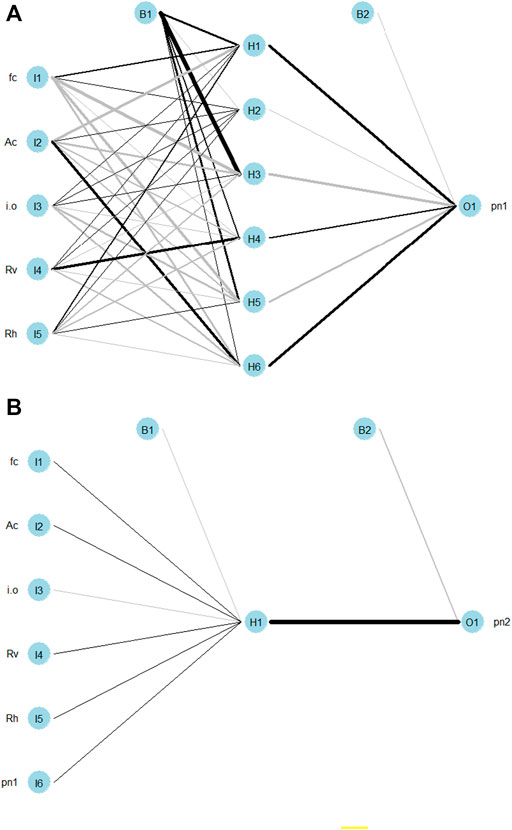
FIGURE 13. Proposed ANN networks: (A) for the first peak load (Pn1); (B) the first peak load (Pn2).
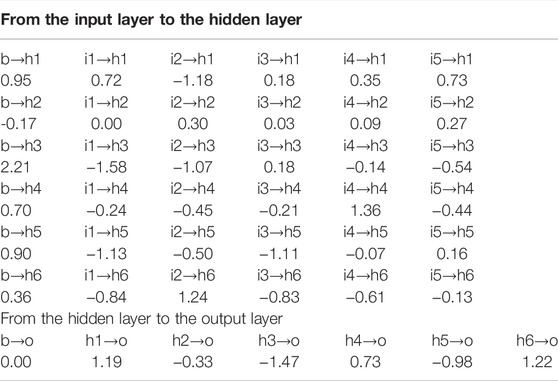
TABLE 5. Connection weights and biases of hidden and output layers of the N5-6-1 model.
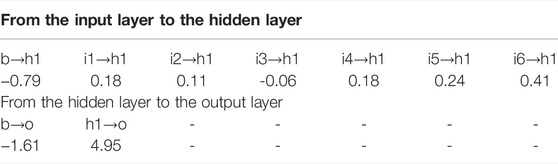
TABLE 6. Connection weights and biases of hidden and output layers of the N6-1-1 model.
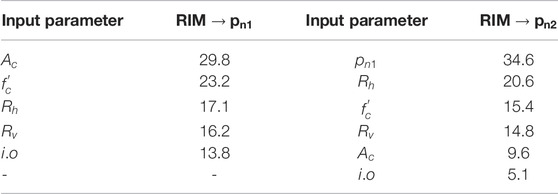
TABLE 7. Relative importance measurements for the input parameters.
Using MATLAB R2020b software (MATLAB, 2012), the ANN toolbox (Beale et al., 2015) was used to develop and train a network for the output variables (y1 = Pn1 and y2 = Pn2). The number of input data used for training, validating, and testing the model was 144 in total. The input variables were the same as used in the previous subsection. The training, validating, and testing data were 70%, 15%, and 15% of the total number, respectively. Using one layer of hidden nodes similar to the one in the previous subsection, a range of parameters (i.e., learning rate, number of hidden neurons) was first assumed and then adjusted as long as the MSE result is reduced. The optimum parameters were finally found by this training approach which employed the Levenberg-Marquardt (Trainlm) training function. It is to be noted that the input and output data was, by default, scaled to be between 1 and -1. The model performance was measured using the MSE (see Figure 14), and both the hidden and output layers had Pureline transfer functions. By taking the logarithm of the input and output data (Eqs 16, 17), the model reveals an improved accuracy (see Figure 15). Finally, Eqs 18–24 are finally obtained.
where, y (Eqs 17, 18) is the true prediction; for scaling x and y data, the minimum and maximum values are needed (Table 4); w1 (Eq. 21) = the weight matrix between the layer of input variables and the first hidden layer, w2 (Eq. 22) = the weight matrix between the first hidden layer and the next layer (i.e., output layer); b1 (Eq. 23) = the bias matrix of the hidden layer, b2 (Eq. 24) = the bias matrix of the following layer (i.e., hidden or output layer).
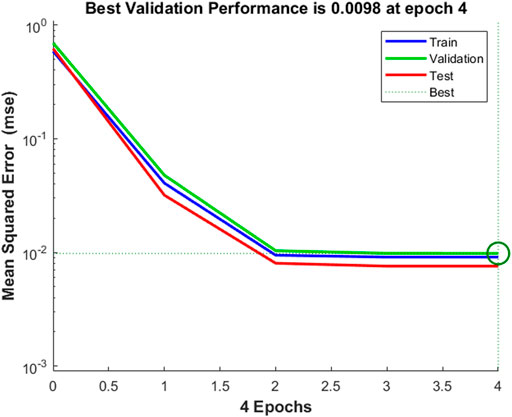
FIGURE 14. ANN training performance (MATLAB-based model).
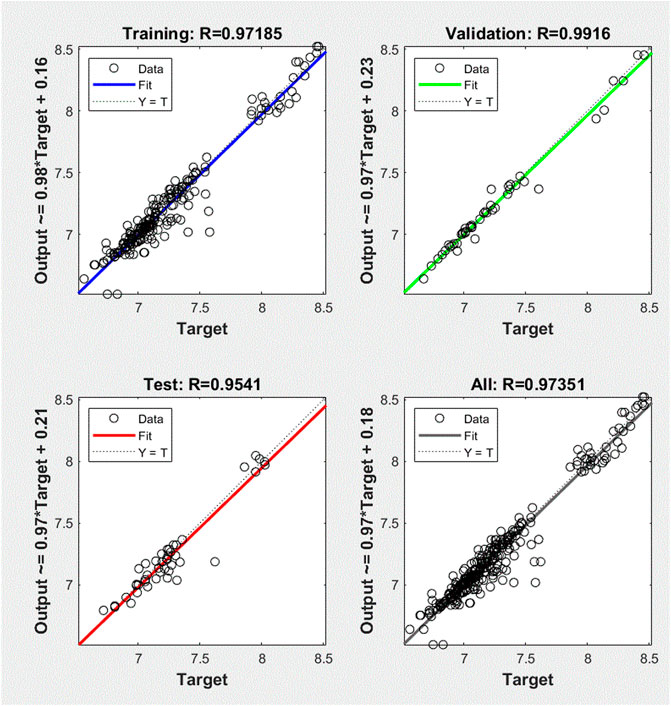
FIGURE 15. Performance of the Trainlim function in predicting the columns’ results.
As respectively shown in Figure 16, the accuracy of the proposed ANN models is verified using the test and numerical data. It is seen in Figures 16A, B that the ANN model developed for predicting the Pn1 reveals similar accuracy for both the training and testing data. In addition, the mean square errors (MSE) provided by the ANN model are much lower than those provided by a simple linear algorithm, in which for the unseen data the MSE increases by 31.6% compared with that of the training data. On average for both the Pn2 training and testing data, the MSE value obtained from the N6-1-1 model was 24.0% less than that of Eq. 14 (see Figures 12, 16B). Moreover, the MSE obtained using the “Trainlm” function was, on average, 0.8% (see Figures 16C,D), which is slightly larger than that obtained using the “nnet” algorithm. The discrepancy in the performance measurements may be attributed to the different approaches used in the analysis; for example, the “Trainlm” function considers the first and second peak axial loads in a unique analysis, whereas the two predictors were independently simulated using the “nnet” algorithm. Overall, the comparison of the ANN results with the experimentally and numerically obtained data shows that the estimated errors are significantly lower than those obtained previously by the existing models (Elchalakani et al., 2020; Hadhood et al., 2017a; Hadhood et al., 2016; Hadi et al., 2020; AlAjarmeh et al., 2019a; AlAjarmeh et al., 2019b; AlAjarmeh et al., 2020) (see Figure 1).
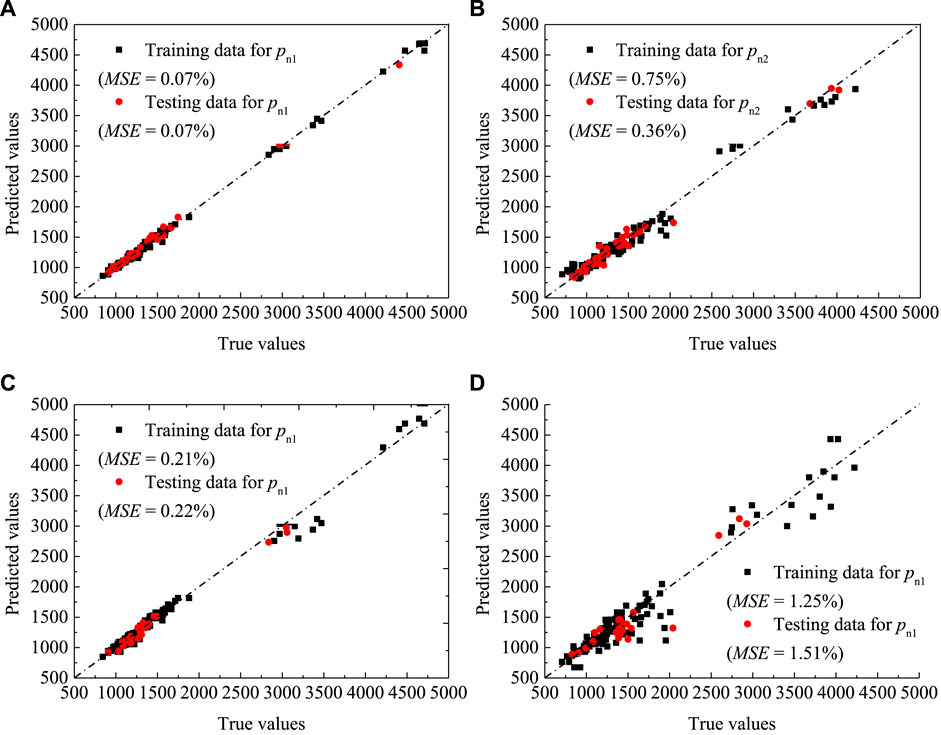
FIGURE 16. Proposed neural network model via the test results: (A,B) Using the “nnet” algorithm; (C,D) Using the “Trainlm” algorithm.
The mechanical behavior of GFRP internally reinforced hollow-core concrete columns was investigated in this paper using both the finite element (FE) and artificial neural network (ANN) techniques. The major findings of the present FE and ANN modeling are provided as follows:
During the FE calibration, the dilation angle value of 30° and concrete’s viscosity parameter equals 1 × 10⁻⁵ are found to have the best performance together with the use of the concrete damage plasticity model (CDPM). In addition, choosing the C3D8R element for concrete and column endplates and T3D2R element for the internal GFRP reinforcing bars with a meshing size of 20 mm for all the model parts revealed acceptable accuracy in simulating the structural response and compressive behavior of hollow-core concrete columns reinforced with internal GFRP reinforcement. The comparison of the numerical results predicted by the proposed FE model and the experimental data available for 29 specimens revealed higher accuracy compared with the existing models. Generally, the correlation coefficient R2 was 99.5% for the first peak load and 97.8% for the second peak load. The crack patterns in the elastic and post-peak stages were simulated and compared in terms of column parameter effects. The crack patterns and failure modes numerically and experimentally obtained were found to be in good agreement. The FE simulation considered different types of column variables, which were carefully investigated and compared with existing findings.
To predict the key experimental results of GFRP-RC columns, Artificial Neural Network (ANN) algorithms are used. The effects of test parameters include the ratio of longitudinal reinforcement, the ratio of GFRP spirals, compressive strength of concrete cylinder, and the ratio of inner-void diameter to gross cross-section diameter. Comparisons of the results given by the suggested ANN models with the test results and effects of various test parameters showed good agreement. They revealed better performance with very limited errors as compared with significant errors by the existing mathematical models. For all 144 experimentally tested and numerically simulated specimens, the correlation coefficient R2 obtained using the ANN was 99.8% for the first peak load and 97.8% for the second peak load. Finally, the relative importance of each test variable has been carefully determined.
The original contributions presented in the study are included in the article/Supplementary Material, further inquiries can be directed to the corresponding author.
Written informed consent was obtained from the individual(s) for the publication of any potentially identifiable images or data included in this article.
HI conceived the presented idea, conducted the simulation and developed the models, and analyzed the data. BT took the lead in writing the manuscript with help from MA and MI. Additional resources are provided by AM and MS.
The authors declare that the research was conducted in the absence of any commercial or financial relationships that could be construed as a potential conflict of interest.
All claims expressed in this article are solely those of the authors and do not necessarily represent those of their affiliated organizations, or those of the publisher, the editors and the reviewers. Any product that may be evaluated in this article, or claim that may be made by its manufacturer, is not guaranteed or endorsed by the publisher.
The authors acknowledge Qujing Normal University, Qujing, Yunnan, China, for facilitating the Structural Concrete Lab.
ABAQUS Version 6.14-2. Providence, RI, USA: Dassault Systèmes, Simulia, 440. Available at: https://www.3ds.com.
ACI 363 (1984). State-of-the-Art Report on High-Strength Concrete (ACI 363R-92). ACI J. Proc. 81, 364–411.
ACI (2015). Guide for the Design and Construction of Structural Concrete Reinforced with Fiber-Reinforced Polymer (FRP) Bars. Michigan, USA: ACI Farmington Hills.
ACI (2006). Guide for the Design and Construction of Structural Concrete Reinforced with FRP Bars. ACI 440, 1.
Afifi, M. Z., Mohamed, H. M., and Benmokrane, B. (2013). Axial Capacity of Circular Concrete Columns Reinforced with GFRP Bars and Spirals. J. Compos Constr. 18 (1). doi:10.1061/(ASCE)CC.1943-5614.0000438
Afifi, M. Z., Mohamed, H. M., and Benmokrane, B. (2014a). Strength and Axial Behavior of Circular Concrete Columns Reinforced With CFRP Bars and Spirals. J. Compos Constr. 18 (2). doi:10.1061/(ASCE)CC.1943-5614.0000430
Afifi, M. Z., Mohamed, H. M., Chaallal, O., and Benmokrane, B. (2014b). Confinement Model for Concrete Columns Internally Confined With Carbon FRP Spirals and Hoops. J. Struct. Eng. 141 (9). doi:10.1061/(ASCE)ST.1943-541X.0001197
Afifi, M. Z., Mohamed, H. M., and Benmokrane, B. (2015). Theoretical Stress-Strain Model for Circular Concrete Columns Confined by GFRP Spirals and Hoops. Eng. Struct. 102, 202–213. doi:10.1016/j.engstruct.2015.08.020
Ahmad, H., Sheikh, M. N., and Hadi, M. N. S. (2021). Experimental Investigation on the Use of Glass Fiber Reinforced Polymer Reinforcement in Hollow‐core Circular Concrete Columns. Struct. Concr. 2021, 1–19. doi:10.1002/suco.202100232
AlAjarmeh, O. S., Manalo, A. C., Benmokrane, B., Karunasena, W., and Mendis, P. (2019b). Axial Performance of Hollow Concrete Columns Reinforced with GFRP Composite Bars with Different Reinforcement Ratios. Compos. Struct. 213, 153–164. doi:10.1016/j.compstruct.2019.01.096
AlAjarmeh, O. S., Manalo, A. C., Benmokrane, B., Karunasena, W., and Mendis, P. (2020). Effect of Spiral Spacing and Concrete Strength on Behavior of GFRP-Reinforced Hollow Concrete Columns. J. Compos. Constr. 24 (1), 04019054. doi:10.1061/(ASCE)CC.1943-5614.0000987
AlAjarmeh, O. S., Manalo, A. C., Benmokrane, B., Karunasena, W., Mendis, P., and Nguyen, K. T. Q. (2019a). Compressive Behavior of Axially Loaded Circular Hollow Concrete Columns Reinforced with GFRP Bars and Spirals. Constr. Build. Mater. 194, 12–23. doi:10.1016/j.conbuildmat.2018.11.016
Alfarah, B., López-Almansa, F., and Oller, S. (2017). New Methodology for Calculating Damage Variables Evolution in Plastic Damage Model for RC Structures. Eng. Struct. 132, 70–86. doi:10.1016/j.engstruct.2016.11.022
Alsayed, S. H., Al-Salloum, Y. A., Almusallam, T. H., and Amjad, M. A. (1999). “Concrete Columns Reinforced by GFRP Rods,” in 4th Int. Symp. On Fiber-Reinforced Polymer Reinforcement for Reinforced Concrete Structures SP-188. Editors C. W. Dolan, S. H. Rizkalla, and A. Nanni (Farmington Hills, MI: American Concrete Institute), 103–112.
Aslani, F., and Jowkarmeimandi, R. (2012). Stress-strain Model for Concrete under Cyclic Loading. Mag. Concr. Res. 64, 673–685. doi:10.1680/macr.11.00120
Atiany, T. A. M., and Sharif, S. (2016). New Statistical Test for Testing Several Correlation Matrices. Glob. J. Pure Appl. Math. 12 (5), 4285–4298.
Beale, M. H., Hagan, M. T., and Demuth, H. B. (2015). Neural Network ToolboxTM User’s guide. https://citeseerx.ist.psu.edu/viewdoc/download?doi=10.1.1.699.4831&rep=rep1&type=pdf
Cascardi, A., Micelli, F., and Aiello, M. A. (2017). An Artificial Neural Networks Model for the Prediction of the Compressive Strength of FRP-Confined Concrete Circular Columns. Eng. Struct. 140, 199–208. doi:10.1016/j.engstruct.2017.02.047
Cassese, P., De Risi, M. T., and Verderame, G. M. (2019). A Degrading Shear Strength Model for R.C. Columns with Hollow Circular Cross-Section. Int. J. Civ. Eng. 17 (8), 1241–1259. doi:10.1007/s40999-018-0381-1
Chellapandian, M., Prakash, S. S., and Rajagopal, A. (2018). Analytical and Finite Element Studies on Hybrid FRP Strengthened RC Column Elements under Axial and Eccentric Compression. Compos. Struct. 184, 234–248. doi:10.1016/j.compstruct.2017.09.109
CSA S806–12 (2012). Design and Construction of Building Components with Fiber-Reinforced Polymers. Mississauga, Ontario, Canada: Canadian Standards Association.
De Luca, A., Matta, F., and Nanni, A. (2010). Behavior of Full-Scale Glass Fiber-Reinforced Polymer Reinforced Concrete Columns under Axial Load. ACI Struct. J. 107 (5), 589–596.
Elchalakani, M., Dong, M., Karrech, A., Mohamed Ali, M. S., and Huo, J.-S. (2020). Circular Concrete Columns and Beams Reinforced with GFRP Bars and Spirals under Axial, Eccentric, and Flexural Loading. J. Compos. Constr. 24 (3), 04020008. doi:10.1061/(ASCE)CC.1943-5614.0001008
Elchalakani, M., Karrech, A., Dong, M., Mohamed Ali, M. S., and Yang, B. (2018). Experiments and Finite Element Analysis of GFRP Reinforced Geopolymer Concrete Rectangular Columns Subjected to Concentric and Eccentric Axial Loading. Structures 14, 273–289. doi:10.1016/j.istruc.2018.04.001
Elmessalami, N., El Refai, A., and Abed, F. (2019). Fiber-reinforced Polymers Bars for Compression Reinforcement: A Promising Alternative to Steel Bars. Constr. Build. Mater. 209, 725–737. doi:10.1016/j.conbuildmat.2019.03.105
Ghanem, S. Y., and Elgazzar, H. (2021). Predicting the Behavior of Reinforced Concrete Columns Confined by Fiber Reinforced Polymers Using Data Mining Techniques. SN Appl. Sci. 3, 170. doi:10.1007/s42452-020-04136-5
Hadhood, A., Mohamed, H. M., and Benmokrane, M. (2016). Axial Load-Moment Interaction Diagram of Circular Concrete Columns Reinforced with CFRP Bars and Spirals: Experimental and Theoretical Investigations. J. Compos Constr. 21 (2), 04016092.
Hadhood, A., Mohamed, H. M., and Benmokrane, B. (2017a). Experimental Study of Circular High-Strength Concrete Columns Reinforced with GFRP Bars and Spirals under Concentric and Eccentric Loading. J. Compos. Constr. 21 (2), 04016078. doi:10.1061/(ASCE)CC.1943-5614.0000734
Hadhood, A., Mohamed, H. M., and Benmokrane, B. (2017b). Strength of Circular HSC Columns Reinforced Internally with Carbon-Fiber-Reinforced Polymer Bars under Axial and Eccentric Loads. Constr. Build. Mater. 141, 366–378. doi:10.1016/j.conbuildmat.2017.02.117
Hadhood, A., Mohamed, H. M., Ghrib, F., and Benmokrane, B. (2017c). Efficiency of Glass-Fiber Reinforced-Polymer (GFRP) Discrete Hoops and Bars in Concrete Columns under Combined Axial and Flexural Loads. Compos. Part B Eng. 114, 223–236. doi:10.1016/j.compositesb.2017.01.063
Hadi, M. N. S., Ahmad, H., and Sheikh, M. N. (2020). Effect of Using GFRP Reinforcement on the Behavior of Hollow-Core Circular Concrete Columns. J. Compos Constr. 25 (1), 06020003. doi:10.1061/(ASCE)CC.1943-5614.0001103
Hadi, M. N. S., Karim, H., and Sheikh, N. (2016). Experimental Investigations on Circular Concrete Columns Reinforced with GFRP Bars and Helices under Different Loading Conditions. J. Compos Constr. 20 (4), 04020008. doi:10.1061/(ASCE)CC.1943-5614.0000670
Hadi, M. N. S., and Le, T. D. (2014). Behaviour of Hollow Core Square Reinforced Concrete Columns Wrapped with CFRP with Different Fibre Orientations. Constr. Build. Mater. 50, 62–73. doi:10.1016/j.conbuildmat.2013.08.080
Hassan, A., Arif, M., and Shariq, M. (2019). Use of Geopolymer Concrete for a Cleaner and Sustainable Environment - A Review of Mechanical Properties and Microstructure. J. Clean. Prod. 223, 704–728. doi:10.1016/j.jclepro.2019.03.051
Hola, J., and Schabowicz, K. (2005). Methodology of Neural Identification of Strength of Concrete. ACI Mater J. 102 (6), 459–464.
Hornik, K., Stinchcombe, M., and White, H. (1989). Multilayer Feedforward Networks Are Universal Approximators. Neural Netw. 2 (5), 359–366. doi:10.1016/0893-6080(89)90020-8
Hoshikuma, J., and Priestley, M. J. N. (2000). Flexural Behavior of Circular Hollow Columns with a Single Layer of Reinforcement under Seismic Loading. SSRP 13.
International Code Council (2015). Concrete Manual Based on the 2015 IBC & and ACI 318–14. Available online: https://shop.iccsafe.org/media/wysiwyg/material/9090S15-TOC.pdf (Accessed October 4, 2015).
Isleem, H. F., Peng, F., and Tayeh, B. A. (2021). Confinement Model for LRS FRP-Confined Concrete Using Conventional Regression and Artificial Neural Network Techniques. Compos Struct. 279, 114779. doi:10.1016/j.compstruct.2021.114779
Isleem, H. F., Tayeh, B. A., Alaloul, W. S., Musarat, M. A., and Raza, A. (2021). Artificial Neural Network (ANN) and Finite Element (FEM) Models for GFRP-Reinforced Concrete Columns under Axial Compression. Materials 14, 7172. doi:10.3390/ma14237172
Isleem, H. F., Wang, D., and Wang, Z. (2018). Axial Stress-Strain Model for Square Concrete Columns Internally Confined with GFRP Hoops. Mag. Concr. Res. 70 (20), 1064–1079. doi:10.1680/jmacr.17.00122
Kusumawardaningsih, Y., and Hadi, M. N. S. (2010). Comparative Behaviour of Hollow Columns Confined with FRP Composites. Compos. Struct. 93 (1), 198–205. doi:10.1016/j.compstruct.2010.05.020
Lee, J.-H., Choi, J.-H., Hwang, D.-K., and Kwahk, I.-J. (2015). Seismic Performance of Circular Hollow RC Bridge Columns. KSCE J. Civ. Eng. 19 (5), 1456–1467. doi:10.1007/s12205-014-1173-z
Liang, X., Beck, R., and Sritharan, S. (2015). Understanding the Confined Concrete Behavior on the Response of Hollow Bridge Columns. Ames, IA: Iowa State Univ.
Lignola, G. P., Prota, A., Manfredi, G., and Cosenza, E. (2007). Experimental Performance of RC Hollow Columns Confined with CFRP. J. Compos. Constr. 11 (1), 42–49. doi:10.1061/(asce)1090-0268(2007)11:1(42)
Lotfy, E. M. (2010). Behavior of Reinforced Concrete Short Columns with Fiber-Reinforced Polymers Bars. Int. J. Civ. Struct. Eng. 1 (3), 545–557.
Majewski, S. (2003). The Mechanics of Structural Concrete in Terms of Elasto-Plasticity. Gliwice, Poland: Publishing House of Silesian University of Technology.
Mansouri, I., Kisi, O., Sadeghian, P., Lee, C.-H., and Hu, J. (2017). Prediction of Ultimate Strain and Strength of FRP-Confined Concrete Cylinders Using Soft Computing Methods. Appl. Sci. 7, 751. doi:10.3390/app7080751
Mansouri, I., Ozbakkaloglu, T., Kisi, O., and Xie, T. (2016). Predicting Behavior of FRP-Confined Concrete Using Neuro Fuzzy, Neural Network, Multivariate Adaptive Regression Splines and M5 Model Tree Techniques. Mater Struct. 49, 4319–4334. doi:10.1617/s11527-015-0790-4
Maranan, G. B., Manalo, A. C., Benmokrane, B., Karunasena, W., and Mendis, P. (2016). Behavior of Concentrically Loaded Geopolymer-Concrete Circular Columns Reinforced Longitudinally and Transversely with GFRP Bars. Eng. Struct. 117, 422–436. doi:10.1016/j.engstruct.2016.03.036
Matthews, F. L., Davies, G., Hitchings, D., and Soutis, C. (2000). Finite Element Modelling of Composite Materials and Structures. Amsterdam, The Netherlands: Elsevier.
Mo, Y., Wong, D., and Maekawa, K. (2003). Seismic Performance of Hollow Bridge Columns. Struct. J. 100 (3), 337–348.
Mohamed, H. M., Afifi, M. Z., and Benmokrane, B. (2014). Performance Evaluation of Concrete Columns Reinforced Longitudinally with FRP Bars and Confined with FRP Hoops and Spirals under Axial Load. J. Bridge Eng. 19, 04014020. doi:10.1061/(asce)be.1943-5592.0000590
Oreta, A. W. C., and Kawashima, K. (2003). Neural Network Modeling of Confined Compressive Strength and Strain of Circular Concrete Columns. J. Struct. Eng. 129 (4), 554–561. doi:10.1061/(asce)0733-9445(2003)129:4(554)
Osada, K., Yamaguchi, T., and Ikeda, S. (1999). Seismic Performance and the Strengthening of Hollow Circular RC Piers Having Reinforcement Cut-Off Planes and Variable Wall Thickness. Concr. Res. Technol. 10, 13–24. doi:10.3151/crt1990.10.1_13
Pantelides, C. P., Gibbons, M. E., and Reaveley, L. D. (2013). Axial Load Behavior of Concrete Columns Confined with GFRP Spirals. J. Compos. Constr. 17 (3), 305–313. doi:10.1061/(ASCE)CC.1943-5614.0000357
Paolino, C. (2017). Seismic Performance of Existing Hollow Reinforced Concrete Bridge Columns. Naples, Italy: University of Naples Federico II. Ph.D. Thesis.
Papanikolaou, V. K., and Kappos, A. J. (2007). Confinement-sensitive Plasticity Constitutive Model for Concrete in Triaxial Compression. Int. J. Solids Struct. 44, 7021–7048. doi:10.1016/j.ijsolstr.2007.03.022
Paramanantham, N. S. (1993). Investigation of the Behavior of Concrete Columns Reinforced with Fiber-Reinforced Plastic Re-bars. Beaumont, TX: Lamar Univ. M.S. thesis.
Pavese, A., Bolognini, D., and Peloso, S. (2004). FRP Seismic Retrofit of RC Square Hollow Section Bridge Piers. J. Earthq. Eng. 8, 225–250. doi:10.1080/13632460409350526
Pinto, A. V., Molina, J., and Tsionis, G. (2003). Cyclic Tests on Large-Scale Models of Existing Bridge Piers with Rectangular Hollow Cross-Section. Earthq. Engng. Struct. Dyn. 32 (13), 1995–2012. doi:10.1002/eqe.311
Prakash, S., Belarbi, A., and You, Y.-M. (2010). Seismic Performance of Circular RC Columns Subjected to Axial Force, Bending, and Torsion with Low and Moderate Shear. Eng. Struct. 32, 46–59. doi:10.1016/j.engstruct.2009.08.014
Raza, A., Khan, Q. U. Z., and Ahmad, A. (2019). Numerical Investigation of Load-Carrying Capacity of GFRP Reinforced Rectangular Concrete Members Using CDP Model in ABAQUS. Adv. Civ. Eng. 2019, 1745341. doi:10.1155/2019/1745341
Raza, A., Ali, B., Masood, B., and ur Rehman, A. (2021). Axial Performance of GFRP Composite Bars and Spirals in Circular Hollow Concrete Columns. Structures 29, 600–613. doi:10.1016/j.istruc.2020.11.043
Sankholkar, P. P., Pantelides, C. P., and Hales, T. A. (2018). Confinement Model for Concrete Columns Reinforced with GFRP Spirals. J. Compos. Constr. 22 (3), 04018007. doi:10.1061/(asce)cc.1943-5614.0000843
Shi, Y., Swait, T., and Soutis, C. (2012). Modelling Damage Evolution in Composite Laminates Subjected to Low Velocity Impact. Compos. Struct. 94, 2902–2913. doi:10.1016/j.compstruct.2012.03.039
Tobbi, H., Farghaly, A. S., and Benmokrane, B. (2014). Behavior of Concentrically Loaded Fiber-Reinforced Polymer Reinforced Concrete Columns with Varying Reinforcement Types and Ratios. ACI Struct. J. 111 (2), 375–386. doi:10.14359/51686630
Tobbi, H., Farghaly, A. S., and Benmokrane, B. (2012). Concrete Columns Reinforced Longitudinally and Transversally with Glass Fiber-Reinforced Polymer Bars. ACI Struct. J. 109 (4), 551–558.
Turmo, J., Ramos, G., and Aparicio, A. C. (2009). Shear Truss Analogy for Concrete Members of Solid and Hollow Circular Cross Section. Eng. Struct. 31 (2), 455–465. doi:10.1016/j.engstruct.2008.09.002
Yeh, Y., Mo, Y. L., and Yang, C. Y. (2001). Seismic Performance of Hollow Circular Bridge Piers. Struct. J. 98 (6), 862–871.
Yeh, Y.-K., Mo, Y. L., and Yang, C. Y. (2002). Seismic Performance of Rectangular Hollow Bridge Columns. J. Struct. Eng. 128 (1), 60–68. doi:10.1061/(asce)0733-9445(2002)128:1(60)
Youssf, O., ElGawady, M. A., Mills, J. E., and Ma, X. (2014). Finite Element Modelling and Dilation of FRP-Confined Concrete Columns. Eng. Struct. 79, 70–85. doi:10.1016/j.engstruct.2014.07.045
Zahn, F., Park, R., and Priestley, M. (1990). Flexural Strength and Ductility of Circular Hollow Reinforced Concrete Columns without Confinement on inside Face. Struct. J. 87 (2), 156–166.
Zeng, X. (2016). Finite Element Modelling and Analysis of Concrete Confined by Stirrups in Square RC Columns. Civ. Eng. J. 17, 1–11. doi:10.14311/cej.2016.03.0017
Keywords: FRP-reinforced columns, hollow-core concrete, axial strength, confined concrete, Finite element analysis, compression
Citation: Isleem HF, Tayeh BA, Abid M, Iqbal M, Mohamed AM and Sherbiny MGE (2022) Finite Element and Artificial Neural Network Modeling of FRP-RC Columns Under Axial Compression Loading. Front. Mater. 9:888909. doi: 10.3389/fmats.2022.888909
Received: 03 March 2022; Accepted: 11 April 2022;
Published: 18 May 2022.
Edited by:
Yu-Fei Wu, RMIT University, AustraliaReviewed by:
Jun-Jie Zeng, Guangdong University of Technology, ChinaCopyright © 2022 Isleem, Tayeh, Abid, Iqbal, Mohamed and Sherbiny. This is an open-access article distributed under the terms of the Creative Commons Attribution License (CC BY). The use, distribution or reproduction in other forums is permitted, provided the original author(s) and the copyright owner(s) are credited and that the original publication in this journal is cited, in accordance with accepted academic practice. No use, distribution or reproduction is permitted which does not comply with these terms.
*Correspondence: Haytham F. Isleem, aXNsZWVtaGF5dGhhbTg4QGdtYWlsLmNvbQ==
Disclaimer: All claims expressed in this article are solely those of the authors and do not necessarily represent those of their affiliated organizations, or those of the publisher, the editors and the reviewers. Any product that may be evaluated in this article or claim that may be made by its manufacturer is not guaranteed or endorsed by the publisher.
Research integrity at Frontiers
Learn more about the work of our research integrity team to safeguard the quality of each article we publish.