 Yidi Shen
 William L. Johnson2*
 Qi An
Qi An- 1Department of Chemical and Materials Engineering, University of Nevada-Reno, Reno, NV, United States
- 2Department of Materials Science, California Institute of Technology, Pasadena, CA, United States
- 3I. Physikalisches Institut, University of Goettingen, Goettingen, Germany
- 4Materials and Process Simulation Center, California Institute of Technology, Pasadena, CA, United States
We identified two glass phases formed in three undercooled liquids of elemental Ag, binary Cu-Ag, and binary Cu-Zr alloys using molecular dynamics (MD) simulations: 1) The homogeneous L-phase arises from quenching quickly from high temperature liquid. 2) The heterogeneous solid-like G-phase arises from the isothermal equilibration at temperatures below the melting point. The G-phase exhibits a core-shell structure with the ordered cores surrounded by percolating liquid-like shells. The distinguishable structures between these two phases are expected to different mechanical behavior. The present study reports MD simulations to compare the shear deformation of these two phases in binary Cu2Zr system. At room temperature, the G-phase exhibits a higher critical stress, a higher critical strain, and higher shear modulus than the L-phase, suggesting that the G-phase has improved strength and rigidity compared to the homogeneous L-phase. The plastic yielding mechanism of both the G-phase and L-phase is accompanied by shear band formation. However, the formation of shear band in G-phase is confined by the cores to a highly localized region and characterized by local mechanical melting. In contrast, the shear band in L-phase exhibits greater width and much more homogenous character. We conclude that the mechanical properties of a metallic glass will vary significantly according to the type of glassy phase formed during processing.
Introduction
The mechanical properties of bulk metallic glasses (BMGs) have stimulated much interest due to such outstanding properties as high strength, large elastic strain limit, and good fracture toughness. However, the BMGs normally show low plasticity at room temperature, which limits extended applications (Gu et al., 2007; Li et al., 2013; Yang et al., 2019; Wu et al., 2021). The low plasticity originates from the unique deformation mechanism under loading, which is different from typical crystalline metals. BMGs tend to form highly localized shear bands due to the lack of dislocation systems and grain boundary structures (Pekarskaya et al., 2001; Yang et al., 2005; Schuh et al., 2007; Greer et al., 2013). These shear bands are much softer and more susceptible to subsequent flow than surrounding regions (Greer et al., 2013). Thus, plastic strains are localized within the shear bands while regions outside the shear bands deform elastically, which leads to the low global plasticity of BMGs (Klaumünzer et al., 2011; Tang et al., 2016). The soft shear bands have been widely observed in previous studies. For example, a single shear band in Zr-based BMGs has been isolated in a recent experimental study (Maaß et al., 2014). Even though the width of the shear band is of the order of some nanometers, the region showing structural softening due to the shear band has micrometer width. Thus, to understand and improve the mechanical properties for future engineering applications, it is essential to understand the mechanism of shear band formation.
Many studies have focused on understanding the failure mechanism and improving the mechanical properties of various BMG systems. Regarding the failure mechanism, it was proposed that the shear bands arise from the generation of free volume around the atoms to facilitate atomic motion and nucleating shear bands (Yang et al., 2005; Spaepen, 2006; Dai and Bai, 2008; Tang et al., 2016). In addition, adiabatic heating and softening is reported as another factor for localization of plasticity in BMGs. Local heating beyond glass transition temperature produces thermal softening, resulting in rapid shear band propagation and structural failure in BMGs (Lewandowski and Greer, 2006; Yang et al., 2006; Dai and Bai, 2008; Wang et al., 2015). Regarding the improvement of mechanical properties, several approaches have been developed to improve the global plasticity of BMGs at room temperature. This includes structure modifications (Hays et al., 2000; Szuecs et al., 2001; Schroers and Johnson, 2004; Lee et al., 2006; Liu et al., 2007; Chen et al., 2008), elastostatic compression (Lee et al., 2008), and ion irradiation (Ke et al., 2011). For example, a family of BMGs consisting of ZrCuNiAl were synthesized by choosing the composition to maximize the Poisson ratio (Liu et al., 2007). The ZrCuNiAl BMGs can undergo a true strain in compression as large as 160% without failure. TEM investigations on the microstructure of BMG composites indicate that these super plastic BMGs are composed of alternating hard regions and soft regions. Consequently, the shear transformation zones (STZ) prefer to activate in soft regions leading to numerous shear bands under loading. Propagation of the shear bands is arrested by hard regions, which encourages shear-band multiplication. Multiplication of the shear bands assists the enhanced global plasticity in the BMG composites.
The mechanical properties of BMGs are expected to be related to the local atomistic structure. In our recent MD simulations, we identified two glass phases in both elementary Ag and binary (Ag-Cu and Zr-Cu) liquids (An et al., 2020a; 2020b, 2021, 2022). When the metallic liquids are ultrafast quenched to room temperature (quench rate: ∼1012 K/s), the homogeneous liquid-like L-phase glass forms. In contrast, if the metallic liquid is quenched to intermediate temperatures below melting temperature, it evolves isothermally to the heterogeneous solid-like G-phase glass through a first order freezing transition. Unlike the homogenous L-phase, the G-phase possesses local core regions with crystalline-like short-range order surrounded by a liquid-like matrix. In particular, for Ag and Cu-Ag alloys, the core regions of the G-phase are mainly composed of crystalline-like FCC + HCP short range order with a heterogeneity correlation length scale Λ ∼4 nm in pure Ag metals decreasing to Λ ∼2 nm in the eutectic Ag-Cu system (An et al., 2020b). For Cu-Zr alloy, the core regions of G-phase show icosahedral short-range order, with correlation length Λ in the range of 1.5–1.8 nm(An et al., 2022). We also calculated the shear modulus and viscosity of both G-phase and L-phases from MD simulations. The G-phase has much higher elastic modulus and viscosity compared to the L-phase, suggesting the G phase shows greater elastic rigidity (An et al., 2020a; 2020b, 2022). Besides, a recent theoretical study shows formation of a partially crystalized glass phase in Cu2Zr metallic liquid when isothermally holding at 950 K. This ordered state exhibits icosahedral structural character, which is similar to the G-phase in our study(Yue et al., 2020). Evidence for the existence of these two glass phases in BMG forming alloys has also been reported in the recent experimental studies. In the ultra-fragile Pt–Cu–P ternary alloy system, the glass transition evolves to an apparent first-order melting transition with varying composition (Na et al., 2020). This study suggests the existence of two amorphous glass phase: a high temperature disordered liquid-like glassy L-phase and a configurationally ordered lower temperature solid-like G-phase glasses. The G-phase like metallic glacial glass (MGG) was synthesized by a first order transformation of an initially quenched metallic glass phase (MG) that was reheated into the supercooled liquid of a La32.5Ce32.5Co25Al10 alloy (Shen et al., 2020). The MGG-phase exhibits a first-order melting-like transition to the disordered liquid phase upon subsequent rapid heating. The hardness of the MGG phase is 20% higher compared to the initially quenched metallic glass (MG), providing further evidence of two distinct glass/liquid phases.
In the present study, we focus on the binary Cu2Zr system and perform MD simulations to examine shear deformation behavior of both the L-phase and the G-phase at room temperature. Our simulations show that the critical shear stress and shear modulus of the G-phase (2.82 GPa for critical shear stress and 29.97 GPa for shear modulus) are both much greater than those of the L-phase (1.25 GPa for critical shear stress and 17.93 GPa for shear modulus). This suggests that the G-phase is stronger and exhibits greater rigidity compared to the L-phase. In addition, the G-phase has a larger critical shear strain (0.15) than that of L-phase (0.10). Thus, the G-phase is both stiffer and stronger than L-phase. Further analysis of the yielding mechanism indicates that shear strain localization (shear band formation) occurs for both G-phase and L-phases, following initial yielding. Within the localized shear band, the ordered core regions of the G-phase appear to lose their icosahedral character during shear sliding, this suggests local mechanical melting within the shear band. In contrast, the L-phase exhibits much broader and more diffuse shear band apparently related to its more homogenous structural character. After G-phase and L-phase reaches their steady flow state, their response under following cyclic loading exhibits the Bauschinger effect. The reason might be that the atoms in soft shear band have higher mobility and less resistance to shear. The plastic deformation in these structures becomes dominated earlier compared to unsheared structures.
Methods
Model Construction and MD Simulations
All MD simulations were performed using the LAMMPS code (Plimpton, 1995). Sheng’s Cu–Zr embedded atom model (EAM) potential is applied in MD simulations to describe the interatomic interactions (Cheng et al., 2009). The velocity Verlet algorithm is used for integrating the equations of motion with a timestep of 1.0 fs in all simulations. Periodic boundary conditions (PBC) along all three directions are used to eliminate surface effects in all simulations except for the shear deformation.
The L-phase is obtained from ultrafast quenching, which is similar to our previous studies (An et al., 2021, 2022). Firstly, the liquid with 41,472 atoms is equilibrated at 2000 K using the NPT ensemble for 1ns. Then, the liquid is quenched from 2000 K to room temperature with a high cooling rate of 2.125 × 10¹² K/s. In contrast, the G-phase is produced by isothermal aging the supercooled liquid at 900 K for 750 ns, as discussed in our previous work (An et al., 2022). Then, the G-phase is quenched to room temperature using the same cooling rate as for the L-phase (2.125 × 10¹² K/s). Next, both L-phase and G-phase are relaxed at room temperature for 16 and 1 ns using NPT dynamics until reaching equilibrium, respectively.
After obtaining the equilibrium L-phase and G-phase at room temperature, we apply finite shear rate deformations to examine their shear-induced failure processes. Here, our model is partitioned into three layers: the 0.5 nm thick immobile lower layer, the 0.5 nm thick immobile upper layer, and the mobile layer between these two layers with thickness of 7.6 nm for L-phase and 8.5 nm for G-phase, as shown in Figure 1. Then, a fixed velocity of 20 m/s along the shear direction is assigned to the atoms in the upper layer while the atoms in the lower layer are fixed. The velocities of atoms in the mobile layer increases from 0 to 20 m/s on top of their thermal velocities at 300 K. The corresponding engineering strain rate for all simulations is ∼0.002 ps−1. We also consider lower strain rates of 0.0002 ps−1 and 0.00002 ps−1 to investigate the effects of strain rate on shear deformation of both G-phase and L-phase. During the shear deformation, the NVE ensemble is applied to for the mobile atoms. Meanwhile, the velocities of two non-sheared directions for the atoms in the mobile layer is rescaled every 100fs to maintain 300 K for the system.
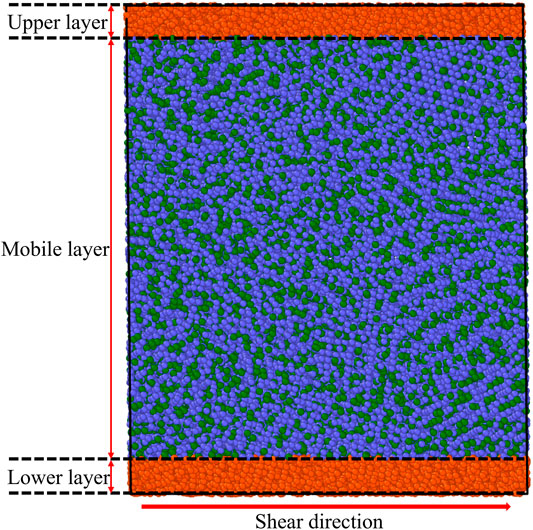
FIGURE 1. An example illustrating the model for the shear deformation. During shear deformation, the atoms in the lower layer are fixed and the atoms in upper layer have the maximum velocity of 20 m/s along the shear direction. The velocity of atoms in the mobile layer increases linearly from the bottom boundary to the upper boundary. In the mobile layer, the Cu and Zr atoms are represented by blue and green balls.
Plastic Yielding and Flow Mechanism Analysis: Atomic Structure Analysis and Bond-Orientational Order Parameter
To analyze the structural changes during shear band formation and steady state shear, we calculated the atomic von Mises strains (Shimizu et al., 2007) using the software OVITO (Stukowski, 2010). The atomic von Mises strains are examined based on the particle displacement vectors of current atomistic configuration referenced to the initial structure (Shimizu et al., 2007; Tucker et al., 2011). A large von Mises strain suggests a large local atomic strain.
The local ordered structures during the shear deformation are analyzed using the bond-orientational order parameters (BOOP), ql (l = 2,4,6,8, … ) (Steinhardt et al., 1983; Mickel et al., 2013). In BOOP, the ql are sensitive to local atomic symmetries in the bond angles, which are compared to values for ideal lattices. This allows analysis of the atomic arrangements on the level of individual constituents. In this study, q8 parameters were adopted to identify the structural change because they are sensitive to the icosahedral structure in the G-phase and the disordered structure in the L-phase (An et al., 2022). Note that the cut-off range of each atomic site relative to its neighboring atoms for both the atomic strain and the BOOP analysis is determined using the first minimum value following the first maximum of the radial distribution function.
Results and Discussion
The Flow Mechanism of G-phase Under Shear Deformation
The local atomic structure of the G-phase at room temperature is characterized using BOOP analysis, as shown in Figure 2A. This structure shows a heterogenous character being composed of two different configurational regions: a icosahedral-ordered core region with low OP-8 surrounded by a percolating liquid-like disordered matrix with high OP-8 (An et al., 2022).
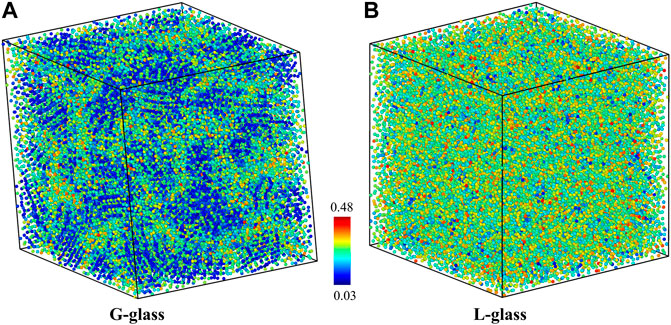
FIGURE 2. The L-phase and G-phase at room temperature characterized using OP-8 bond-orientational order parameters analysis: (A) G-phase and (B) L-phase.
We performed the shear deformation of G-phase at room temperature. The predicted shear-stress-shear-strain relationship of the G-phase is shown in Figure 3. The predicted critical shear stress is 2.82 GPa at a shear strain of 0.15. Before the shear stress reaches its maximum value, the G-phase first undergoes an elastic deformation at a calculated shear modulus of 29.97 GPa. Then the shear stress reaches a peak followed by a continuous decrease from the maximum shear stress to ∼1.0 GPa with an increase of shear strain up to 0.22, suggesting plastic flow in the G-phase. The flow behavior of the G-phase under shear deformation is shown in Figure 4. To analyze the plasticity mechanism, we display the atomic von Mises shear strain maps during shear deformation. Figure 4A shows the intact structure before shear. As the shear strain increases to 0.15, which corresponds to the peak shear stress of 2.82 GPa, the structure deforms elastically, as shown in Figure 4B. Note that the atoms in the core regions experience relatively smaller shear strain compared to the atoms in the surrounding disordered region up to 0.15 shear strain. As the shear strain increases further continuously, a shear band nucleates and then propagates along the shear direction, leading to relaxation of the overall shear stress as well as localization of the shear strain into a shear band. In particular, at 0.22 shear strain, a shear band having a width of ∼3 nm propagates across the entire G-phase MD cell, which correlates with the stress drop to ∼1.0 GPa, as shown in Figure 4C. Interestingly, the width of the formed shear band varies along the shear direction while a region with low atomic strain exists inside the shear band near the sample boundaries along the x-axis. This suggests that this shear band may actually be bifurcated.
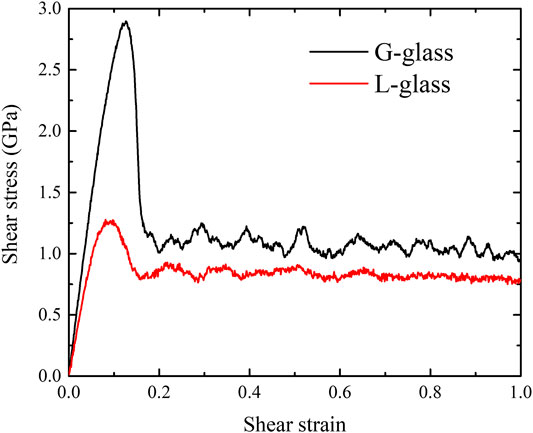
FIGURE 3. The shear-stress-shear-strain relationships of both G-phase and L-phase under shear deformation at room temperature.
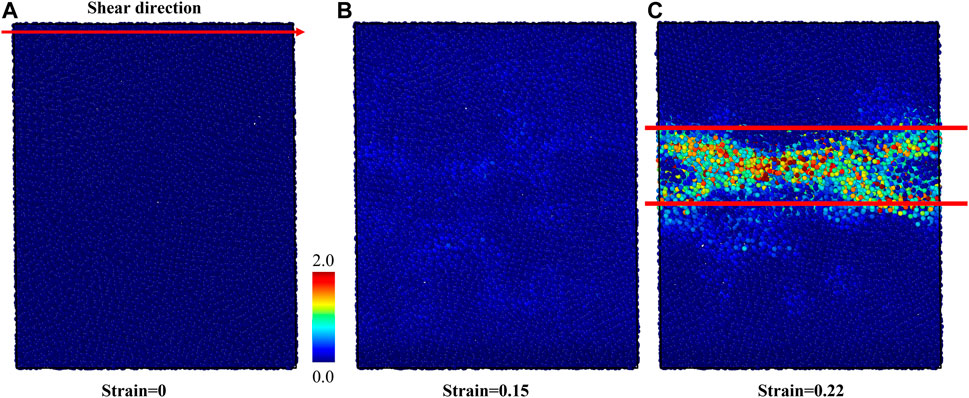
FIGURE 4. The atomic von-Mises strain map of G-phase under the shear deformation. (A) The intact structure, (B) the structure at 0.15 shear strain before the initiation of shear band, and (C) the structure at 0.22 shear strain after forming the shear band.
To understand the plasticity mechanism of shear band sliding in the G-phase, the BOOP analysis was performed to investigate the evolution of locally ordered structures during shear band sliding. The OP-8 order parameters are adopted to examine the local structures during the shear deformation. The intact structure before shear is shown in Figure 5A in which the core regions and surrounding disordered matrix regions can be clearly delineated. At 0.15 shear strain, the OP-8 values in the core regions begin to increase compared to the intact structure due to the evolving plastic shear strain, as shown in Figure 5B. However, not all core regions are deconstructed at this shear strain. As the global shear strain increases to 0.22, a shear band core with high OP-8 forms, which agrees with the atomic strain map, as shown in Figure 5C. More important, as strain increases, part of the core regions lying within the shear band transform from the ordered structure (low OP-8) to the disordered structure (high OP-8), suggesting that the shear band sliding in the G-phase arises from mechanical melting of these core regions. In addition, the plasticity is clearly localized and correlated with the results of OP-8 and is consistent with the results from atomic von-Mises strain. The nearby core region with a crystal-like local structure appears to block the propagation of the shear band.
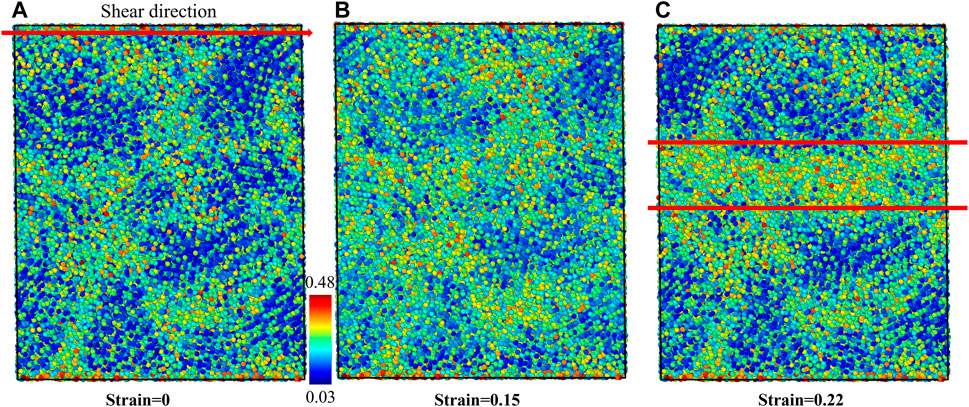
FIGURE 5. The structural changes of G-phase under shear deformation characterized using OP-8 order parameter. (A) The intact structure, (B) the structure at 0.15 shear strain before the initiation of shear band, and (C) the structure at 0.22 strain after forming the shear band. The shear band is displayed between two solid red lines at (C).
After the G-phase reaches plastic-flow state at 1.0 shear strain, we then applied reversed shear strain to investigate its response under opposite loading condition. The obtained shear-stress-shear-strain relationship is shown in Figure 6A. During the shear deformation along reversed direction, the stress quickly decreases to 0 and then increases to the same absolute value of steady-state flow stress (∼1.0 GPa). After G-phase reaches the plastic flow state again, we switched the shear direction one more time to the initial direction and further explored the plastic evolution of G-phase under cyclic loading. Similar to the response during the shear deformation along reversed direction, the shear stress quickly flips back and then shows a steady flow with the value of ∼1.0 GPa, as shown in Figure 6A. This stress reversal under cyclic loading indicates the Bauschinger effect (Karmakar et al., 2010; Frahsa et al., 2013; Urata and Li, 2018; Patinet et al., 2020) in G-phase under pure shear deformation. In order to understand the origin of this phenomenon, we then used OP-8 order parameters to examine the evolution of local structures. The structures at 0 and 1 shear strains, which correspond to the final structures when shear along both opposite and initial directions, are shown in Figures 6B,C. Compared to the structure after forming the shear band (Figure 5C) during the initial shear deformation, no obvious structural change is observed in these two structures. Thus, the Bauschinger effect for G-phase might be explained by the composite model (Pedersen et al., 1981; Sun et al., 2014). Under the initial loading, the formation of shear band suggests the existence of both the softer region (shear band) and the harder region (surrounding undeformed region) in plastic deformed G-phase (Greer et al., 2013). When loading is reversed, the atoms in the shear band have higher mobility and less resistance to shear than those in the surrounding regions (Sun et al., 2014). Therefore, the formed shear band can plastically deform earlier than the initially unsheared structure, causing the Bauschinger effect.
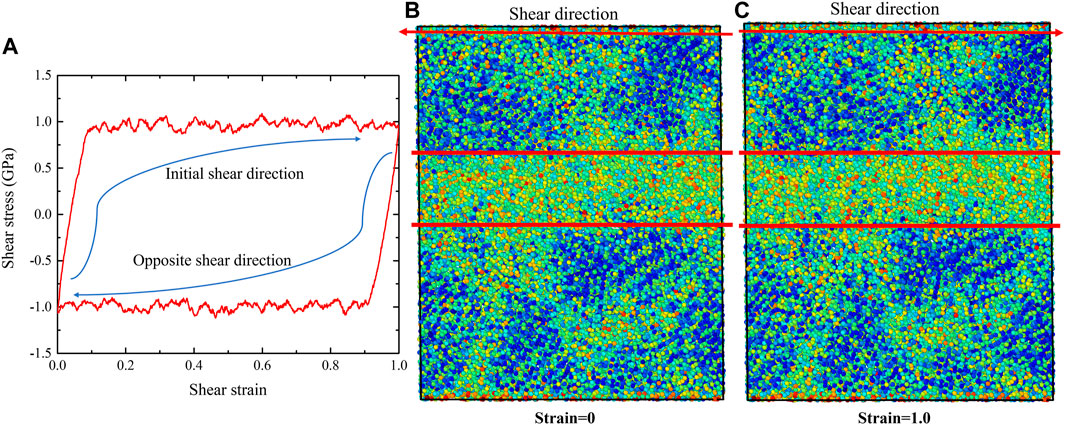
FIGURE 6. The Bauschinger effect in G-phase after reaching to the state of plastic flow. (A) the shear-stress-shear-strain relationships of G-phase under cyclic shear deformation, (B) the final structure characterized using OP-8 order parameter when shear along opposite direction, and (C) the final structure characterized using OP-8 order parameter when shear along initial direction.
From the results of both atomic strain and BOOP analyses, we conclude that the plastic flow mechanism of the G-phase under shear deformation arises from local mechanical melting of core regions within the operating of a shear band. In addition, the nearby icosahedral-ordered core regions apparently obstruct and deflect propagation of the shear band, causing additional localization of the shear band between surrounding core regions. After G-phase reaches plastic-flow state, it follows the plastic manner of Bauschinger effect under cyclic loading. This might result from the formed soft shear band that has less resistance to shear and can plastically deform earlier than initially unsheared structure.
Strain rate is an important factor for the shear deformation. To illustrate the strain rate effects, we considered two lower strain rates of 0.0002 ps−1 and 0.00002 ps−1 for the G-phase. The shear-stress-shear-strain relationships obtained at various train rates are shown in Figure 7A. When the strain rate decreases from 0.002 ps−1 to 0.0002 ps−1, both the critical shear stress and shear strain before plastic flow decrease from 2.82 GPa and 2.42 GPa to 0.15 and 0.12, respectively. The steady flow stress also decreases from ∼1.0 to 0.8 GPa. However, as the strain rate further decreases to 0.00002 ps−1, peak stress, critical strain, and steady flow stress decrease slightly compared to those values under the strain rate of 0.0002 ps−1.
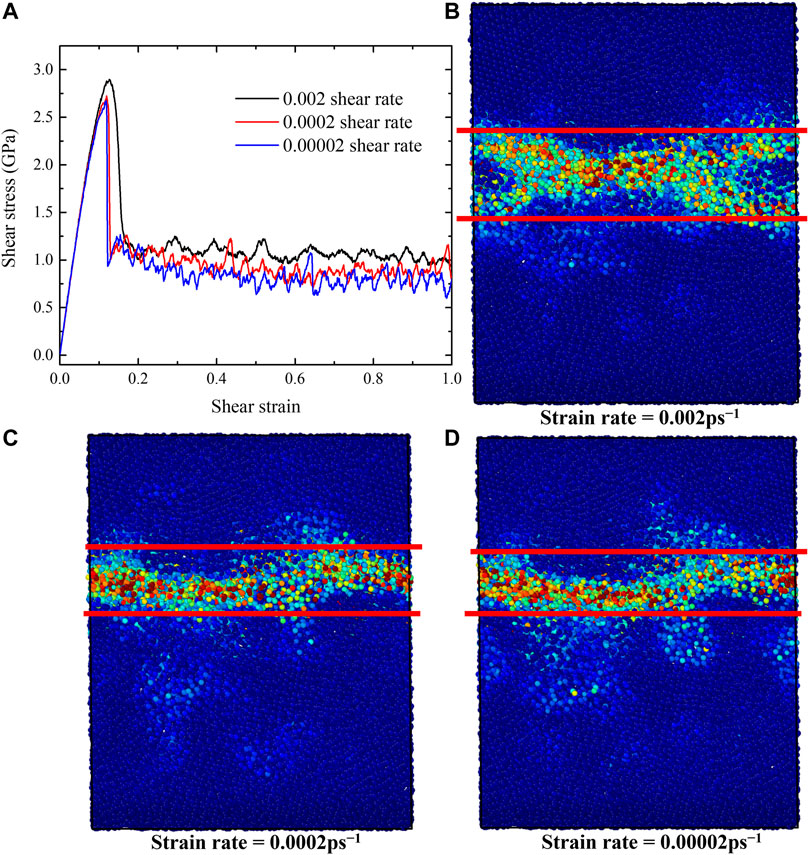
FIGURE 7. The shear-stress-shear-strain relationships and the atomic von-Mises strain map of G-phase with various strain rates ranging from 0.00002 to 0.002 ps−1. (A) The shear-stress-shear-strain relationships, (B–D) the von-Mises strain maps after forming shear band under different strain rates of (B) 0.002 ps−1, (C) 0.0002 ps−1, and (D) 0.00002 ps−1.
In order to explore the effects of strain rate on flow mechanism of G-phase, we employed von-Mises shear strain maps and BOOP (op-8) to characterize the atomistic structures after forming shear band, as shown in Figures 7B–D and Figure 8. The shear band has a width of ∼2.0 nm under strain rates of 0.0002 ps−1 and 0.00002 ps−1. It is ∼1 nm narrower than the shear band formed under the strain rate of 0.002 ps−1 (∼3 nm). These results indicate that a lower strain rate decreases the peak stress, the critical strain, the steady flow stress, and the width of the shear band for the G-phase. But when the strain rate decreases to ∼0.0002 ps−1, the effects of strain rate on G-phase become negligible.
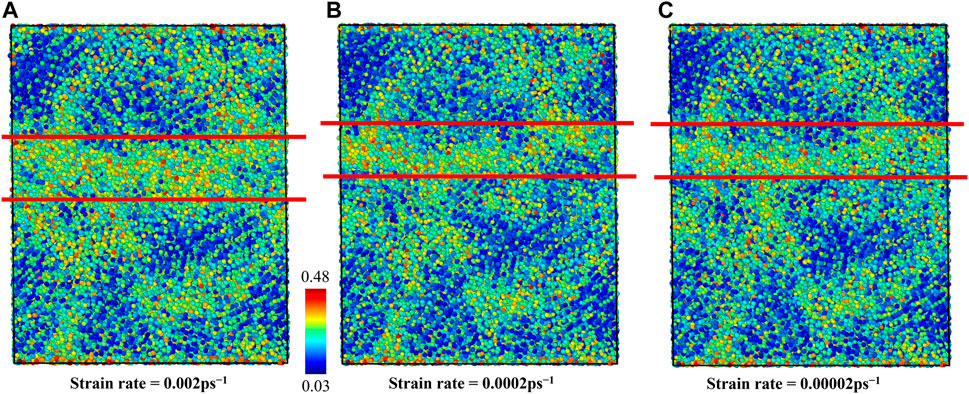
FIGURE 8. The shear band formed in the G-phase characterized using OP-8 order parameter under various strain rates of (A) 0.002 ps−1, (B) 0.0002 ps−1, and (C) 0.00002 ps−1.
The Plasticity Mechanism of L-phase Under Shear Deformation
We now examine the shear deformation of the L-phase and compare to the G-phase. The equilibrium structure of the L-phase is characterized using the OP-8 at room temperature, as shown in Figure 2B. In contrast to the G-phase, the L-phase exhibits a more homogeneous structural character, which is consistent with the previous study (An et al., 2022). Next, a finite shear is applied to the L-phase. The predicted shear-stress-shear-strain relationship at room temperature is shown in Figure 3. The critical shear stress is ∼1.25 GPa, which is 1.57 GPa lower than for the G-phase. Moreover, the critical shear strain of L-phase is 0.10, also smaller than that of G-phase (0.15). Thus, the L-phase has a much lower yield stress and yield strain than the G-phase. The predicted shear modulus of L-phase from stress-strain curve (17.93 GPa) is also much lower than that of G-phase(29.97 GPa). The G-phase possesses higher strength, higher elastic modulus, and higher elastic strain limit.
The plasticity mechanism of L-phase was analyzed using atomic von-Mises strain, as shown in Figure 9. The intact structure before shear is shown in Figure 9A. With the shear strain increasing toward 0.1, the structure deforms elastically. At 0.1 shear strain, corresponding to the critical stress, some atoms show a slightly higher shear strain, suggesting that initiation of plasticity is not uniform on the atomic scale, as indicated by the speckle pattern in Figure 9B. With increasing shear strain up to 0.24, a shear band is formed and plastic flow becomes localized in the L-phase along shear direction. The initiation of the shear band relaxes the overall global shear stress. In particular, at 0.24 shear strain, we observe that the shear band has a width of ∼4 nm (Figure 9C). The global shear stress relaxes to ∼0.8 GPa. This value is significantly lower than the final steady state stress for the G-phase (1.1 GPa), which is apparently related to the homogeneous structure of the L-phase versus the heterogeneous character of the G-phase. Heterogeneity may also explain why the shear band in L-phase is less spatially localized than in the G-phase. We also applied the BOOP analysis to investigate the local structural changes in the L-phase under the shear deformation. The OP-8 values for the initial structure and the structure after shear band formation are shown in Figure 10. Due to the homogeneous structural character of the L-phase, we see no obvious local atomic structural evolution within the shear band.
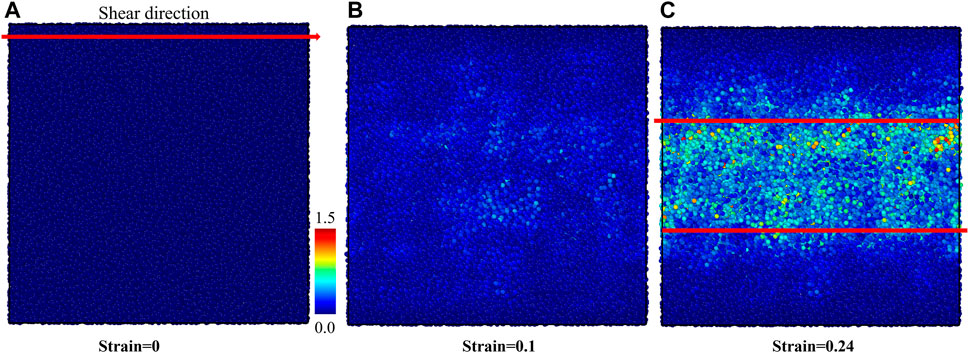
FIGURE 9. The atomic von-Mises shear strain map of L-phase under the shear deformation. (A) The intact structure, (B) the structure at 0.1 shear strain before the initiation of shear band, and (C) the structure at 0.24 strain after forming the shear band.
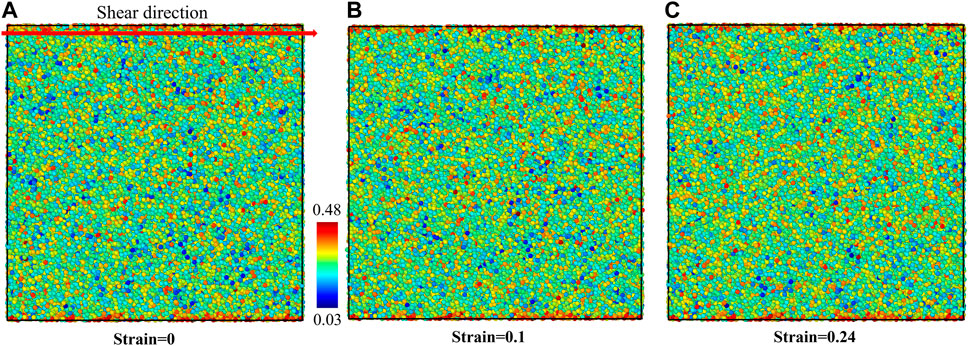
FIGURE 10. The structural evolution of L-phase under shear deformation characterized using OP-8 order parameter. (A) The intact structure, (B) the structure at 0.10 shear strain before initiation of shear band, and (C) the structure at 0.24 shear strain after forming the shear band.
After obtaining the plasticity mechanism of L-phase, we also investigated the response of plastic-deformed L-phase during cyclic shear deformation. The obtained shear-stress-shear-strain relationship also exhibits typical Bauschinger effect, as shown in Figure 11. When shear along reversed or initial direction, the shear stress quickly flips back and reaches the plastic flow with value of ∼0.8 GPa. This phenomenon is similar to the response of G-phase under cyclic loading.
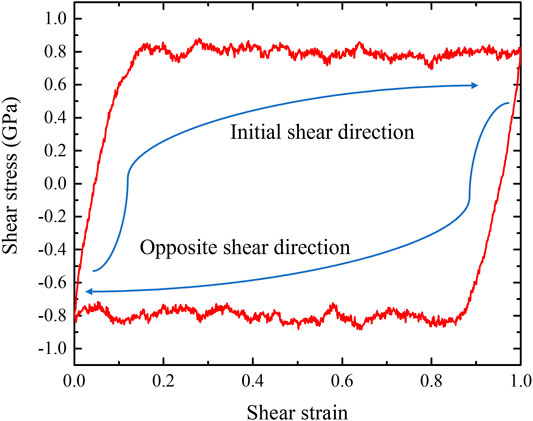
FIGURE 11. The Bauschinger effect in L-phase after reaching to the state of plastic flow.
Summarizing, the homogeneous L-phase structure shows a significantly lower critical stress, a lower yield strain, and lower shear modulus compared to the G-phase. The plastic yielding of the L-phase under shear deformation is accompanied by formation of a shear band, which is similar to the case of the G-phase. However, the L-glass shear band is much less spatially localized than the shear band in the G-phase. This is apparently related to the homogeneous disordered structure of the L-phase. Moreover, in the L-phase glass no local atomic structural evolution is observed from the bond-orientational order parameters analysis. In addition, after the L-phase reaches the plastic flow, it also exhibits the Bauschinger effect under cyclic loading.
For the strain rate effects on shear deformation of L-phase, the shear-stress-shear-strain relationships under various strain rates are shown in Figure 12A. With the decrease of strain rate, both the critical shear stress and shear strain before plastic flow decreases, suggesting that the lower strain rate decreases the yield stress and yield strain of the L-phase. In addition, the steady flow stress also decreases from ∼0.8 GPa at strain rate of 0.002ps−1 to ∼0.7 GPa at strain rate of 0.00002 ps−1. Considering the flow mechanism, a similar shear band with a width of ∼4 nm forms under all three strain rates (Figures 12B–D). This suggests that plastic flow mechanism remains the same for L-phases under various strain rates.
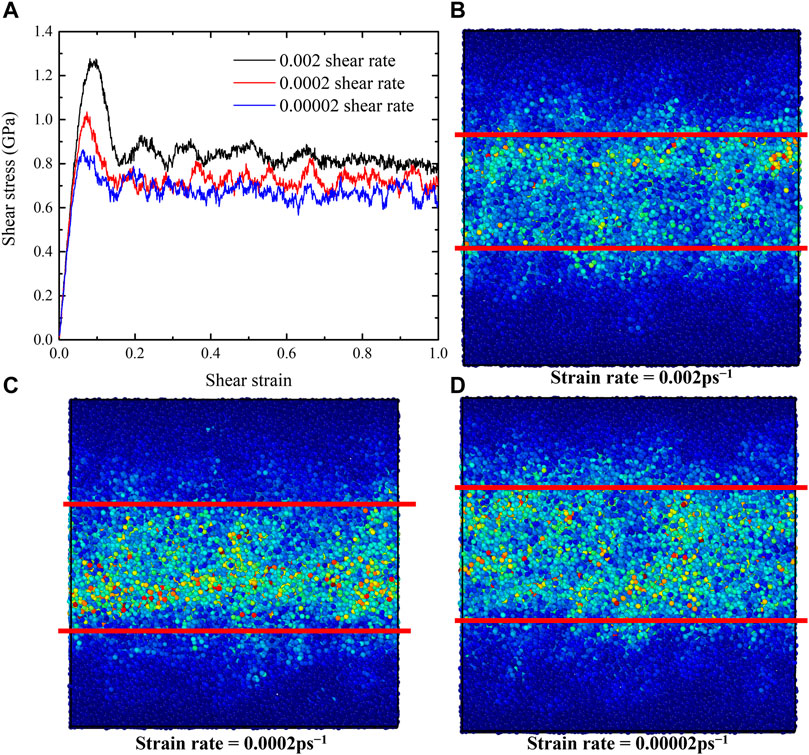
FIGURE 12. The shear-stress-shear-strain relationships and the atomic von-Mises strain map of L-phase under various strain rates ranging from 0.00002 to 0.002 ps−1. (A) The shear-stress-shear-strain relationships, (B–D) the atomic von-Mises strain maps at 0.24 shear strain with different strain rates of (B) 0.002 ps−1, (C) 0.0002 ps−1, and (D) 0.00002 ps−1.
Conclusion
In this study, we examine the binary Cu2Zr system as a model system, applying MD simulations to illustrate the mechanical properties and shear deformation of both the G-phase and the L-phase. We find that the G-phase exhibits a higher critical shear stress, a higher elastic strain limit, and a higher shear modulus compared with the L-phase. The plastic yielding and flow of both the G-phase and L-phase are accompanied by spatial strain localization and shear band formation. For the heterogeneous G-phase, plasticity within the operating shear band is accompanied by local mechanical melting of the icosahedral-ordered core regions. Due to its heterogeneous structural character, the propagation of the shear band in the G-phase is inhibited by the surrounding hard-core regions. The shear bands in the plastic regime tend to localize in the disordered liquid like regions between the core regions. In contrast, the shear band formed in the L-phase is broader and more diffuse. We suggest that this is related to the more homogeneous disordered structural character of the L-phase. In addition, no apparent atomic level structural changes were observed with initiating the shear band in the L-phase case. It is also worth noting that Bauschinger effect under cyclic loading is observed in both G-phase and L-phase after reaching their state of plastic flow. Regarding the strain rate effects on shear deformation, we find that a lower strain rate decreases the peak stress, the critical strain, and the steady flow stress for both G-phase and L-phase. For the plastic flow mechanism, at lower strain rates (0.0002 ps−1 and 0.00002 ps−1), the shear band in G-phase is ∼1 nm narrower than the shear band formed under the strain rate of 0.002 ps−1. In contrast, the formed shear band remains the same for L-phases under various strain rates. Our results imply that significant differences in mechanical properties should be observable for a heterogeneous configurationally ordered solid-like G-glass compared to a homogeneous L-glass having the same overall composition.
Data Availability Statement
The original contributions presented in the study are included in the article/Supplementary material, further inquiries can be directed to the corresponding authors.
Author Contributions
YS, WJ, KS, WG, and QA contributed to conception and design of the study. YS and QA performed the simulation. YS, WJ, KS, SC, WG, and QA performed the statistical analysis. YS wrote the first draft of the manuscript. All authors contribute to the edition of the manuscript.
Funding
WG was supported by gifts to the MSC. WJ and SC are supported by NSF grant with the award number DMR 1710744. KS is supported by the DFG, grant Sa337/10.
Conflict of Interest
The authors declare that the research was conducted in the absence of any commercial or financial relationships that could be construed as a potential conflict of interest.
Publisher’s Note
All claims expressed in this article are solely those of the authors and do not necessarily represent those of their affiliated organizations, or those of the publisher, the editors and the reviewers. Any product that may be evaluated in this article, or claim that may be made by its manufacturer, is not guaranteed or endorsed by the publisher.
References
An, Q., Johnson, W. L., Samwer, K., Corona, S. L., and Goddard, W. A. (2020a). First-Order Phase Transition in Liquid Ag to the Heterogeneous G-phase. J. Phys. Chem. Lett. 11, 632–645. doi:10.1021/acs.jpclett.9b03699
An, Q., Johnson, W. L., Samwer, K., Corona, S. L., and Goddard, W. A. (2020b). Formation of Two Glass Phases in Binary Cu-Ag Liquid. Acta Materialia 195, 274–281. doi:10.1016/j.actamat.2020.05.060
An, Q., Johnson, W. L., Samwer, K., Corona, S. L., and Goddard, W. A. (2021). The First Order L-G Phase Transition in Liquid Ag and Ag-Cu Alloys Is Driven by Deviatoric Strain. Scripta Materialia 194, 113695. doi:10.1016/j.scriptamat.2020.113695
An, Q., Johnson, W. L., Samwer, K., Corona, S. L., Shen, Y., and Goddard, W. A. (2022). The L-G Phase Transition in Binary Cu-Zr Metallic Liquids. Phys. Chem. Chem. Phys. 24, 497–506. doi:10.1039/d1cp04157f
Chen, L. Y., Setyawan, A. D., Kato, H., Inoue, A., Zhang, G. Q., Saida, J., et al. (2009). Free-Volume-Induced Enhancement of Plasticity in a Monolithic Bulk Metallic Glass at Room Temperature. Scr. Mater. 59, 75–78. doi:10.1016/j.scriptamat.2008.02.025
Cheng, Y. Q., Ma, E., and Sheng, H. W. (2009). Atomic Level Structure in Multicomponent Bulk Metallic Glass. Phys. Rev. Lett. 102, 245501. doi:10.1103/PhysRevLett.102.245501
Dai, L. H., and Bai, Y. L. (2008). Basic Mechanical Behaviors and Mechanics of Shear Banding in BMGs. Int. J. Impact Eng. 35, 704–716. doi:10.1016/j.ijimpeng.2007.10.007
Frahsa, F., Bhattacharjee, A. K., Horbach, J., Fuchs, M., and Voigtmann, T. (2013). On the Bauschinger Effect in Supercooled Melts under Shear: Results from Mode Coupling Theory and Molecular Dynamics Simulations. J. Chem. Phys. 138, 12A513. doi:10.1063/1.4770336
Greer, A. L., Cheng, Y. Q., and Ma, E. (2013). Shear Bands in Metallic Glasses. Mater. Sci. Eng. R: Rep. 74, 71–132. doi:10.1016/j.mser.2013.04.001
Gu, X. J., Poon, S. J., and Shiflet, G. J. (2007). Mechanical Properties of Iron-Based Bulk Metallic Glasses. J. Mater. Res. 22, 344–351. doi:10.1557/jmr.2007.0036
Hays, C. C., Kim, C. P., and Johnson, W. L. (2000). Microstructure Controlled Shear Band Pattern Formation and Enhanced Plasticity of Bulk Metallic Glasses Containing in situ Formed Ductile Phase Dendrite Dispersions. Phys. Rev. Lett. 84, 2901–2904. doi:10.1103/PhysRevLett.84.2901
Karmakar, S., Lerner, E., and Procaccia, I. (2010). Plasticity-induced Anisotropy in Amorphous Solids: The Bauschinger Effect. Phys. Rev. E 82, 026104. doi:10.1103/PhysRevE.82.026104
Ke, H. B., Wen, P., Peng, H. L., Wang, W. H., and Greer, A. L. (2011). Homogeneous Deformation of Metallic Glass at Room Temperature Reveals Large Dilatation. Scripta Materialia 64, 966–969. doi:10.1016/j.scriptamat.2011.01.047
Klaumünzer, D., Lazarev, A., Maaß, R., Dalla Torre, F. H., Vinogradov, A., and Löffler, J. F. (2011). Probing Shear-Band Initiation in Metallic Glasses. Phys. Rev. Lett. 107, 185502. doi:10.1103/PhysRevLett.107.185502
Lee, S.-C., Lee, C.-M., Lee, J.-C., Kim, H.-J., Shibutani, Y., Fleury, E., et al. (2008). Structural Disordering Process of an Amorphous alloy Driven by the Elastostatic Compression at Room Temperature. Appl. Phys. Lett. 92, 151906. doi:10.1063/1.2908218
Lee, S. W., Huh, M. Y., Fleury, E., and Lee, J. C. (2006). Crystallization-Induced Plasticity of Cu-Zr Containing Bulk Amorphous Alloys. Acta Mater. 54, 349–355. doi:10.1016/j.actamat.2005.09.007
Lewandowski, J. J., and Greer, A. L. (2006). Temperature Rise at Shear Bands in Metallic Glasses. Nat. Mater 5, 15–18. doi:10.1038/nmat1536
Li, W., Bei, H., Tong, Y., Dmowski, W., and Gao, Y. F. (2013). Structural Heterogeneity Induced Plasticity in Bulk Metallic Glasses: From Well-Relaxed Fragile Glass to Metal-like Behavior. Appl. Phys. Lett. 103, 171910. doi:10.1063/1.4827299
Liu, Y. H., Wang, G., Wang, R. J., Zhao, D. Q., Pan, M. X., and Wang, W. H. (2007). Super Plastic Bulk Metallic Glasses at Room Temperature. Science 315, 1385–1388. doi:10.1126/science.1136726
Maaß, R., Samwer, K., Arnold, W., and Volkert, C. A. (2014). A Single Shear Band in a Metallic Glass: Local Core and Wide Soft Zone. Appl. Phys. Lett. 105, 171902. doi:10.1063/1.4900791
Mickel, W., Kapfer, S. C., Schröder-Turk, G. E., and Mecke, K. (2013). Shortcomings of the Bond Orientational Order Parameters for the Analysis of Disordered Particulate Matter. J. Chem. Phys. 138, 044501. doi:10.1063/1.4774084
Na, J. H., Corona, S. L., Hoff, A., and Johnson, W. L. (2020). Observation of an Apparent First-Order Glass Transition in Ultrafragile Pt-Cu-P Bulk Metallic Glasses. Proc. Natl. Acad. Sci. U.S.A. 117, 2779–2787. doi:10.1073/pnas.1916371117
Patinet, S., Barbot, A., Lerbinger, M., Vandembroucq, D., and Lemaître, A. (2020). Origin of the Bauschinger Effect in Amorphous Solids. Phys. Rev. Lett. 124, 205503. doi:10.1103/PhysRevLett.124.205503
Pedersen, O. B., Brown, L. M., and Stobbs, W. M. (1981). The Bauschinger Effect in Copper. Acta Metallurgica 29, 1843–1850. doi:10.1016/0001-6160(81)90110-3
Pekarskaya, E., Kim, C. P., and Johnson, W. L. (2001). In Situ transmission Electron Microscopy Studies of Shear Bands in a Bulk Metallic Glass Based Composite. J. Mater. Res. 16, 2513–2518. doi:10.1557/JMR.2001.0344
Plimpton, S. (1995). Fast Parallel Algorithms for Short-Range Molecular Dynamics. J. Comput. Phys. 117, 1–19. doi:10.1006/jcph.1995.1039
Schroers, J., and Johnson, W. L. (2004). Ductile Bulk Metallic Glass. Phys. Rev. Lett. 93, 255506. doi:10.1103/PhysRevLett.93.255506
Schuh, C., Hufnagel, T., and Ramamurty, U. (2007). Mechanical Behavior of Amorphous Alloys. Acta Materialia 55, 4067–4109. doi:10.1016/j.actamat.2007.01.052
Shen, J., Lu, Z., Wang, J. Q., Lan, S., Zhang, F., Hirata, A., et al. (2020). Metallic Glacial Glass Formation by a First-Order Liquid-Liquid Transition. J. Phys. Chem. Lett. 11, 6718–6723. doi:10.1021/acs.jpclett.0c01789
Shimizu, F., Ogata, S., and Li, J. (2007). Theory of Shear Banding in Metallic Glasses and Molecular Dynamics Calculations. Mater. Trans. 48, 2923–2927. doi:10.2320/matertrans.MJ200769
Spaepen, F. (2006). Homogeneous Flow of Metallic Glasses: A Free Volume Perspective. Scripta Materialia 54, 363–367. doi:10.1016/j.scriptamat.2005.09.046
Steinhardt, P. J., Nelson, D. R., and Ronchetti, M. (1983). Bond-orientational Order in Liquids and Glasses. Phys. Rev. B 28, 784–805. doi:10.1103/PhysRevB.28.784
Stukowski, A. (2010). Visualization and Analysis of Atomistic Simulation Data with OVITO-The Open Visualization Tool. Model. Simul. Mater. Sci. Eng. 18, 015012. doi:10.1088/0965-0393/18/1/015012
Sun, Y. H., Louzguine-Luzgin, D. V., Ketov, S., and Greer, A. L. (2014). Pure Shear Stress Reversal on a Cu-Based Bulk Metallic Glass Reveals a Bauschinger-type Effect. J. Alloys Compd. 615, S75–S78. doi:10.1016/j.jallcom.2013.11.104
Szuecs, F., Kim, C. P., and Johnson, W. L. (2001). Ductile Phase Reinforced Bulk Metallic Glass Composite. Acta Mater. 49, 1507–1513. doi:10.1016/S1359-6454(01)00068-4
Tang, C., Peng, H., Chen, Y., and Ferry, M. (2016). Formation and Dilatation of Shear Bands in a Cu-Zr Metallic Glass: A Free Volume Perspective. J. Appl. Phys. 120, 235101. doi:10.1063/1.4972189
Tucker, G. J., Zimmerman, J. A., and McDowell, D. L. (2011). Continuum Metrics for Deformation and Microrotation from Atomistic Simulations: Application to Grain Boundaries. Int. J. Eng. Sci. 49, 1424–1434. doi:10.1016/j.ijengsci.2011.03.019
Urata, S., and Li, S. (2018). A Multiscale Shear-Transformation-Zone (STZ) Model and Simulation of Plasticity in Amorphous Solids. Acta Materialia 155, 153–165. doi:10.1016/j.actamat.2018.05.058
Wang, W. H., Yang, Y., Nieh, T. G., and Liu, C. T. (2015). On the Source of Plastic Flow in Metallic Glasses: Concepts and Models. Intermetallics 67, 81–86. doi:10.1016/j.intermet.2015.08.004
Wu, Y., Cao, D., Yao, Y., Zhang, G., Wang, J., Liu, L., et al. (2021). Substantially Enhanced Plasticity of Bulk Metallic Glasses by Densifying Local Atomic Packing. Nat. Commun. 12, 6582. doi:10.1038/s41467-021-26858-9
Yang, B., Morrison, M. L., Liaw, P. K., Buchanan, R. A., Wang, G., Liu, C. T., et al. (2005). Dynamic Evolution of Nanoscale Shear Bands in a Bulk-Metallic Glass. Appl. Phys. Lett. 86, 141904. doi:10.1063/1.1891302
Yang, B., Liu, C. T., Nieh, T. G., Morrison, M. L., Liaw, P. K., and Buchanan, R. A. (2006). Localized Heating and Fracture Criterion for Bulk Metallic Glasses. J. Mater. Res. 21, 915–922. doi:10.1557/jmr.2006.0124
Yang, Y. J., Cheng, B. Y., Lv, J. W., Li, B., Ma, M. Z., Zhang, X. Y., et al. (2019). Effect of Ag Substitution for Ti on Glass-Forming Ability, thermal Stability and Mechanical Properties of Zr-Based Bulk Metallic Glasses. Mater. Sci. Eng. A 746, 229–238. doi:10.1016/j.msea.2018.12.123
Keywords: metallic glass, plastic flow, shear deformation, MD, shear band, bauschinger effect
Citation: Shen Y, Johnson WL, Samwer K, Corona SL, Goddard WA and An Q (2022) Shear Banding in Binary Cu-Zr Metallic Glass: Comparison of the G-Phase With L-Phase. Front. Mater. 9:886788. doi: 10.3389/fmats.2022.886788
Received: 28 February 2022; Accepted: 31 March 2022;
Published: 14 April 2022.
Edited by:
Yue Fan, University of Michigan, United StatesReviewed by:
Bin Wu, Beijing Normal University, ChinaKostya Trachenko, Queen Mary University of London, United Kingdom
Copyright © 2022 Shen, Johnson, Samwer, Corona, Goddard and An. This is an open-access article distributed under the terms of the Creative Commons Attribution License (CC BY). The use, distribution or reproduction in other forums is permitted, provided the original author(s) and the copyright owner(s) are credited and that the original publication in this journal is cited, in accordance with accepted academic practice. No use, distribution or reproduction is permitted which does not comply with these terms.
*Correspondence: William L. Johnson, d2xqQGNhbHRlY2guZWR1; William A. Goddard, d2FnQGNhbHRlY2guZWR1; Qi An, cWlhQHVuci5lZHU=
†ORCID: William A. Goddard, orcid.org/0000-0003-0097-5716