 Daoliang Chen
 Wei Chen2
- 1School of Mechanical Engineering, Southeast University, Nanjing, China
- 2Power Beam Processing Laboratory, AVIC Manufacturing Technology Institute, Beijing, China
- 3R and D Department, China Academy of Launch Vehicle Technology, Beijing, China
Electron beam selective melting is a rapidly developing additive manufacturing technology for industry and engineering. A two-relaxation-time lattice Boltzmann model is proposed to simulate melt flows and free surface dynamics in an EBSM additive manufacturing process. The model also describes the dynamics of solid-liquid phase change and heat transfer, and it is validated by several simulations of classical benchmarks. The model was applied to further simulate single and multiple tracks of electron beam selective melting on a single layer of powder bed and to analyze the influence of process parameters. The results demonstrate significant potentials of the present model for the study of additive manufacturing processes.
1 Introduction
The electron beam selective melting (EBSM) additive manufacturing with higher energy density electron beam as the heat source can improve the quality and efficiency of metal parts additive manufacturing and reduce the molding cost. The metal powders are melted and solidified layer by layer to form the desired metal components by selective heating. EBSM has attached great attention in recent years as it is widely used in aerospace (Blakey-Milner et al., 2021), biomedical (Tamayo et al., 2021) and other crucial fields (Vafadar et al., 2021) to fabricate complex structural products. However, EBSM is a non-equilibrium physical process accompanied by various complex phenomena such as melt convection, heat transfer, solute transport, and phase change. In-depth investigation of melt’s complex behavior during the melt pool evolution process is significant in improving the process manufacturing level and enhancing the product quality. As the rapid evolution of the melt pool during EBSM is difficult to observe, the general experimental approach can only obtain information on its formation through continuous trial and error, making it difficult to reveal its complex formation mechanism. Numerical simulation has become an essential part of scientific research about additive manufacturing, effectively reducing the time as well as the economic cost of traditional experimental means (Hashemi et al., 2021).
At present, the numerical studies on EBSM have attracted great attention. Cheng et al. (2014) developed a three-dimensional (3D) thermal model based on the finite element method (FEM) to predict the temperature distribution of the EBSM process and stated that the powder porosity is critical to the thermal characteristics of the melt, with the size of the melt pool increasing as the powder porosity increases. Riedlbauer et al. (2017) researched the experimental measurementand macroscopic thermal simulation of melt pool in EBSM of Ti-6Al-4V based on FEM, obtained that a good agreement was between experimental and simulation results, and the existence time of the melt pool was proportional to the line energy. In contrast, the dimensions and line energy showed a nonlinear relationship. Jamshidinia et al. (2013) applied numerical simulation to compare the difference between the pure thermal model and the convective heat transfer model and concluded that the convection heat transfer model has a larger weld pool width and a longer length, but the penetration distance is shallower. Further, there are an increasing number of further studies on the evolution of the melt pool at the powder scale. A powder-scale model based on the finite volume method (FVM) was designed to effectively simulate the formation of defects such as the balling effect and analyze the surface morphology formation mechanism in EBSM (Yan et al., 2017). Wu et al. (2021) intensively developed an FVM-based 3D multiple-layer mesoscale model to investigate the side roughness of Ti-6Al-4V parts fabricated by EBSM and revealed the leading cause of track shape fluctuation. Zhao et al. (2020, 2021) investigated the effect of the thermal properties of the powder bed (i.e., emissivity, thermal conductivity) and the environmental conditions on the energy absorption and heat transfer of the EBSM process based on CtFD simulations. The results indicated the necessity to improve the process parameters according to the fineness of the powder to ensure the molded quality.
Combined with the above research status, it is known that the numerical simulation methods to predict and control the flow field of the molten pool have a high guiding significance for the actual EBSM process. However, most of the methods have certain limitations on the calculation of complex interfaces with relatively low computational efficiency. The lattice Boltzmann method (LBM) has been widely used in simulating heat transfer, and fluid flows for its simplicity in the algorithm, ease of implementation, and effectiveness in solving partial differential equations. Körner developed a two-dimensional model for EBSM, firstly employing LBM and successfully modeled surface tension and wetting phenomena (Körner et al., 2013; Ammer et al., 2014). Zheng et al. (2019) proposed a height function-LBM coupling model to study the melt pool dynamics of selective laser melting. Zakirov et al. (2020) implemented a high-performance tool called FaSTLaB for simulation of the powder bed fusion additive manufacturing process, which fits the framework of the single-relaxation-time scheme LBM. However, the single-relaxation-time scheme is less stable in some specific conditions. The LBM with multiple-relaxation-time lattice Boltzmann equations suffers from algorithmic complexity and computational consumption.
The present work aims at developing a three-dimensional (3D) two-relaxation-time (TRT) LBM-based mass and heat transfer model to study the melt pool evolution process during EBSM. The fluid dynamics and heat transfer in the model are validated by simulating thermal convection and phase change processes in a square cavity as well as the simulation of bead-on-plate. The powder bed fusion EBSM process under different process parameters is investigated. The analysis of the melt pool flow pattern provides an understanding of melt pool formation.
2 Mathematical Model
2.1 Modeling of Melt Flows During Phase Change
Melt flows during phase change in EBSM is described by the two-relaxation-time lattice Boltzmann equation (Ginzburg et al., 2008) as
with
where fi (x, t) is the density distribution function at (x, t),
The
where ωi is the weight coefficient, ρ is the density, u represents fluid velocity and cs is the sound speed in relation to the lattice velocity, c = δx/δt and
The
where F is the force exerted on the melts. In EBSM, F includes the thermal buoyancy, the surface tension, the Marangoni force and the recoil pressure. Based on the boussinseuq approximation, the thermal buoyancy Fb is
where g is the gravitational acceleration, βT is the thermal expansion coefficient, T is the temperature and Tm is the melting temperature. The surface tension can be described as
where σ is the surface tension coefficient, κ is the local curvature, n is the unit normal vector due to the forces acting on the surface of the liquid, ϕl is the liquid phase fraction at the gas-liquid interface, ρl and ρg are the densities of liquid and gas phase (Brackbill et al., 1992). The Marangoni effect occurs because of the gradient of surface tension caused by non-uniform temperature distributions, and the Marangoni force can be calculated by
where βM is the temperature coefficient of surface tension. The recoil pressure is an important driving force that acts on the surface of the melt, which is generated by vapor flux and defined as (Zhao et al., 2020)
where P0 is the ambient pressure, Lv is the enthalpy of metal vapor, M represents the molar mass, Tv is the vapor temperature of the metal and R is the universal gas constant.
The D3Q19 model is selected to model the present 3D-EBSM process in the present work. Therefore, the weight coefficient is given as
and the discrete velocity in direction i is
In Eq. 1, the two dimensionless relaxation times
Here, the symmetric dimensionless relaxation time are described as
where ν is the kinetic viscosity. The macroscopic density ρ and velocity u are calculated as
The immersed moving boundary scheme (Noble and Torczynski, 1998) is introduced to account for the effects of partially solidified areas. The evolution of the density distribution function fi includes the solid collision operator
with
where β is weight function. It is described as
where ϕl is the liquid phase fraction at the liquid-solid interface. us is the solid velocity, us = 0 in the subsequent simulations.
2.2 Modeling of the Liquid-Solid Phase Change
The evolution of enthalpy in the phase change system is governed by
where hi is distribution function for enthalpy of the phase change system, τh is the dimensionless relaxation time and
where δij is the Kronecker function. The source term
where η is the energy absorption rate, PB is the electron beam’s power, which is depends on the process parameters, the accelerating voltage, UB and the beam current, IB. Ixy is the Gaussian distribution of energy in planes, where the maximum power intensity is at the centre with the power intensity decreasing as the width increase, as follow
where σb is the standard deviation of beam width, (x0, y0) locates the center of the electron beam, which constantly changes as the heat source moves. Iz is the energy’s vertical distribution, whose commonly used form is given as (Zäh and Lutzmann, 2010)
where zs is the penetration distance, for which a fairly common relationship is as follows (Knapp et al., 2019)
The most electrons beam penetrate into the material and are absorbed, so reflections are not considered in the model.
The main sources of heat loss in the EBSM process are the thermal loss radiated to the atmosphere and the heat removed from the melt pool due to high temperature evaporation. The total heat flux due to radiation can be expressed as
where σb is the Stefan-Boltzmann constant, ɛ is the emissivity and Tref is the ambient temperature. The model ignores the mass loss due to evaporation phenomena and only considers the heat loss which is sufficiently significant. The heat flux due to evaporation can be expressed as
After the powder spreading process, there is a pre-treatment process to avoid powder smoke effect (Leung et al., 2019), where the metal powder is sintered at a high pre-heating temperature. Therefore the powder particles are considered fixed in the EBSM process.
In the D3Q19 model, the relationship between τh and the thermal diffusivity α is described as
The temperature T can be determined by
where Hl and Hs are the total enthalpy corresponding to the solidus temperatures Ts and liquidus temperatures Tl, respectively. The liquid phase fraction ϕl can be updated according to H = cpT + ϕlLm, where Lm represents the latent heat.
2.3 Tracking Evolution of Liquid/Gas Interface
The evolution of the liquid/gas (L/G) interface is described by using a mass-exchange method with the mediation of fi and ϕl across L/G interface. The movement of the L/G interface is implemented by relabelling of cell types including gas cells, L/G interface cells and liquid cells based on the mass exchange. The liquid mass in a cell is related to the liquid phase fraction and the local density, defined as
The cell’s mass is updated according to
with the direction-dependent exchange mass
The L/G interface cell converts to the liquid cell when m (x, t) ≥ ρ(x, t) and the gas cell when m (x, t) ≤ 0. The accuracy of the simplified advection scheme based on the mass exchange principle has been validated in the literature (Bogner et al., 2016). This model does not take into account the gas dynamics, so the distribution functions streamed from the gas phase is unknown. The particle distribution functions are reconstructed as (Körner et al., 2005)
where ρ0 is the reference density in the simulation and u0 represents the fluid velocity at the L/G interface. And the curvature estimation in the interface is performed using the height function method, which can guarantee second-order accuracy in curvature calculations (Ferdowsi and Bussmann, 2008; Afkhami and Bussmann, 2009).
3 Results and Discussion
3.1 Validation
3.1.1 Convective Phase Change Problem
Numerical simulations are carried out to test the present model. Firstly, a square-cavity convective phase change problem is selected to make the validation. In this simulation, a two-dimensional cavity of length L is filled with homogeneous solid substance at the melting temperature T0. The left wall is set at a constant temperature, Th, above the melting temperature, and the right wall is set at T0. Other walls are adiabatic. Two cases with different Rayleigh numbers Ra of 2.5 × 10⁴ and 2.5 × 10⁵ are simulated. The Stefan number defined as St = cp (Th − T0)/L is set to be 0.01 and the Prandtl number defined as Pr = ν/α, equals to 0.02 in the simulation. The average Nusselt number along the left wall, defined as
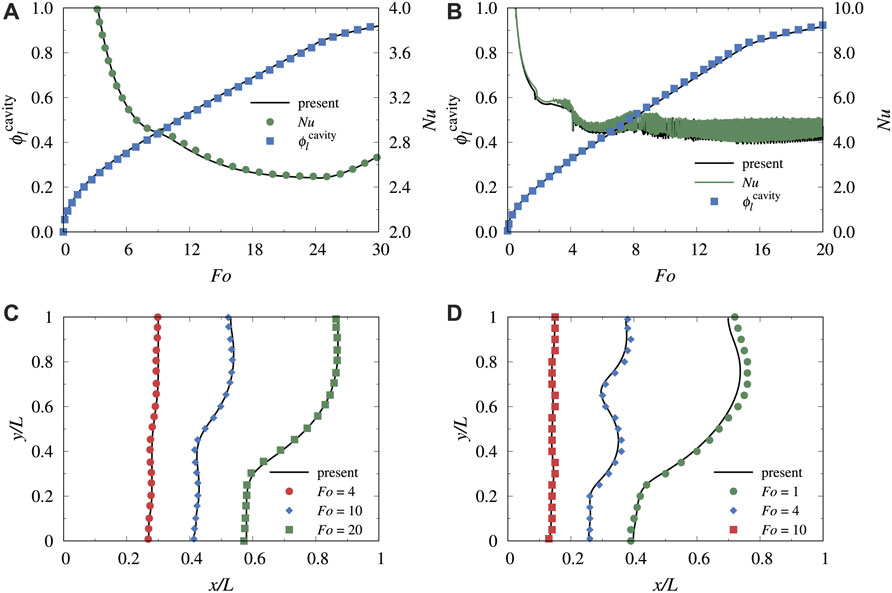
FIGURE 1. The comparison of results for the average Nusselt number along the left wall Nu and the liquid phase fraction of the cavity
3.1.2 Surface Tension and Wetting Effect
Surface tension and wetting have a significant effect on the melt pool formation. The shape of the droplets on the plate is simulated to compare with their theoretical shape to validate the surface tension and wetting effects in the model.
In Figure 2, a semicircular droplet is placed on a flat wall with the initial contact angle of 90° and radius of R, which would be the equilibrium solution for neutral wetting conditions. For different wettability, assuming that the radius of the droplet at equilibrium is r, the volume of the droplet at equilibrium is
With constant density, the relationship between the maximum height hm and the initial radius R is obtained from the conservation of mass as
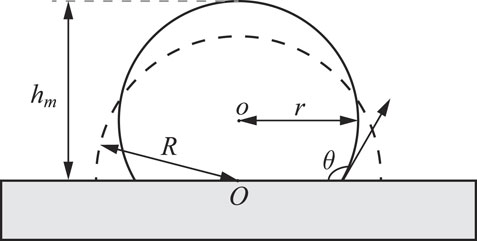
FIGURE 2. Contact angle between the droplet and the plate.
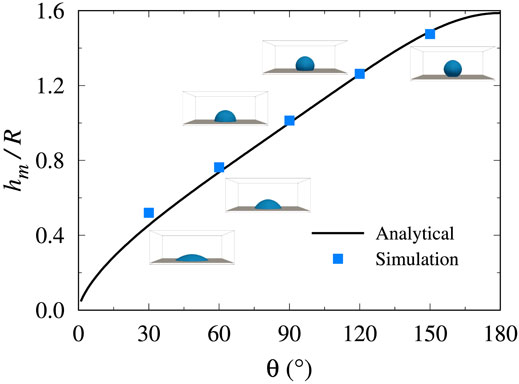
FIGURE 3. Equilibrium profile and the ratio of hm and R for five different contact angles.
3.1.3 Simulation of the Bead-on-Plate
The absorption of electron beam energy and melt-pool formation are the key factors for EBSM. The simulation of the bead-on-plate for the Ti-6Al-4V alloy was carried out to observe the evolution of the liquid phase. In this simulation, the accelerating voltage of 60 kV, the current of 5 mA, the beam spot size of 500 μ m, and the initial preheat temperature of 296 K are set. The scanning speed is 1,000 mm/s and 3,000 mm/s for cases A and B, as shown in Figure 4. The physical parameters used in the simulations (Lin et al., 2020; Wu et al., 2021) are given in Table 1. For the Ti-6Al-4V alloy, zs is approximately 18.9 μm at UB = 60 kV. Comparison of the melt-pool shapes in Figure 4 demonstrates favorable agreement between the simulations and the experiments (Zakirov et al., 2020) in both the width and depth. It shows that the present model can well characterize the melt pool’s interface evolution during EBSM.
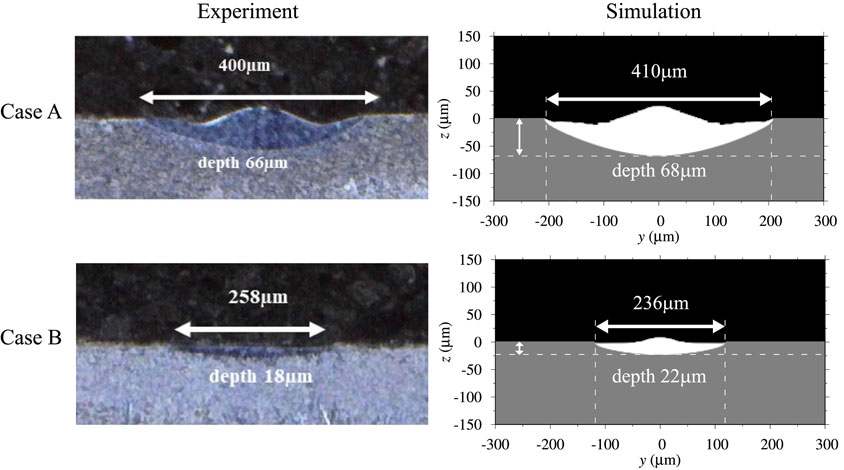
FIGURE 4. The track cross-sections of the bead-on-plate for case A and case B.
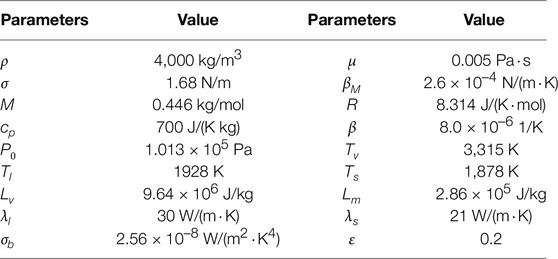
TABLE 1. Thermophysical properties of Ti-6Al-4V used in the simulation.
3.2 Single Track on Powder-Bed
The powder bed with alloy powders of Ti-6Al-4V ranging from 45 to 105 μm is introduced in the simulation of the powder bed fusion EBSM. The layer thickness is about 100 μm. In this simulation, the initial preheat temperature is set to be 973 K. The beam spot size is 400 μm, the scanning speed is set to 0.5 m/s, and the accelerating voltage maintains at 60 kV.
Figure 5 demonstrates the evolution process of the melt pool and its accompanying temperature field during single track melting with the electron beam current of 4 mA. The alloy powders are heated locally by the electron beam heat source, and their temperature continuously increases. When above their solidus line temperature, the powder particles melt to form a nearly circular melt pool, as shown in Figure 5A; Figure 5B. At this stage, the melt in the pool is mainly subject to thermal buoyancy, gravity, and surface tension. According to Eq. 6, the magnitude of the surface tension depends on the surface tension coefficient and the local curvature. Considering that the size of the melt pool was tiny, for alloy powders of Ti-6Al-4V with diameters in the range 45–105 μm, the complete melting was subject to the surface tension of approximately 8 × 10¹⁰ N/m3, which is much greater than the other forces acting. Therefore, the surface tension is the primary motivation for the continuous convergence of the molten powder to form the melt pool. Figure 5C displays the changing morphology of the melt pool as the electron beam heat source traveled, elongating in the direction of the electron beam heat source. At the same time, the temperature distribution on the surface of the melt pool displays a more significant temperature gradient at the leading edge of the melt pool than at the tail end of the melt pool. During the rapid movement of the heat source, the tail end of the melt pool is out of the area heated by the electron beam. As the heat continuously transfers, the melt gradually cools and eventually solidifies. The continuous action of the electron beam heat source causes the temperature in the spot to rise by degrees, reaching the boiling point of the material at the current pressure, which leads to evaporation. The evaporation took away a large amount of heat and kept the maximum temperature in the melt pool at a relatively constant level. In addition, it provokes a recoil pressure at the interface, resulting in a distinct depression on the melt pool surface, as illustrated in Figure 5D. At the same time, it is evident that the melt flows from the center to the periphery owing to the Marangoni effect within the melt pool, which is due to the presence of tangential forces on the surface caused by temperature-dependent surface tension. Accordingly, this accelerates the convective cooling process and helps reduce the pool’s temperature, which to some extent suggests that models without flow might overestimate the temperature values inside the pool.
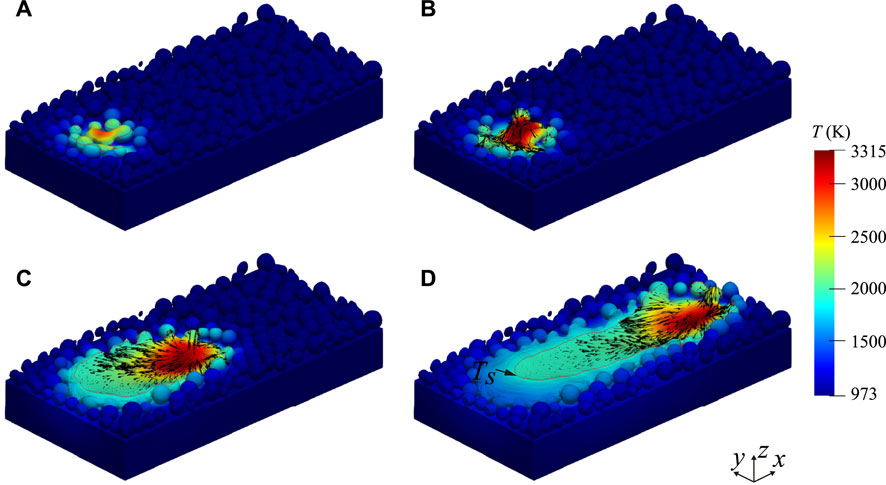
FIGURE 5. The morphological characteristics and temperature distribution of the melt pool during electron beam scanning (A): 0.1 ms, (B): 0.2 ms, (C): 1.2 ms, (D): 2.4 ms.
Figure 6 shows the morphological characteristics and temperature distribution of the melt pool with an increase of the electron beam current from 1.0 to 4.0 mA at t = 2.4 ms. When the current is 1.0 mA, the melting track is discontinuous and appears to spherize, as illustrated in Figure 6A. When the heat input is relatively low, the melted powder tends to cluster under surface tension as the powder layer melts, and the substrate does not melt. As the power is increased to 90 W, the substrate gradually melts, and the melted powder spreads over the melted substrate to minimize the surface energy in Figure 6B. At this stage, the temperature in the melt pool is below the boiling point, and there is no significant depression, indicating that the pool is barely subject to recoil pressure. Due to inadequate substrate melting, the powders preferentially merge with each other after melting rather than entering the melt pool immediately. Due to the high solidification rate, the melt pool is not replenished by the melt in time for solidification to occur. The molten powder then fuses with the melt pool, and there is significantly more melt in the melt pool than before. This results in significant fluctuations in the surface of the solidified track. Some partially melted powder adheres to the melting track in Figure 6C. These particles are partially heated to full melting as they are away from the electron beam heat source. This phenomenon contributes to the roughness of the melt track and is usually unavoidable. In practice, it may also increase the porosity, as discussed later. Figure 6D shows the melt flows towards the tail of the melt pool, creating a backward flow. In addition, a recirculation flow from the rear of the melt pool is generated. At this time, the electron beam power reaches 240W, the substrate is fully heated and melted, and the melted powder at the front of the melt pool can be replenished in time to provide sufficient melt for the reverse flow. This ensures that a flat surface is formed at the rear of the melt pool when it solidifies.
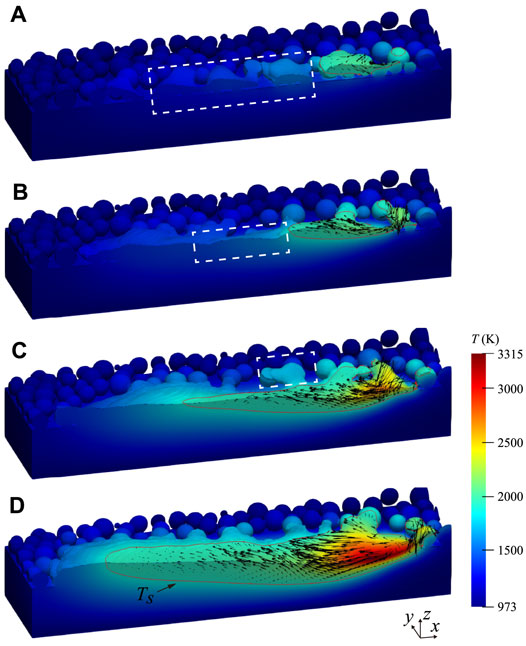
FIGURE 6. The morphological characteristics and temperature distribution of the melt pool with an increase of the electron beam current in the longitude cross section view (A): IB = 1.0 mA, (B): IB = 1.5 mA, (C): IB = 2.5 mA, (D): IB = 4.0 mA). The dash squares mark the morphological features (A): the balling effect, (B): the fluctuation of the solidified track, (C): the partially melted particles).
Figure 7A depicts the temperature along the surface of the melting track versus the distance from the electron beam at t = 2.4 ms. The position scale 0 indicates the position of the electron beam at the moment. As the electron beam power increases, the maximum temperature in the melt pool rises continuously. Furthermore, the position of the maximum temperature is not at the center of the electron beam but slightly off it. The electron beam has an apparent effect within a specific range. When the energy supplied by the electron beam to the metal powder or melt is higher than the heat lost by its heat transfer, the temperature keeps rising. The plateaus are noted corresponding to the latent heat for the phase change. At the position away from the electron beam, the melt solidifies and releases some heat, resulting in a slower temperature reduction. The temperature gradient around the pool is significantly lower than inside the pool but still reaches 1 × 10⁵ K/m. The higher the electron beam power, the longer the plateau zone is in the figure, which indicates that the higher the electron beam energy density, the lower the solidification rate. Figure 7B shows the geometric characteristics of the single track, including the average width and height of the tracks in relation to the electron beam current. The average value is based on measurements from three cross-sections. Obviously, as the electron beam power increases, the width and height increase. At a power of 60 W, the average height is 49.73 m, which is nearly half the thickness of the powder layer. In this case, the substrate is not sufficiently melted, although the melt track is continuous. Simulation results indicate that the morphology of the melt pool is considerably dependent on the energy input parameters, and improper selection of process parameters may significantly reduce the part performance.
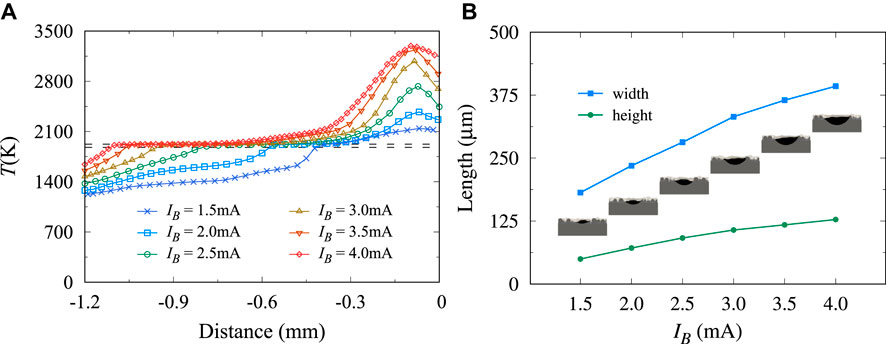
FIGURE 7. (A) Temperature profile along the surface of the melt pool in the x-direction (B) The width and height of the solidified track.
3.3 Multiple Tracks on Powder-Bed
The multiple tracks EBSM process is simulated to study the interaction between sequential tracks. In the simulation, the electron beam scanning speed is increased to 1 m/s, and the current is set to 4.5 mA. Other parameters are the same as before. The scanning strategy is an S-shaped path with no delays on the turns, as shown in Figure 8A. The hatching space lh represents the distance between the first and second track. The hatching space is chosen as 0.28, 0.32, and 0.36 mm, respectively, where 0.36 mm is slightly more significant than the average width of the melt track.
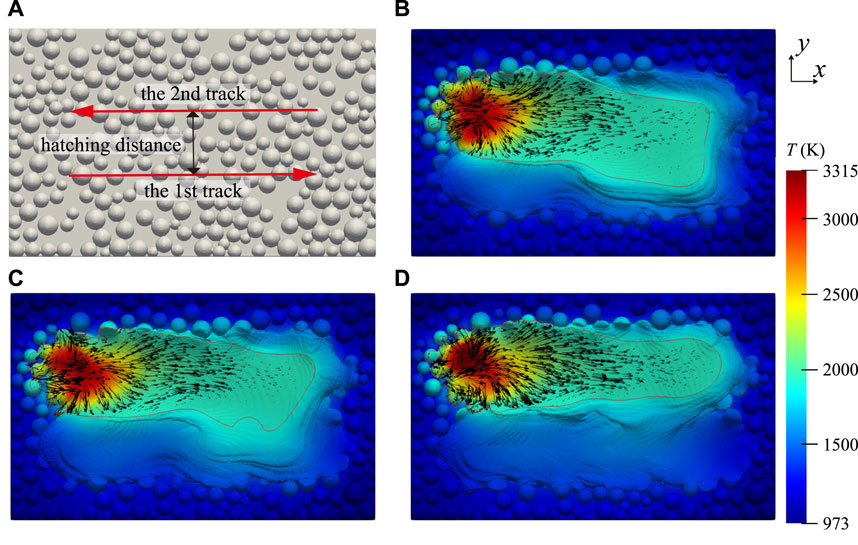
FIGURE 8. (A) The scanning strategy (B−D) The temperature distribution of the melt pool with different hatching distance in the top view (B): 0.28 mm, (C): 0.32 mm, (D): 0.36 mm.
Figures 8B–D show the morphological characteristics and temperature distribution of the melt pool for the multiple tracks. In Figure 8B; Figure 8C, the first solidified track appears to re-melt to some extent as the electron beam scans along the second track. The shorter the hatching distance, the larger the re-melted area. Before the first molten track has fully solidified, the powder on the second track melts and enters the previous molten pool, causing the rear of the melt pool to deviate from the scanning direction of the second electron beam. When the hatching space is 0.36 mm, some uneven protrusions are evident between the first and second track as illustrated in Figure 8D. In this case, the morphology of the melt pool differs from the previous two cases. Figure 9 gives The bottom morphology of the melt tracks in these three cases. In Figure 9C, there are some apparent gaps between the first and second tracks, and the two tracks are almost independent of each other. This indicates that the hatching distance is selected according to the width of the single melt track. A reasonable distance ensures a good fusion joint between multiple tracks and reduces product defects.
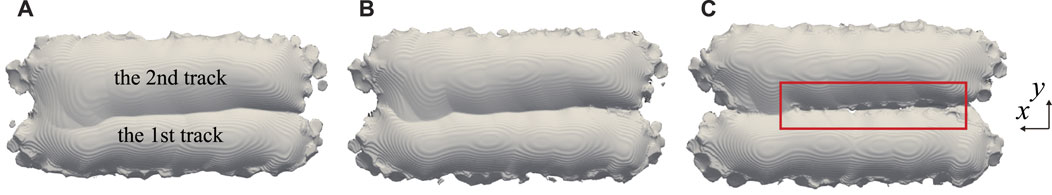
FIGURE 9. The bottom morphology of the melt tracks with different hatching distance (A): 0.28 mm, (B): 0.32 mm, (C): 0.36 mm.
4 Conclusion
A three-dimensional two-relaxation-times lattice Boltzmann model is developed to simulate the EBSM additive manufacturing process, including the dynamics of melt flows, heat transfer, phase changes, and effects of internal and external forces. The model is validated by simulations of convective phase change in a square-cavity and then applied to a bead-on-plate EBSM process. The results show that the present model can be used to accurately characterize the solid-liquid phase change and describe the formation of the melting pool in an EBSM additive manufacturing process.
For single track powder bed fusion, surface tension drives the convergence of the molten powder into a continuous melt. The Marangoni effect and recoil pressure induce backward flow within the melt pool, moving the melt away from the high-temperature region and thus creating a recirculation flow within the melt pool. At a constant electron beam voltage of 60 kV, the height and width of the melt track and the maximum temperature within the melt pool decrease continuously as the electron beam current decreases from 4 to 1.5 mA. When the energy input is relatively high, the powder and the substrate are sufficiently melted to form a continuous flat cladding layer. At a current of 15 mA, the melt pool is virtually immune to recoil pressure as the temperature is well below the boiling point, and the melt track surface is fluctuating due to inadequate substrate melting. When the current is further reduced to 10 mA, balling occurs in the track, resulting in the appearance of a significant area of voids. Excessive hatching distance for multiple tracks leads to many porosities, and partial remelting of the fusion track can reduce the porosity. Boosting energy input and reducing distance can effectively lower porosity to improve product quality.
Data Availability Statement
The original contributions presented in the study are included in the article/Supplementary Material, further inquiries can be directed to the corresponding author.
Author Contributions
DC: methodology, validation, writing–original draft, data curation and software. WC: conceptualization. YL: supervision. DS: conceptualization, methodology and manuscript revision.
Conflict of Interest
The authors declare that the research was conducted in the absence of any commercial or financial relationships that could be construed as a potential conflict of interest.
Publisher’s Note
All claims expressed in this article are solely those of the authors and do not necessarily represent those of their affiliated organizations, or those of the publisher, the editors and the reviewers. Any product that may be evaluated in this article, or claim that may be made by its manufacturer, is not guaranteed or endorsed by the publisher.
References
Afkhami, S., and Bussmann, M. (2009). Height Functions for Applying Contact Angles to 3d Vof Simulations. Int. J. Numer. Meth. Fluids 61, 827–847. doi:10.1002/fld.1974
Ammer, R., Markl, M., Ljungblad, U., Körner, C., and Rüde, U. (2014). Simulating Fast Electron Beam Melting with a Parallel thermal Free Surface Lattice Boltzmann Method. Comput. Mathematics Appl. 67, 318–330. doi:10.1016/j.camwa.2013.10.001
Blakey-Milner, B., Gradl, P., Snedden, G., Brooks, M., Pitot, J., Lopez, E., et al. (2021). Metal Additive Manufacturing in Aerospace: A Review. Mater. Des. 209, 110008. doi:10.1016/j.matdes.2021.110008
Bogner, S., Rüde, U., and Harting, J. (2016). Curvature Estimation from a Volume-Of-Fluid Indicator Function for the Simulation of Surface Tension and Wetting with a Free-Surface Lattice Boltzmann Method. Phys. Rev. E 93, 043302. doi:10.1103/PhysRevE.93.043302
Brackbill, J. U., Kothe, D. B., and Zemach, C. (1992). A Continuum Method for Modeling Surface Tension. J. Comput. Phys. 100, 335–354. doi:10.1016/0021-9991(92)90240-y
Cheng, B., Price, S., Lydon, J., Cooper, K., and Chou, K. (2014). On Process Temperature in Powder-Bed Electron Beam Additive Manufacturing: Model Development and Validation. J. Manufacturing Sci. Eng. 136. doi:10.1115/1.4028484
Ferdowsi, P. A., and Bussmann, M. (2008). Second-order Accurate Normals from Height Functions. J. Comput. Phys. (Print) 227, 9293–9302. doi:10.1016/j.jcp.2008.07.014
Ginzburg, I., Verhaeghe, F., and d’Humieres, D. (2008). Two-relaxation-time Lattice Boltzmann Scheme: About Parametrization, Velocity, Pressure and Mixed Boundary Conditions. Commun. Comput. Phys. 3, 427–478.
Guo, Z., Zheng, C., and Shi, B. (2002). Discrete Lattice Effects on the Forcing Term in the Lattice Boltzmann Method. Phys. Rev. E 65, 046308. doi:10.1103/PhysRevE.65.046308
Hashemi, S. M., Parvizi, S., Baghbanijavid, H., Tan, A. T., Nematollahi, M., Ramazani, A., et al. (2021). Computational Modelling of Process–Structure–Property–Performance Relationships in Metal Additive Manufacturing: a Review. Int. Mater. Rev. 67, 1–46. doi:10.1080/09506608.2020.1868889
Jamshidinia, M., Kong, F., and Kovacevic, R. (2013). Numerical Modeling of Heat Distribution in the Electron Beam Melting® of Ti-6al-4v. J. Manufacturing Sci. Eng. 135. doi:10.1115/1.4025746
Knapp, G. L., Raghavan, N., Plotkowski, A., and Debroy, T. (2019). Experiments and Simulations on Solidification Microstructure for Inconel 718 in Powder Bed Fusion Electron Beam Additive Manufacturing. Additive Manufacturing 25, 511–521. doi:10.1016/j.addma.2018.12.001
Körner, C., Bauereiß, A., and Attar, E. (2013). Fundamental Consolidation Mechanisms during Selective Beam Melting of Powders. Model. Simulation Mater. Sci. Eng. 21, 085011. doi:10.1088/0965-0393/21/8/085011
Körner, C., Thies, M., Hofmann, T., Thürey, N., and Rüde, U. (2005). Lattice Boltzmann Model for Free Surface Flow for Modeling Foaming. J. Stat. Phys. 121, 179–196. doi:10.1007/s10955-005-8879-8
Leung, C. L. A., Tosi, R., Muzangaza, E., Nonni, S., Withers, P. J., and Lee, P. D. (2019). Effect of Preheating on the thermal, Microstructural and Mechanical Properties of Selective Electron Beam Melted Ti-6al-4v Components. Mater. Des. 174, 107792. doi:10.1016/j.matdes.2019.107792
Lin, S., Gan, Z., Yan, J., and Wagner, G. J. (2020). A Conservative Level Set Method on Unstructured Meshes for Modeling Multiphase Thermo-Fluid Flow in Additive Manufacturing Processes. Computer Methods Appl. Mech. Eng. 372, 113348. doi:10.1016/j.cma.2020.113348
Mao, S., Wang, X., Sun, D., and Wang, J. (2022). Numerical Modeling of Dendrite Growth in a Steady Magnetic Field Using the Two Relaxation Times Lattice Boltzmann-phase Field Model. Comput. Mater. Sci. 204, 111149. doi:10.1016/j.commatsci.2021.111149
Mencinger, J. (2004). Numerical Simulation of Melting in Two-Dimensional Cavity Using Adaptive Grid. J. Comput. Phys. 198, 243–264. doi:10.1016/j.jcp.2004.01.006
Noble, D., and Torczynski, J. (1998). A Lattice-Boltzmann Method for Partially Saturated Computational Cells. Int. J. Mod. Phys. C 9, 1189–1201. doi:10.1142/s0129183198001084
Riedlbauer, D., Scharowsky, T., Singer, R. F., Steinmann, P., Körner, C., and Mergheim, J. (2017). Macroscopic Simulation and Experimental Measurement of Melt Pool Characteristics in Selective Electron Beam Melting of Ti-6al-4v. Int. J. Adv. Manufacturing Technology 88, 1309–1317. doi:10.1007/s00170-016-8819-6
Tamayo, J. A., Riascos, M., Vargas, C. A., and Baena, L. M. (2021). Additive Manufacturing of Ti6al4v alloy via Electron Beam Melting for the Development of Implants for the Biomedical Industry. Heliyon 7, e06892. doi:10.1016/j.heliyon.2021.e06892
Vafadar, A., Guzzomi, F., Rassau, A., and Hayward, K. (2021). Advances in Metal Additive Manufacturing: a Review of Common Processes, Industrial Applications, and Current Challenges. Appl. Sci. 11, 1213. doi:10.3390/app11031213
Wu, C., Zafar, M. Q., Zhao, H., Wang, Y., Schöler, C., Heinigk, C., et al. (2021). Multi-physics Modeling of Side Roughness Generation Mechanisms in Powder Bed Fusion. Additive Manufacturing 47, 102274. doi:10.1016/j.addma.2021.102274
Yan, W., Ge, W., Qian, Y., Lin, S., Zhou, B., Liu, W. K., et al. (2017). Multi-physics Modeling of Single/multiple-Track Defect Mechanisms in Electron Beam Selective Melting. Acta Materialia 134, 324–333. doi:10.1016/j.actamat.2017.05.061
Zäh, M. F., and Lutzmann, S. (2010). Modelling and Simulation of Electron Beam Melting. Prod. Eng. 4, 15–23. doi:10.1007/s11740-009-0197-6
Zakirov, A., Belousov, S., Bogdanova, M., Korneev, B., Stepanov, A., Perepelkina, A., et al. (2020). Predictive Modeling of Laser and Electron Beam Powder Bed Fusion Additive Manufacturing of Metals at the Mesoscale. Additive Manufacturing 35, 101236. doi:10.1016/j.addma.2020.101236
Zhao, Y., Aoyagi, K., Yamanaka, K., and Chiba, A. (2020). Role of Operating and Environmental Conditions in Determining Molten Pool Dynamics during Electron Beam Melting and Selective Laser Melting. Additive Manufacturing 36, 101559. doi:10.1016/j.addma.2020.101559
Zhao, Y., Koizumi, Y., Aoyagi, K., Yamanaka, K., and Chiba, A. (2021). Thermal Properties of Powder Beds in Energy Absorption and Heat Transfer during Additive Manufacturing with Electron Beam. Powder Technology 381, 44–54. doi:10.1016/j.powtec.2020.11.082
Keywords: lattice Boltzmann method, phase change, heat transfer, melt flows, electron beam selective melting
Citation: Chen D, Chen W, Liu Y and Sun D (2022) A Two-Relaxation-Time Lattice Boltzmann Model for Electron Beam Selective Melting Additive Manufacturing. Front. Mater. 9:885481. doi: 10.3389/fmats.2022.885481
Received: 28 February 2022; Accepted: 08 March 2022;
Published: 29 April 2022.
Edited by:
Yu-Hong Zhao, North University of China, ChinaReviewed by:
Lijun Zhang, Central South University, ChinaHoubing Huang, Beijing Institute of Technology, China
Copyright © 2022 Chen, Chen, Liu and Sun. This is an open-access article distributed under the terms of the Creative Commons Attribution License (CC BY). The use, distribution or reproduction in other forums is permitted, provided the original author(s) and the copyright owner(s) are credited and that the original publication in this journal is cited, in accordance with accepted academic practice. No use, distribution or reproduction is permitted which does not comply with these terms.
*Correspondence: Dongke Sun, ZGtzdW5Ac2V1LmVkdS5jbg==