 Yu Shi
 Cuiping Guo
 Changrong Li1
 Die Hu
95% of researchers rate our articles as excellent or good
Learn more about the work of our research integrity team to safeguard the quality of each article we publish.
Find out more
ORIGINAL RESEARCH article
Front. Mater. , 18 May 2022
Sec. Structural Materials
Volume 9 - 2022 | https://doi.org/10.3389/fmats.2022.880143
This article is part of the Research Topic Novel γ/γ′ Co-based Superalloys: Processing, Microstructure, and Properties View all 5 articles
The microstructures of 25 annealed alloys and XRD patterns of partial critical alloys in the Co–Ti–W system were investigated by using scanning electron microscopy (SEM) with energy dispersive spectrometer (EDS) and X-ray diffraction (XRD) methods. The isothermal sections at 1273 and 1473 K of the Co–Ti–W system were established. Five three-phase regions and five two-phase regions at 1273 K and eight three-phase regions and two two-phase regions at 1473 K were experimentally determined. The maximum solubilities of W in Co3Ti, αCo2Ti, βCo2Ti and CoTi were determined to be ∼7.9 at%, ∼1.5 at.%, ∼5.9 at.% and ∼1.8 at.% at 1273 K, respectively. The maximum solubilities of Ti in Co7W6 and Co3W were determined to be ∼11.9 at.% and ∼15.2 at.% at 1273 K, respectively. The compound Co3Ti with L12 crystal structure was found to be stable at 1473 K in the Co–Ti–W system owing to the addition of W element, which confirmed that W can improve the stability of γ′ with L12 crystal structure in the Co-based superalloys. The composition range of W in Co3Ti was measured to be ∼7.4–10.4 at.% at 1473 K. In addition, the maximum solubilities of Ti in Co7W6 and W in βCo2Ti and CoTi were ∼15.4 at.%, ∼7.6 at.% and ∼3.1 at.% at 1473 K, respectively. No ternary compounds were found in the Co–Ti–W system at 1273 and 1473 K.
Superalloys are widely adopted in many fields that require materials to serve at elevated temperature such as aircraft engines, gas turbines, chemical plants (Betteridge and Shaw, 1987; Pollock and Tin, 2006; Reed, 2008; Cheng et al., 2012; Qu et al., 2018). Co-based superalloys show better resistance of hot corrosion and oxidation than Ni-based superalloys. They are considered as one of promising candidates for applying at high temperature (Sims et al., 1987). However, compared with Ni-based superalloys, traditional Co-based superalloys are less used due to the inferior high-temperature strength. In Ni-based superalloys, the γ′-Ni3Al strengthening phase with L12 structure precipitates from the disordered γ matrix phase with fcc crystal structure. And the coherent interfaces are formed between γ′-Ni3Al and γ. This is one of main reasons for the outstanding high-temperature properties of Ni-based superalloys. Traditional Co-based superalloys are strengthened by carbide precipitations and solid solutions of refractory elements. The inefficient strengthening methods make traditional Co-based superalloys only be applied in mechanically low-loaded corrosive environments (Sims et al., 1987).
As early as 1971, Lee (Lee, 1971) discovered precipitation-hardened phenomenon in a 71 wt% Co–4 wt% Al–25 wt% W alloy, in which the ordered γ′ phase (L12) precipitated in γ matrix phase (fcc_A1). But almost nobody paid attention to his research results at that time. Until recently, Sato et al. (Sato et al., 2006) observed a γ+γ′ two-phase coherent microstructure in an alloy with the composition of 83.5 at.% Co–9 at% Al–7.5 at.% W, which was similar to that in Ni-based superalloys. The γ′-Co3(Al, W) phase precipitated from γ matrix and formed the coherent interfaces with γ phase, which made Co-based superalloys possess the increased high-temperature strength. Due to higher melting point of Co than Ni, Co-based superalloys might possess better temperature capabilities. Subsequent studies (Kobayashi et al., 2009; Tsukamoto et al., 2010; Xue et al., 2011; Lass et al., 2014) showed the stability of the γ′ phase was still uncertain. According to the experimental results of Lass et al. (Lass et al., 2014), the γ′ phase existed for thousands of hours at 1173 K in the Co–Al–W alloys but its volume fraction decreased continuously and slowly with annealing time.
The high temperature performances of superalloys can be improved by adding alloying elements (Yokokawa et al., 2003; Shinagawa et al., 2009; Bauer et al., 2010). Ti (Xue et al., 2013; Christofidou et al., 2016; Bocchini et al., 2017; Llewelyn et al., 2017), W (Gupta et al., 2008a; Gupta et al., 2008b; Liu et al., 2010; Balam and Paul, 2011), Cr (Gupta et al., 2008b; Liu et al., 2010), Nb (Balam and Paul, 2011; Xue et al., 2013), Mo (Liu et al., 2010; Balam and Paul, 2011), and Ta (Balam and Paul, 2011; Xue et al., 2013) are important alloying elements in superalloys. The addition of Ti can improve the high-temperature stability of γ′ phase by increasing of its solvus temperature (Xue et al., 2013; Christofidou et al., 2016; Bocchini et al., 2017; Llewelyn et al., 2017) and promote the strength at high temperature of the Co-based superalloys. Furthermore, only Ti can form stable A3B type compound (Co3Ti) with ordered L12 crystal structure with Co among the above elements. And a two-phase region fcc + L12 is formed in the Co–Ti phase diagram. W is one of the most efficient alloying elements for improving high-temperature strength by solid-solution strengthening and increasing the stability of γ′ phase (Gupta et al., 2008a; Gupta et al., 2008b; Liu et al., 2010; Balam and Paul, 2011). Therefore, the Co–Ti–W system is worth being studied in detail.
The ternary phase diagram is an important basis for the design and application of materials (Li et al., 2009; Zhang et al., 2011; Xu et al., 2016). So far, the phase diagram of the Co–Ti–W ternary system has hardly been studied. In the current work, the phase relationships at 1273 and 1473 K of the Co–Ti–W system were experimentally determined. The purpose is to construct the Co–Ti–W isothermal sections and explore composition range and stability of γ′ phase at high temperature.
Murray (Murray, 1982) and Cacciamani et al. (Cacciamani et al., 2000) reviewed the experimental data of the Co–Ti system that were published before 1998 in detail. Davydov et al. (Davydov et al., 2001) determined the congruent melting point of the CoTi phase using differential thermal analysis (DTA) and a visual observation of melting (VOM) and optimized the phase diagram of the Co–Ti system. Recently, Wu et al. (Wu et al., 2020) experimentally confirmed that the invariant reaction among liquid, Co3Ti and αCo2Ti was a eutectic reaction at 1427 K. The phase diagram of the Co–Ti system in Ref (Wu et al., 2020). was adopted in this work and shown in Figure 1A. In the Co–Ti phase diagram, five solution phases liquid, fcc (Co), hcp (Co), bcc (Ti) and hcp (Ti), and five intermetallic compounds Co3Ti, αCo2Ti, βCo2Ti, CoTi and CoTi2 are stable.
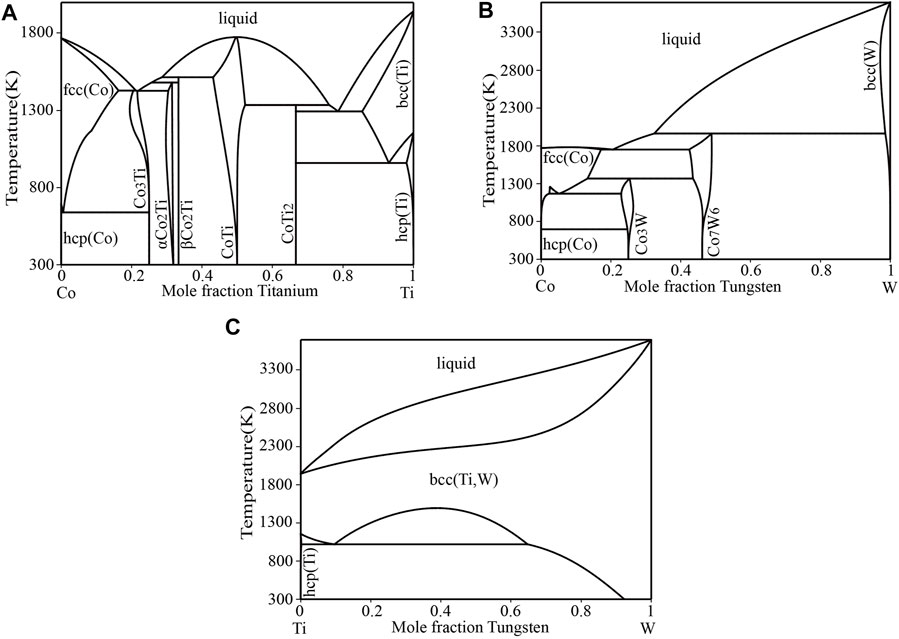
FIGURE 1. The phase diagrams of binary systems (A) Co–Ti (Wu et al., 2020) (B) Co–W (Wang et al., 2019) and (C) Ti–W (Jonsson, 1996).
In the Co–W phase diagram calculated by Kaufman et al. (Kaufman and Nesor, 1978), fcc (Co), hcp (Co), Co3W, Co7W6 and bcc(W) phases were stable. Subsequently, Gabriel et al. (Gabriel et al., 1985) experimentally determined solid-liquid phase equilibria on the Co-rich side of the Co–W system. The temperatures of the liquidus and invariant reactions were determined using DTA with a heating rate of 5 K/min. Sato et al. (Sato et al., 2005) investigated phase equilibria among solid phases using equilibrated alloys and the diffusion couple technique. And the magnetic and martensitic transition temperatures were systematically studied by differential scanning calorimetry (DSC), vibrating sample magnetometer (VSM) and dilatometric measurement. Dmitrieva et al. (Dmitrieva et al., 2005) determined the homogeneity ranges of Co3W and Co7W6 at 1473 K using equilibrated alloys. Ravi et al. (Ravi and Paul, 2011) precisely measured the solubility of W in fcc (Co) by the diffusion couple technique. Recently, Wang et al. (Wang et al., 2019) evaluated the Co–W phase diagram based to the above experimental data. The Co–W phase diagram in Ref (Wang et al., 2019). was adopted in the current work and shown in Figure 1B. The Co–W phase diagram contains two intermediate phases, Co7W6 and Co3W, which are formed by peritectic reaction liquid + bcc(W)→Co7W6 and peritectoid reaction fcc (Co)+Co7W6→Co3W, respectively.
The Ti–W phase diagram is relatively simple, and liquid phase and two solution phases bcc (Ti, W) and hcp (Ti) are included. Murry (Murray, 1981) reviewed previous experimental information and evaluated the Ti–W phase diagram. Jin et al. (Jin and Qiu, 1993) optimized the Ti–W system on the basis of the modified Gibbs energy descriptions of pure Ti and W from the Scientific Group Thermodata Europe (SGTE) database. And all relevant experimental data were taken into account simultaneously. Jonsson (Jonsson, 1996) re-optimized the Ti–W system using simpler models and all the experimental data were well reproduced. The Ti–W phase diagram optimized by Jonsson (Jonsson, 1996) was adopted in present work and shown in Figure 1C. In the Ti–W phase diagram, there is a miscibility gap of bcc (Ti, W) below 1523 K, which makes the high temperature bcc (Ti, W) phase decompose into the Ti-rich and W-rich solid solutions.
Although the Co–Ti–W system is one of the most important Co-based superalloy subsystems, only very limited literature on this ternary system (König et al., 2014; Naujoks et al., 2017) was found. König et al. (König et al., 2014) fabricated a Co–Ti–W thin film materials library by magnetron sputtering. The compositions and resistances of various points on the thin film materials library were measured. Since the resistances of single-phase regions are lower than that of mixed phase regions, an unknown ternary phase region was revealed at 1223 K in the Co–Ti–W system according to sudden changes of resistance values at the phase region boundaries. The composition of the new ternary phase was about 60 at% Co–15 at% Ti–25 at% W. However, the new phase was not directly observed in the microstructure of the annealed bulk alloy at 1373 K. Naujoks et al. (Naujoks et al., 2017) proved that the solubility of Ti in Co7W6 phase was 18 at% at 1223 K and determined a three-phase region bcc(W)+Co7W6+αCo2Ti in the 1273 K isothermal section of the Co–Ti–W system using thin-film and bulk materials. Besides, no experimental phase diagram data of the Co–Ti–W system is available.
The crystallographic data of all phases in the three binary systems are listed in Table 1(Magneli and Westgren, 1938; Murray, 1982; Sato et al., 2005).
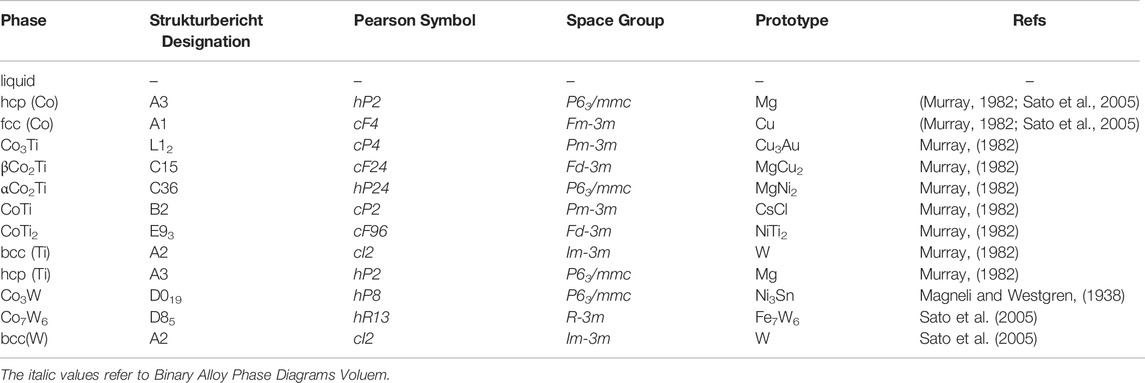
TABLE 1. Crystal structure of phases in the Co–Ti–W system.
Pure Cobalt (99.99 wt%), Titanium (99.99 wt%) and Tungsten (99.99 wt%) (China New Material Technology Company, Ltd.) were used as raw materials in the present work. The weight of each alloy sample is about 3–4 g. These samples were melted by using the arc-furnace (MTI MSM20-7) in an argon atmosphere with a non-consumable tungsten electrode. Several titanium rods firstly were melted in order to absorb residual oxygen before melting samples. To improve the homogeneity, every sample was turned around and re-melted at least 4 times. The samples which weight loss did not exceed 1% during arc melting were used in the following experiments. Then, each sample was cut into several pieces for different purposes.
In order to construct the isothermal sections, the Co–Ti–W alloys were annealed to obtain phase equilibria at 1273 and 1473 K. At 1273 K, the samples were annealed for 1000 h. At 1473 K, the time of the heat treatment varied from 5 h to 3 days for the samples with liquid phase. Others were annealed for about 720 h. In the process of annealing, the samples were sealed in evacuated quartz capsules (6 × 10⁻² Pa), and the chamber furnace (MTI KSL-1400) with a temperature accuracy of ±1 K was used. After heat treatment, the annealed samples were quenched into water to keep the phase constituents at 1273 and 1473 K.
Before microstructural characterization, all samples were ground and polished. The phases and element distributions of the all samples were studied using SEM (Carl Zeiss LEO 1450) in combination with EDS (Thermo Scientific UltraDry EDS). In order to increase the precision of the composition measurements, 3–5 points or areas were analyzed for each phase.
XRD analyses were carried out using X-ray diffractometer (Rigaku Ultima IV) with Cu-Kα radiation at 40 kV and 40 mA to identify the crystal structures of the constituent phases. Diffraction patterns were collected over the 2θ range from 20° to 90° with a scan step 0.02°. The software Jade 6.0 was used to assist phase identifications in this process.
For the investigation of the isothermal section at 1273 K of the Co–Ti–W system, 15 alloys were prepared. The constituent phases and their compositions of the above alloys are summarized in Table 2. The analysis and discussion of each alloy is as follows.
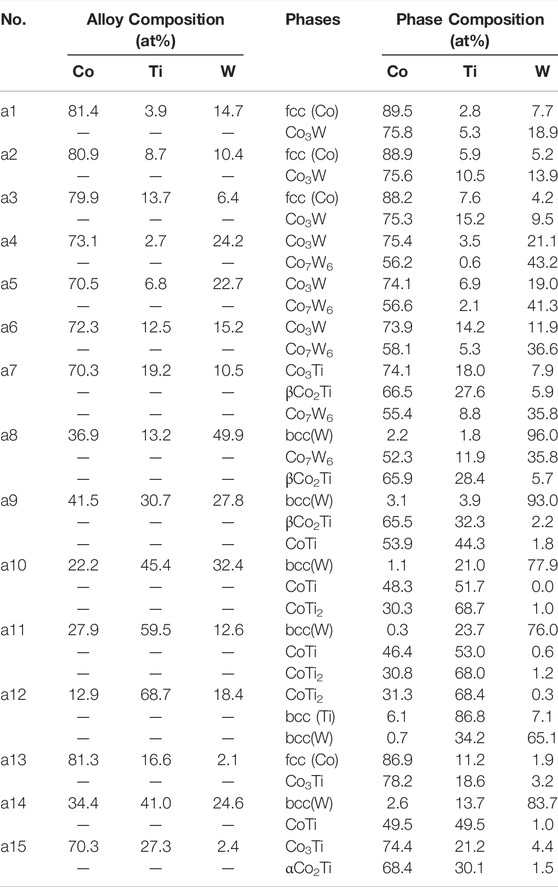
TABLE 2. The constituent phases and their compositions of the Co–Ti–W alloys annealed at 1273 K.
The BSE micrographs of alloys a1–a3 and XRD pattern of alloy a3 are shown in Figure 2. The similar microstructures were observed in Figure 2A–C. Combined the phase compositions of alloys a1–a3 obtained by EDS with the phase constituent of alloy a3 obtained by XRD, it could be determined that three alloys were located in two-phase region fcc (Co)+Co3W, and gray and dark phases were Co3W and fcc (Co), respectively.
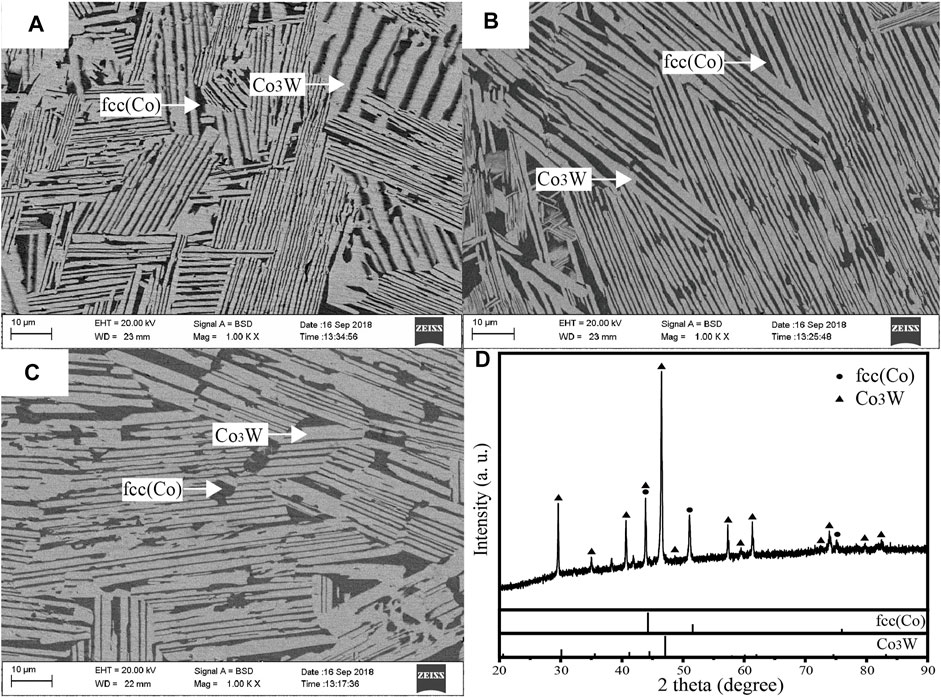
FIGURE 2. BSE micrographs and XRD patterns of alloys (A) for a1 (B) for a2 (C) and (D) for a3.
The two-phase microstructures Co3W + Co7W6 were observed in alloys a4–a6. Figure 3 shows the BSE images of alloys a4–a6 and XRD pattern of alloy a6. The white and gray phases were determined to be Co7W6 and Co3W combining the phase compositions with XRD pattern, respectively.
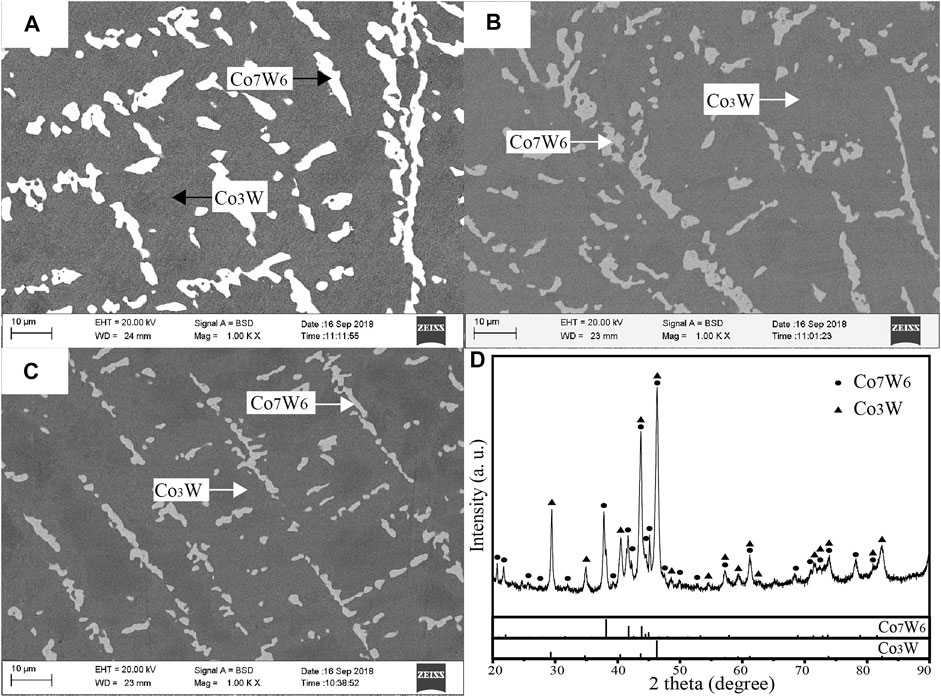
FIGURE 3. BSE micrographs and XRD patterns of alloys (A) for a4 (B) for a5 (C) and (D) for a6.
The BSE micrographs and XRD patterns of alloys a7–a9 annealed at 1273 K are shown in Figure 4. As shown in Figure 4A, three phases were observed in the BSE micrograph of alloy a7. According to the results of EDS measurements, white phase was Co7W6 (55.4 at.% Co–8.8 at.% Ti–35.8 at.% W), gray phase was Co3Ti (74.1 at.% Co–18.0 at.% Ti–7.9 at.% W) and dark gray phase was Co2Ti (66.5 at.% Co–27.6 at.% Ti–5.9 at.% W). In the Co–Ti phase diagram, the Co2Ti phase has two crystal structures which are C36 for αCo2Ti and C15 for βCo2Ti. In present work, the Co2Ti phase in alloy a7 was regarded as βCo2Ti on the basis of XRD pattern in Figure 4B. The same conclusion could be obtained in alloys a8 and a9. Due to the extremely slow atomic mobility of W element, it was difficult to reach an equilibrium state in short annealing time for the alloy a8 with high W content. The microstructure in alloy a8 seemed to be out of complete equilibrium. However, the microstructure was very different from that of as-cast sample. The similar microstructure was also found in Figure 2J in Ref (Liu et al., 2012). when the isothermal section at 1473 K of the Co–Nb–W ternary system was experimentally determined. Therefore, on the basis of the results of EDS and XRD of alloy a8, the alloy a8 was considered to be located in a three-phase region in the present work, in which white, gray and dark phases were determined to be bcc(W) (2.2 at.% Co–1.8 at.% Ti–96.0 at.% W), Co7W6 (52.3 at.% Co–11.9 at.% Ti–35.8 at.% W) and βCo2Ti (65.9 at.% Co–28.4 at.% Ti–5.7 at.% W), respectively. In the BSE micrograph of alloy a9, the compositions of white, gray and dark phases were 3.1 at.% Co–3.9 at.% Ti–93.0 at.% W, 65.5 at.% Co–32.3 at.% Ti–2.2 at.% W and 53.9 at.% Co–44.3 at.% Ti–1.8 at.% W, respectively. Combined with the XRD pattern shown in Figure 4F, white phase was bcc(W), gray phase was βCo2Ti and dark phase was CoTi. Based on the above analysis, alloys a7–a9 were located in three-phase regions Co7W6+Co3Ti+βCo2Ti, bcc(W)+Co7W6+βCo2Ti and bcc(W)+CoTi+βCo2Ti, respectively.
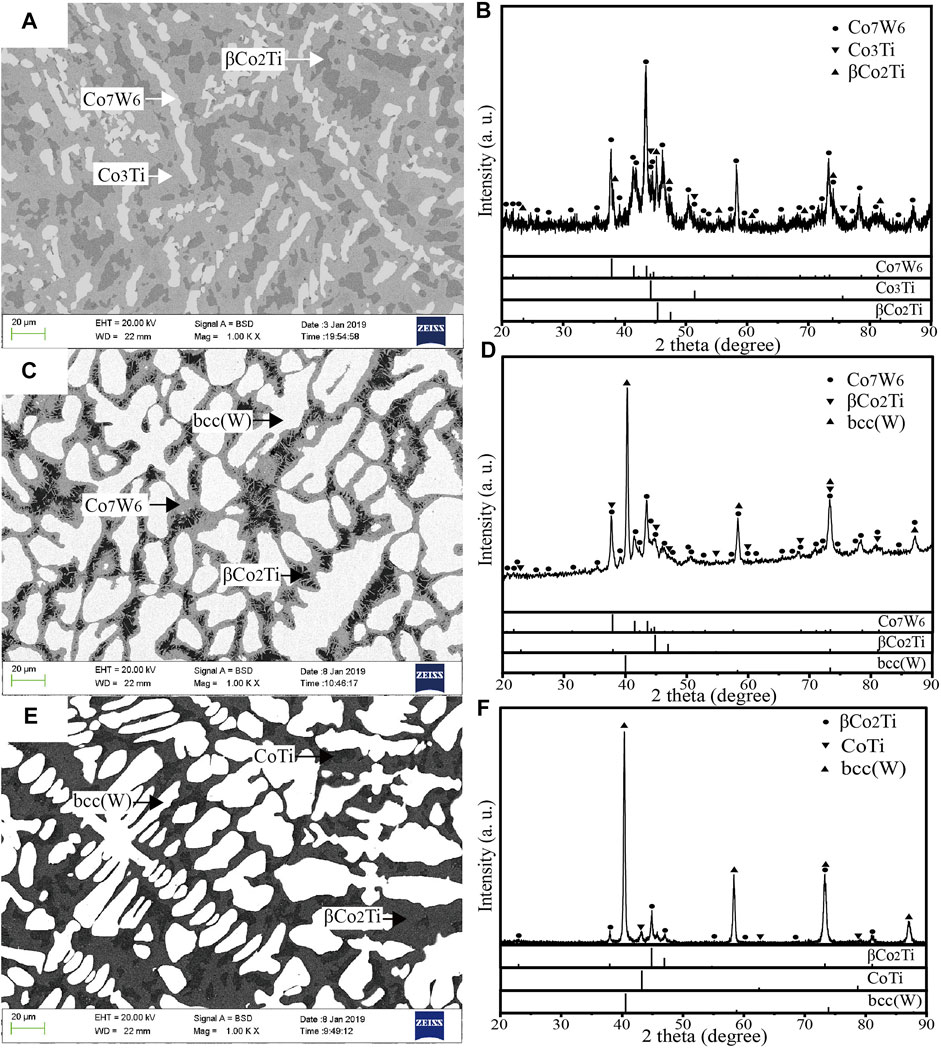
FIGURE 4. BSE micrographs and XRD patterns of alloys (A) and (B) for a7 (C) and (D) for a8 (E) and (F) for a9.
The alloys a10 and a11 were both located in three-phase region CoTi + CoTi2+bcc(W). Figure 5A shows the microstructure of alloy a11 annealed at 1273 K. According to the composition of each phase obtained by EDS, white phase was bcc(W) (0.3 at.% Co–23.7 at.% Ti–76.0 at.% W), light-gray phase was CoTi (46.4 at.% Co–53.0 at.% Ti–0.6 at.% W), and dark-gray phase was CoTi2 (30.8 at.% Co–68.0 at.% Ti–1.2 at.% W). The XRD pattern of the alloy is shown in Figure 5B, where the characteristic peaks of the bcc(W), CoTi and CoTi2 phases were well distinguished and marked by different symbols. The boundary of three-phase region bcc(W)+CoTi + CoTi2 was determined by the average values of phase compositions in alloys a10 and a11. The BSE micrograph and XRD pattern of alloy a12 are presented in Figure 5C,D. According to the phase compositions and XRD result, alloy a12 was located in three-phase region bcc (Ti)+bcc(W)+CoTi2.
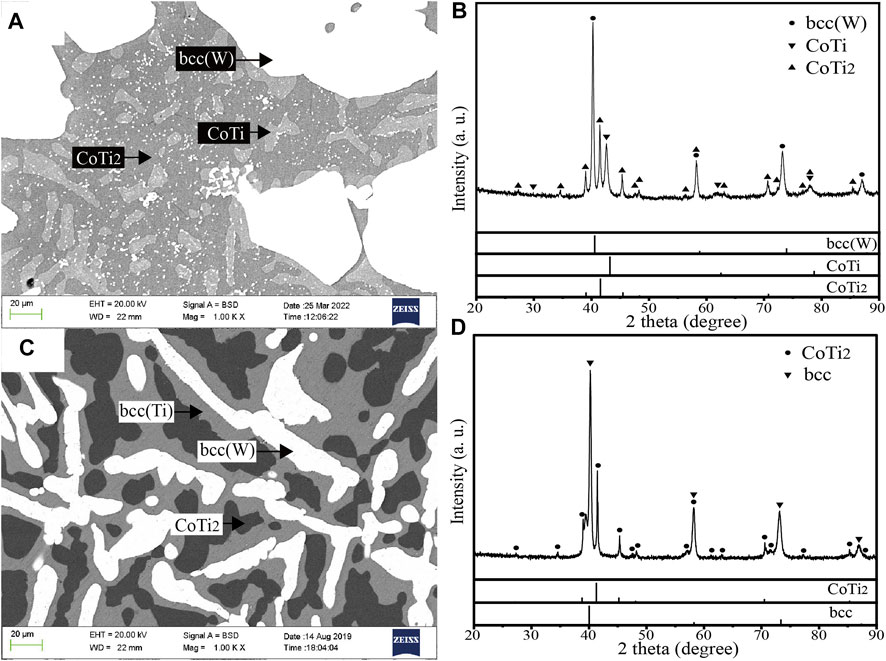
FIGURE 5. BSE micrographs and XRD patterns of alloys (A) and (B) for a11 (C) and (D) for a12.
Figure 6 shows the microstructures of alloys a13–a15 and the XRD pattern of alloy a15. According to the BSE micrographs and the composition of each phase, dark phase was fcc (Co) (86.9 at.% Co–11.2 at.% Ti–1.9 at.% W), gray phase was Co3Ti (78.2 at.% Co–18.6 at.% Ti–3.2 at.% W) in alloy a13 and white phase was bcc(W) (2.6 at.% Co–13.7 at.% Ti–83.7 at.% W), dark phase was CoTi (49.5 at.% Co–49.5 at.% Ti–1.0 at.% W) in alloy a14. For alloy a15, the XRD result in Figure 6D indicated that Co3Ti and αCo2Ti co-existed in this alloy. The BSE micrograph and EDS measurement confirmed that a two-phase microstructure Co3Ti+αCo2Ti occurred in alloy a15.
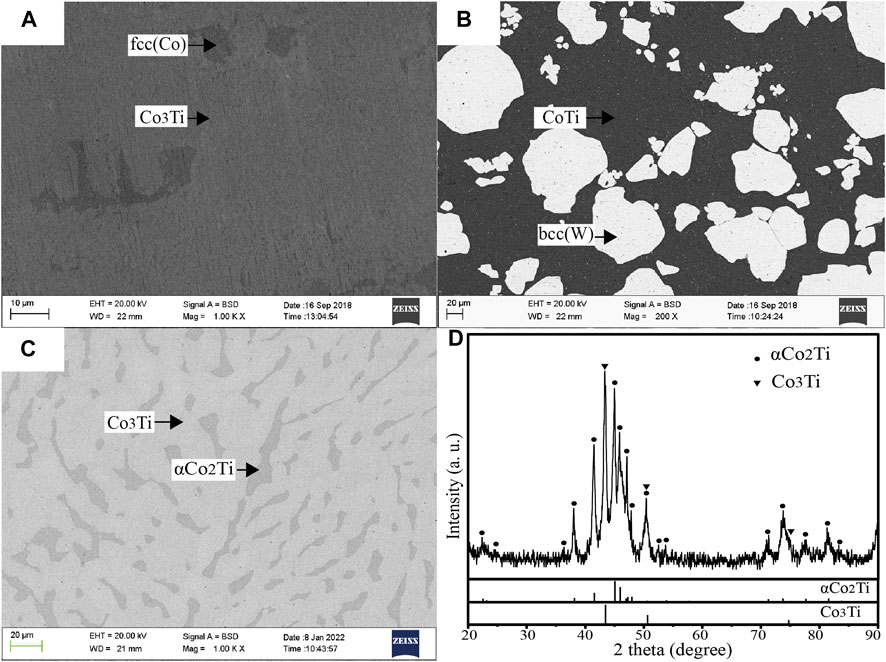
FIGURE 6. BSE micrographs and XRD pattern of alloys (A) for a13 (B) for a14 (C) and (D) for a15.
Based on the present experimental results, the isothermal section of the Co–Ti–W system at 1273 K was derived. Five three-phase regions and five two-phase regions were experimentally determined. The maximum solubility of W in Co3Ti phase was measured to be ∼7.9 at.%. In addition, the maximum solubilities of Ti in Co7W6 and Co3W were ∼11.9 at.% and ∼15.2 at.%, respectively. And the maximum solubilities of W in αCo2Ti, βCo2Ti and CoTi were ∼1.5 at.%, ∼5.9 at.% and ∼1.8 at.%, respectively.
10 alloys were used to investigate the isothermal section at 1473 K of the Co–Ti–W system. The compositions and phase constituents of the alloys are summarized in Table 3. In the Co–Ti phase diagram, two liquid phase regions exist in the Co-rich side and Ti-rich side at 1473 K, namely liquid#1 and liquid#2 in current work, respectively. The eutectic microstructures from the solidification of liquid could be observed in alloys b1, b2, b7, b8 and b10.
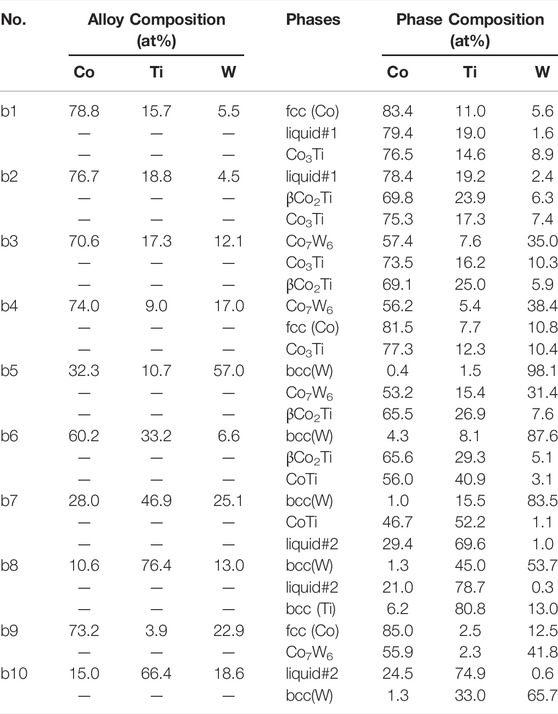
TABLE 3. The constituent phases and their compositions of the Co–Ti–W alloys annealed at 1473 K.
Figure 7A shows BSE micrograph of alloy b1. Three phases, fcc (Co), liquid#1 and Co3Ti, were identified based on marked characteristic peaks of the XRD pattern in Figure 7B. According to the EDS results, the eutectic microstructure was the solidification microstructure from liquid#1 (79.4 at.% Co–19.0 at.% Ti–1.6 at.% W), white and gray phases were Co3Ti (76.5 at.% Co–14.6 at.% Ti–8.9 at.% W) and fcc (Co) (83.4 at.% Co–11.0 at.% Ti–5.6 at.% W), respectively. A three-phase region fcc (Co)+liquid#1 + Co3Ti was determined. In the microstructure of alloy b2, liquid#1 (78.4 at.% Co–19.2 at.% Ti–2.4 at.% W) was also observed. The other two phases were determined to be Co3Ti (75.3 at.% Co–17.3 at.% Ti–7.4 at.% W) which was gray phase and βCo2Ti (69.8 at.% Co–23.9 at.% Ti–6.3 at.% W) which was white phase according to the results of EDS and XRD.
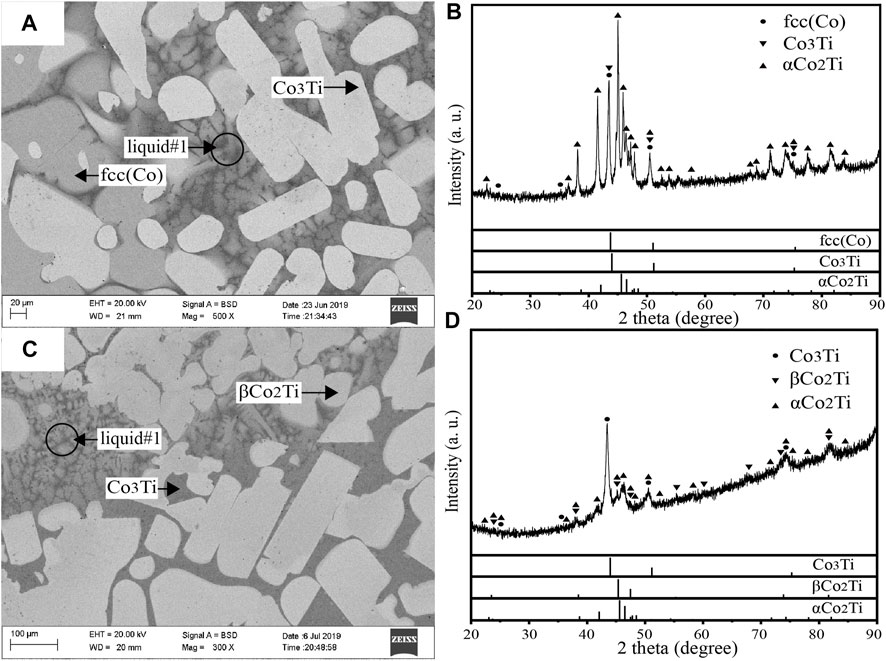
FIGURE 7. BSE micrographs and XRD patterns of alloys (A) and (B) for b1 (C) and (D) for b2.
The BSE micrograph and XRD pattern of alloy b3 annealed at 1473 K are shown in Figure 8A,B. A three-phase microstructure could be observed in Figure 8A. According to the results of the EDS measurements, the compositions of the dark, gray and white phases were determined to be 69.1 at.% Co–25.0 at.% Ti–5.9 at.% W, 73.5 at.% Co–16.2 at.% Ti–10.3 at.% W and 57.4 at.% Co–7.6 at.% Ti–35.0 at.% W, respectively. Combined with XRD pattern shown in Figure 8B, dark, gray, and white phases were βCo2Ti, Co3Ti and Co7W6, respectively. As shown in Figure 8D, alloy b4 was composed of three phases, Co7W6, fcc (Co) and Co3Ti, based on the distinguished characteristic peaks of the XRD pattern. The compositions of phases indicated that gray phase was Co3Ti (77.3 at.% Co–12.3 at.% Ti–10.4 at.% W), white phase was Co7W6 (56.2 at.% Co–5.4 at.% Ti–38.4 at.% W) and dark phase was fcc (Co) (81.5 at.% Co–7.7 at.% Ti–10.8 at.% W).
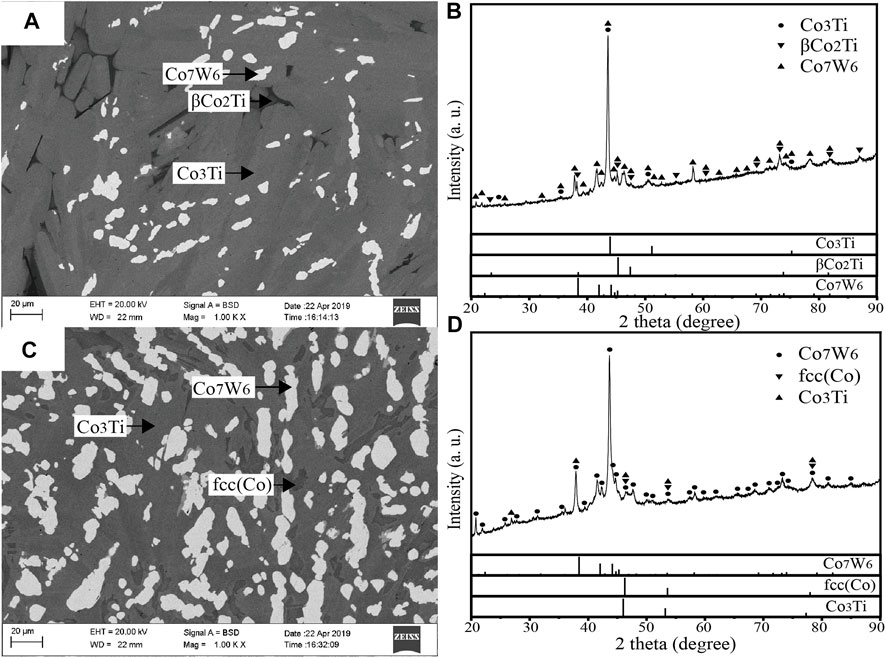
FIGURE 8. BSE micrographs and XRD patterns of alloys (A) and (B) for b3 (C) and (D) for b4.
All of the equilibrium microstructures in the above four alloys (b1, b2, b3 and b4) contained Co3Ti phase. However, the Co3Ti phase was not stable at 1473 K in the Co–Ti system. It was demonstrated that Co3Ti phase became a stable compound at 1473 K owing to the addition of W. According to the above experimental results, the homogeneity range of W in Co3Ti was about ∼7.4–10.4 at.%. It could be inferred that the new ternary compound proposed by König et al. (König et al., 2014) may be Co3Ti due to the relatively similar composition ranges of the two compounds.
Figure 9 shows the BSE micrographs of alloys b5–b8 annealed at 1473 K. The three-phase microstructures in four alloys were observed in the BSE images. Based on the EDS measurements, the white, light-gray and dark-gray phases in alloy b5 were bcc(W) (0.4 at.% Co–1.5 at.% Ti–98.1 at.% W), Co7W6 (53.2 at.% Co–15.4 at.% Ti–31.4 at.% W) and βCo2Ti (65.5 at.% Co–26.9 at.% Ti–7.6 at.% W), respectively. A three-phase equilibrium bcc(W)+CoTi+βCo2Ti was determined in the microstructure of alloy b6. According to the results of EDS analysis, white phase was bcc(W) (4.3 at.% Co–8.1 at.% Ti–87.6 at.% W), gray phase was βCo2Ti (65.6 at.% Co–29.3 at.% Ti–5.1 at.% W) and black phase was CoTi (56.0 at.% Co–40.9 at.% Ti–3.1 at.% W). As shown in Figure 9C,D, both alloys b7 and b8 contained liquid#2 in the annealed microstructures. The eutectic structure from solidification of liquid#2 in alloy b7 was not obvious due to the low volume fraction of liquid#2. According to the results of SEM and EDS, alloys b7 and b8 were located in the three-phase regions of liquid#2 + bcc(W)+CoTi and liquid#2 + bcc(W)+bcc (Ti), respectively.
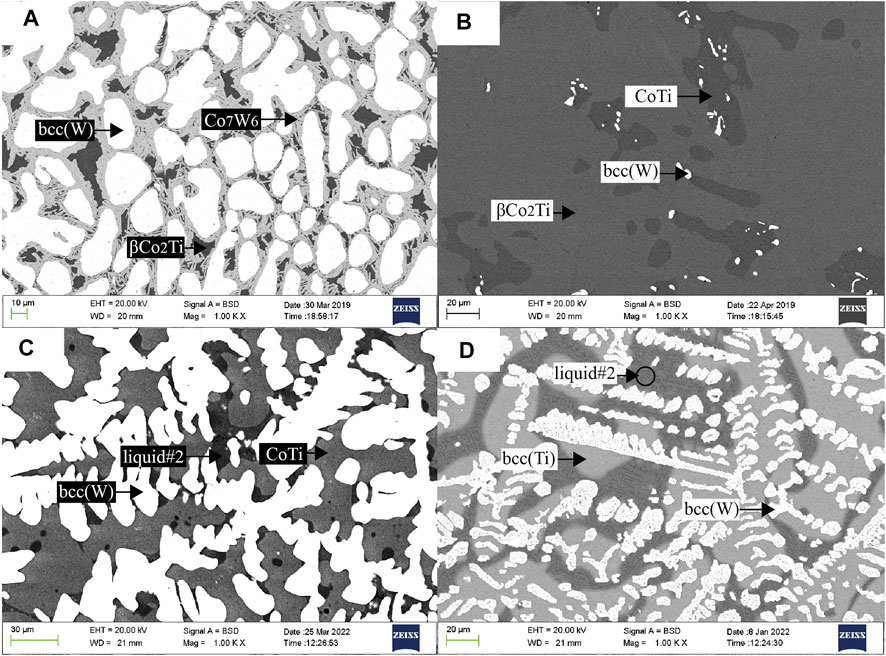
FIGURE 9. BSE micrographs of alloys (A) for b5 (B) for b6 (C) for b7 (D) for b8.
Two two-phase equilibrium microstructures were observed in the alloys b9 and b10. According to the BSE micrograph of alloy b9 in Figure 10A and phase compositions from EDS measurements, alloy b9 was located in the two-phase region fcc (Co)+Co7W6. The white and gray phases were Co7W6 (55.9 at.% Co–2.3 at.% Ti–41.8 at.% W) and fcc (Co) (85.0 at.% Co–2.5 at.% Ti–12.5 at.% W), respectively. The alloy b10 consisted of bcc(W) (1.3 at.% Co–33.0 at.% Ti–65.7 at.% W) and liquid#2 (24.5 at.% Co–74.9 at.% Ti–0.6 at.% W) as shown in Figure 10B.
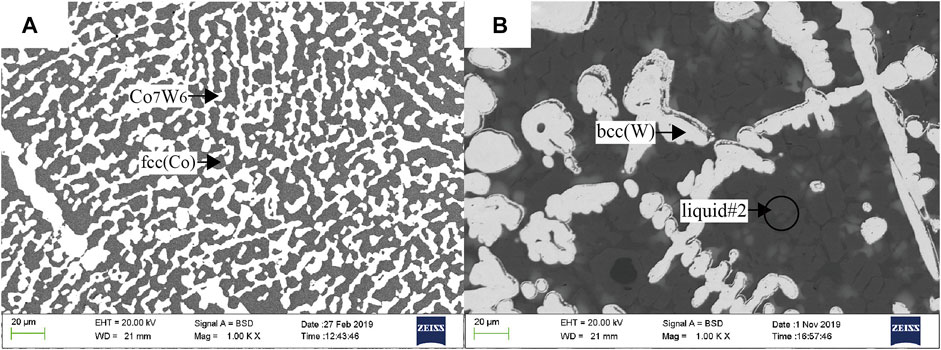
FIGURE 10. BSE micrographs of alloys (A) for b9 (B) for b10.
Based on the above experimental results, the isothermal section of the Co–Ti–W system at 1473 K was constructed. Eight three-phase regions and two two-phase regions were determined in the isothermal section. The Co3Ti phase was proved to be a stable phase and the composition range of W in Co3Ti phase was measured to be ∼7.4–10.4 at.% at the 1473 K. The maximum solubilities of Ti in Co7W6 and W in βCo2Ti and CoTi at 1473 K were ∼15.4 at.%, ∼7.6 at.% and ∼3.1 at.%, respectively.
The constructed isothermal sections at 1273 and 1473 K of the Co–Ti–W system on the basis of the above experimental data are shown in Figure 11A,B.
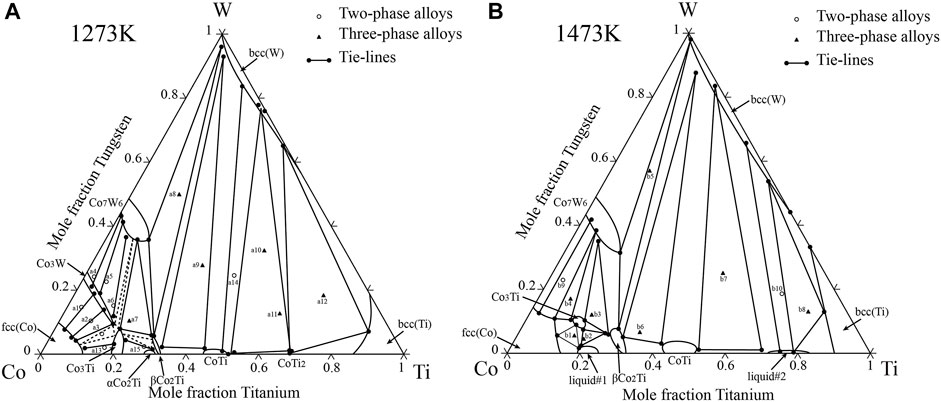
FIGURE 11. Isothermal sections of the Co–Ti–W system (A) at 1273 K and (B) at 1473 K
The isothermal sections at 1273 and 1473 K of the Co–Ti–W system were constructed by phase equilibrium relationships obtained using SEM/EDS, XRD methods in the current work.
In the isothermal section at 1273 K of the Co–Ti–W system, five three-phase regions, Co7W6+Co3Ti+βCo2Ti, Co7W6+βCo2Ti + bcc(W), βCo2Ti + CoTi + bcc(W), CoTi + CoTi2+bcc(W) and CoTi2+bcc(W)+bcc (Ti), were experimentally determined, and three three-phase regions, fcc (Co)+Co3W + Co3Ti, Co3W + Co7W6+Co3Ti and Co3Ti+βCo2Ti+αCo2Ti, were derived according to the phase relations. The experimental results showed that Co3Ti phase could dissolve ∼7.9 at.% W at 1273 K.
The isothermal section at 1473 K of the Co–Ti–W system included eight three-phase regions, fcc (Co)+Co7W6+Co3Ti, fcc (Co)+Co3Ti + liquid#1, Co3Ti + liquid#1+βCo2Ti, Co7W6+Co3Ti+βCo2Ti, bcc(W)+Co7W6+βCo2Ti, bcc(W)+βCo2Ti + CoTi, bcc(W)+CoTi + liquid#2 and bcc(W)+liquid#2 + bcc (Ti). The Co3Ti phase became a stable phase at 1473 K owing to the addition of W, and the homogeneity range of W in the Co3Ti phase was determined to be ∼7.4–10.4 at.% at 1473 K.
The original contributions presented in the study are included in the article/Supplementary Material, further inquiries can be directed to the corresponding authors.
YS was responsible for conduct of the experiments, performance tests and data analysis. CG was responsible for experimental design, data analysis and paper revision. CL, ZD and DH were responsible for paper revision.
This work was supported by the National Key R&D Program of China (Grant No. 2017YFB0702901) and National Natural Science Foundation of China (NSFC) (Grant No. 51771021).
The authors declare that the research was conducted in the absence of any commercial or financial relationships that could be construed as a potential conflict of interest.
All claims expressed in this article are solely those of the authors and do not necessarily represent those of their affiliated organizations, or those of the publisher, the editors and the reviewers. Any product that may be evaluated in this article, or claim that may be made by its manufacturer, is not guaranteed or endorsed by the publisher.
Balam, S. S. K., and Paul, A. (2011). Study of Interdiffusion and Growth of Topologically Closed Packed Phases in the Co-nb System. J. Mater Sci. 46 (4), 889–895. doi:10.1007/s10853-010-4831-7
Bauer, A., Neumeier, S., Pyczak, F., and Göken, M. (2010). Microstructure and Creep Strength of Different γ/γ′-strengthened Co-base Superalloy Variants. Scr. Mater. 63 (12), 1197–1200. doi:10.1016/j.scriptamat.2010.08.036
Betteridge, W., and Shaw, S. W. K. (1987). Development of Superalloys. Mater. Sci. Technol. 3 (9), 682–694. doi:10.1179/mst.1987.3.9.682
Bocchini, P. J., Sudbrack, C. K., Noebe, R. D., and Dunand, D. C. (2017). Effects of Titanium Substitutions for Aluminum and Tungsten in Co–10Ni–9Al–9W (At%) Superalloys[J]. Mater. Sci. Eng. A 705, 122–132. doi:10.1016/j.msea.2017.08.034
Cacciamani, G., Ferro, R., Ansara, I., and Dupin, N. (2000). Thermodynamic Modelling of the Co-ti System. Intermetallics 8 (3), 213–222. doi:10.1016/s0966-9795(99)00098-9
Cheng, J., Yang, J., Zhang, X., Zhong, H., Ma, J., Li, F., et al. (2012). High Temperature Tribological Behavior of a Ti-46Al-2Cr-2Nb Intermetallics. Intermetallics 31, 120–126. doi:10.1016/j.intermet.2012.06.013
Christofidou, K. A., Jones, N. G., Pickering, E. J., Flacau, R., Hardy, M. C., and Stone, H. J. (2016). The Microstructure and Hardness of Ni-Co-Al-Ti-Cr Quinary Alloys. J. Alloys Compd. 688, 542–552. doi:10.1016/j.jallcom.2016.07.159
Davydov, A. V., Kattner, U. R., Josell, D., Waterstrat, R. M., Boettinger, W. J., Blendell, J. E., et al. (2001). Determination of the CoTi Congruent Melting Point and Thermodynamic Reassessment of the Co-ti System. Metall Mat Trans A 32 (9), 2175–2186. doi:10.1007/s11661-001-0193-8
Dmitrieva, G., Cherepova, T., and Shurin, A. (2005). Phase Equilibria in Co–CoAl–W Alloys[J]. Metal Sci. Heat Treat. 4, 3–6.
Gabriel, A., Lukas, H. L., Allibert, C. H., and Ansara, I. (1985). Experimental and Calculated Phase Diagrams of the Ni-W Co-W and Co-ni-W System. Int. J. Mater. Res. 76 (9), 589–595. doi:10.1515/ijmr-1985-760902
Gupta, R. K., Karthikeyan, M. K., Bhalia, D. N., Ghosh, B. R., and Sinha, P. P. (2008). Effect of Microstructure on Mechanical Properties of Refractory Co–cr–W–ni Alloy[J]. Metal Sci. Heat Treat. 50 (3), 175–179. doi:10.1007/s11041-008-9031-6
Gupta, R. K., Karthikeyan, Μ. K., Bhatia, D. N., Ghosh, B. R., and Sinha, P. P. (2008). Effect of Microsctucture on Mechanical Properties of Co-cr-W-ni Superalloy. High Temp. Mater. Process. 27 (3), 185–192. doi:10.1515/htmp.2008.27.3.185
Jin, Z.-p., and Qiu, C. (1993). Thermodynamic Evaluation of Ti-W System. Mater. Sci. Technol. 9 (5), 378–383. doi:10.1179/mst.1993.9.5.378
Jonsson, S. (1996). Reevaluation of the Ti-W System and Prediction of the Ti-W-N Phase Diagram. Int. J. Mater. Res. 87 (10), 784–787. doi:10.1515/ijmr-1996-871008
Kaufman, L., and Nesor, H. (1978). Coupled Phase Diagrams and Thermochemical Data for Transition Metal Binary Systems - II. Calphad 2 (1), 81–108. doi:10.1016/0364-5916(78)90006-8
Kobayashi, S., Tsukamoto, Y., Takasugi, T., Chinen, H., Omori, T., Ishida, K., et al. (2009). Determination of Phase Equilibria in the Co-rich Co-al-W Ternary System with a Diffusion-Couple Technique. Intermetallics 17 (12), 1085–1089. doi:10.1016/j.intermet.2009.05.009
König, D., Pfetzing-Micklich, J., Frenzel, J., and Ludwig, A. (2014). Investigation of Ternary Subsystems of Superalloys by Thin-Film Combinatorial Synthesis and High-Throughput Analysis[C]. EDP Sci. 14, 18002. doi:10.1051/matecconf/20141418002
Lass, E. A., Williams, M. E., Campbell, C. E., Moon, K.-W., and Kattner, U. R. (2014). Γ′ Phase Stability and Phase Equilibrium in Ternary Co-al-W at 900 °C. J. Phase Equilib. Diffus. 35 (6), 711–723. doi:10.1007/s11669-014-0346-2
Lee, C. S. (1971). Precipitation-hardening Characteristics of Ternary Cobalt-Aluminum-X alloys[M]. Tucson, AZ, USA: The University of Arizona.
Li, D., Liu, L., Zhang, Y., Ye, C., Ren, X., Yang, Y., et al. (2009). Phase Diagram Calculation of High Chromium Cast Irons and Influence of its Chemical Composition. Mater. Des. 30 (2), 340–345. doi:10.1016/j.matdes.2008.04.061
Liu, R., Xi, S. Q., Kapoor, S., and Wu, X. J. (2010). Investigation of Solidification Behavior and Associate Microstructures of Co-cr-W and Co-cr-mo Alloy Systems Using DSC Technique. J. Mater Sci. 45 (22), 6225–6234. doi:10.1007/s10853-010-4717-8
Liu, X., Zhang, X., Yang, S., Zhao, C., and Wang, C. (2012). Experimental Investigation of Phase Equilibria in the Co-W-nb Ternary System. Intermetallics 31, 48–54. doi:10.1016/j.intermet.2012.06.008
Llewelyn, S. C. H., Christofidou, K. A., Araullo-Peters, V. J., Jones, N. G., Hardy, M. C., Marquis, E. A., et al. (2017). The Effect of Ni:Co Ratio on the Elemental Phase Partitioning in γ-γ′ Ni-Co-Al-Ti-Cr Alloys. Acta Mater. 131, 296–304. doi:10.1016/j.actamat.2017.03.067
Magneli, A., and Westgren, A. (1938). Röntgenuntersuchung von Kobalt–Wolframlegierungen[J]. Z. Für Anorg. Und Allg. Chem. 238 (2‐3), 268–272. doi:10.1002/zaac.19382380211
Murray, J. L. (1982). The Co−Ti (Cobalt−Titanium) System. Bull. Alloy Phase Diagrams 3 (1), 74–85. doi:10.1007/bf02873414
Murray, J. L. (1981). The Ti−W (Titanium-Tungsten) System. Bull. Alloy Phase Diagrams 2 (2), 192–196. doi:10.1007/bf02881477
Naujoks, D., Eggeler, Y. M., Hallensleben, P., Frenzel, J., Fries, S. G., Palumbo, M., et al. (2017). Identification of a Ternary μ-phase in the Co-ti-W System - an Advanced Correlative Thin-Film and Bulk Combinatorial Materials Investigation. Acta Mater. 138, 100–110. doi:10.1016/j.actamat.2017.07.037
Pollock, T. M., and Tin, S. (2006). Nickel-Based Superalloys for Advanced Turbine Engines: Chemistry, Microstructure and Properties. J. Propuls. Power 22 (2), 361–374. doi:10.2514/1.18239
Qu, S. J., Tang, S. Q., Feng, A. H., Feng, C., Shen, J., and Chen, D. L. (2018). Microstructural Evolution and High-Temperature Oxidation Mechanisms of a Titanium Aluminide Based Alloy. Acta Mater. 148, 300–310. doi:10.1016/j.actamat.2018.02.013
Ravi, R., and Paul, A. (2011). Interdiffusion Study on Co(W) Solid Solution and Topological Close-Packed μ Phase in Co-W System. Intermetallics 19 (3), 426–428. doi:10.1016/j.intermet.2010.10.018
Reed, R. C. (2008). The Superalloys: Fundamentals and applications[M]. Cambridge: Cambridge University Press.
Sato, J., Oikawa, K., Kainuma, R., and Ishida, K. (2005). Experimental Verification of Magnetically Induced Phase Separation in αCo Phase and Thermodynamic Calculations of Phase Equilibria in the Co–W System. Mat. Trans. 46 (6), 1199–1207. doi:10.2320/matertrans.46.1199
Sato, J., Omori, T., Oikawa, K., Ohnuma, I., Kainuma, R., and Ishida, K. (2006). Cobalt-Base High-Temperature Alloys. Science 312 (5770), 90–91. doi:10.1126/science.1121738
Shinagawa, K., Omori, T., Oikawa, K., Kainuma, R., and Ishida, K. (2009). Ductility Enhancement by Boron Addition in Co-al-W High-Temperature Alloys. Scr. Mater. 61 (6), 612–615. doi:10.1016/j.scriptamat.2009.05.037
Sims, C. T., Stoloff, N. S., and Hagel, W. C. (1987). Superalloys II: High-Temperature Materials for Aerospace and Industrial Power. Hoboken, NJ, USA: Wiley.
Tsukamoto, Y., Kobayashi, S., and Takasugi, T. (2010). The Stability of γ '-Co3(Al,W) Phase in Co-al-W Ternary System. Mater. Sci. Forum 654-656, 448–451. doi:10.4028/www.scientific.net/msf.654-656.448
Wang, P., Kontsevoi, O. Y., and Olson, G. B. (2019). Thermodynamic Analysis of the Co-W System. J. Mater Sci. 54 (14), 10261–10269. doi:10.1007/s10853-019-03616-3
Wu, L., Zeng, Y., Pan, Y., Du, Y., Peng, Y., Li, H., et al. (2020). Thermodynamic Description and Simulation of Solidification Microstructure in the Co-ti System. J. Chem. Thermodyn. 142, 105995. doi:10.1016/j.jct.2019.105995
Xu, S., Xu, X., Xu, Y., Liang, Y., and Lin, J. (2016). Phase Transformations and Phase Equilibria of a Ti-46.5Al-16.5Nb Alloy. Mater. Des. 101, 88–94. doi:10.1016/j.matdes.2016.03.131
Xue, F., Wang, M. L., and Feng, Q. (2011). Phase Equilibria in Co-rich Co-al-W Alloys at 1300°C and 900°C. Mater. Sci. Forum 686, 388–391. doi:10.4028/www.scientific.net/msf.686.388
Xue, F., Zhou, H. J., Ding, X. F., Wang, M. L., and Feng, Q. (2013). Improved High Temperature γ′ Stability of Co-al-W-base Alloys Containing Ti and Ta. Mater. Lett. 112, 215–218. doi:10.1016/j.matlet.2013.09.023
Yokokawa, T., Osawa, M., Nishida, K., Kobayashi, T., Koizumi, Y., and Harada, H. (2003). Partitioning Behavior of Platinum Group Metals on the γ and γ′ Phases of Ni-Base Superalloys at High Temperatures. Scr. Mater. 49 (10), 1041–1046. doi:10.1016/s1359-6462(03)00437-8
Keywords: Co-based superalloys, isothermal section, Co—Ti—W system, phase equiblibria, SEM(EDS)/XRD
Citation: Shi Y, Guo C, Li C, Du Z and Hu D (2022) Experimental Investigation on Isothermal Sections at 1273 and 1473 K in the Co–Ti–W System. Front. Mater. 9:880143. doi: 10.3389/fmats.2022.880143
Received: 21 February 2022; Accepted: 29 April 2022;
Published: 18 May 2022.
Edited by:
Wei-Wei Xu, Xiamen University, ChinaCopyright © 2022 Shi, Guo, Li, Du and Hu. This is an open-access article distributed under the terms of the Creative Commons Attribution License (CC BY). The use, distribution or reproduction in other forums is permitted, provided the original author(s) and the copyright owner(s) are credited and that the original publication in this journal is cited, in accordance with accepted academic practice. No use, distribution or reproduction is permitted which does not comply with these terms.
*Correspondence: Cuiping Guo, Y3BndW9AdXN0Yi5lZHUuY24=; Zhenmin Du, ZHV6bUB1c3RiLmVkdS5jbg==
Disclaimer: All claims expressed in this article are solely those of the authors and do not necessarily represent those of their affiliated organizations, or those of the publisher, the editors and the reviewers. Any product that may be evaluated in this article or claim that may be made by its manufacturer is not guaranteed or endorsed by the publisher.
Research integrity at Frontiers
Learn more about the work of our research integrity team to safeguard the quality of each article we publish.