 Armando Garnica-Rodríguez1
 R. Montoya2*
 Francisco Javier Rodríguez-Gomez1
 Tezozomoc Pérez-López3
 Juan Genesca2
- 1Departamento de Ingeniería Metalúrgica, Facultad de Química, Universidad Nacional Autónoma de México, México City, Mexico
- 2Polo Universitario de Tecnología Avanzada, PUNTA, Facultad Química, UNAM, Apodaca, Mexico
- 3Centro de Investigación en Corrosión, Universidad Autónoma de Campeche, Campeche, Mexico
The fast and sharp corrosion potential change from the active state to the passive state, that pure zinc plates immersed in calcium hydroxide saturated solutions with and without chlorides spontaneously exhibit at the early stage of passivation, was studied. The corrosion behavior was investigated by corrosion potential monitoring, anodic polarization curves and electrochemical impedance spectroscopy. The zinc surface was characterized by scanning electron microscopy and X-ray energy dispersive spectroscopy. Experimental results show that the presence of chlorides increases the rate of change of potential by 10-fold in the early stage of passivation, producing a porous passivating film of corrosion products mainly made of calcium hydroxy-zincate Ca(Zn(OH)3)2 · 2 H2O, with a less protective barrier effect than the non-porous film formed without chlorides. On the other hand, a modeling approach was achieved by solving the transient 2D Nernst–Planck equations and considering 12 chemical species. Numerical results confirm that the composition of the chemical products generated on the Zn surface certainly depends on the concentration of Cl¯ ions: Simonkolleite and hidroxides become unstable in the presence of high Cl¯ concentrations, whereas calcium hydroxyl-zincate is the main chemical compound generated on the Zn surface. However, the presence of the latter compound is much more important in electrolytes with very low concentration of Cl¯ ions.
1 Introduction
Zinc is one of the most extensively used metals. Its most important construction application is corrosion protection of steel structures (Zhang, 1996). Galvanizing is a conventional means of protecting steel reinforcement components against corrosion when they are embedded in concrete. Galvanized reinforcement embedded in concrete could delay the onset of corrosion approximately 4–5 times that for the corrosion of bare steel reinforcement and could stand chloride levels of at least 2.5 times higher than those causing corrosion in bare steel reinforcement under similar conditions (Yeomans, 1995). The service life of the galvanized steel embedded in concrete is prolonged by forming a passivating film on the surface of a uniform zinc coating with a significant thickness. Moreover, in the presence of chlorides, the chloride content at the metal–concrete interface and the galvanized coating composition will determine the corrosion products on the galvanized reinforcement (Belaid et al., 2000; Yadav et al., 2004). The passivation process of zinc determines the corrosion protection provided by zinc coatings on steel reinforcements; it occurs when the galvanized steel reinforcement is embedded in fresh concrete, which has a pore solution with a high pH; and the external layer of zinc coating corrodes with the evolution of hydrogen as a cathodic reaction until a protective film is formed (Wilson et al., 1987; Farina and Duffó, 2007; Tan and Hansson, 2008). On the other hand, some authors claim that the main oxidizing agent is the oxygen in the formation of the passivating film on the galvanized steel (Tittarelli and Bellezze, 2010; Zheng et al., 2018a). The alkalinity of fresh concrete is mainly provided by calcium hydroxide and at a pH lower than 13.3 makes hydroxy-zincate ions precipitate on the galvanized coating generating very fine and compact crystals, thus giving the galvanized coating a passive state (Vera et al., 2012). The term “passive state” is understood as the state characterized by a contiguous passivating film of solid corrosion products separating the metallic phase from the adjacent electrolyte, and the term “active state” is understood as the direct transfer (which may involve one or several steps) of metal ions from the metallic phase to the adjacent electrolyte (Heusler et al., 1990). During the setting of concrete, pH values in a range of 12.5–13.3 are characteristic of fresh concrete (Struble et al., 1987; Räsänen and Penttala, 2004; Böhni, 2005). A typical hot dip galvanized coating structure consists of four alloy layers as follows: “eta” (100% Zn) at the outer surface, which at first is in contact with fresh and cured concrete; “zeta” (94% Zn–6% Fe); “delta” (90% Zn–10% Fe); and “gamma” (75% Zn–25% Fe) at the steel/zinc interface. The coating is metallurgically bonded to the steel (Zhang, 1996; Marder, 2000; Yeomans, 2004). The retention of the external pure zinc layer is fundamental for the corrosion of galvanized steel; if this layer is lost, the underlying zinc-iron-layer will be destroyed, and zinc required to form hydroxy-zincate as a protective corrosion product will be insufficient (Wilson et al., 1987). The type of corrosion of galvanized reinforcements is influenced by the chloride content and increases the risk of corrosion by localized attack, which breaks the protective film of hydroxy-zincate and reaches the metal base. In the absence of chlorides, pitting has never been detected on galvanized coatings (González and Andrade, 1982). Thus, the presence of chlorides increases the risk of failure by corrosion. In addition, it should be pointed out that some of the differences in the corrosion behavior of galvanized coating in concrete observed by different investigators are due to experimental differences, such as the water/cement ratio, quality of concrete, amount of cover, type of cement, aggregate, roughness of the coating surface, and metallurgical microstructure of the coating (Tan and Hansson, 2008; Pernicova et al., 2017). Several studies have been devoted to understanding the corrosion and passivation of galvanized coating in concrete and in simulated pore solutions, where, as a standard practice, the reference solution is the saturated calcium hydroxide solution, and the calcium ion has a major influence on the passivation of galvanized steel bars (Arenas et al., 2006; Sahoo and Balasubramaniam, 2008; Tittarelli and Bellezze, 2010; Dobias et al., 2017; Zheng et al., 2018a; Zheng et al., 2018b). Considering that the hot-dip zinc coating, described above, consists of iron–zinc alloy phases at the interface along with a top coat of pure zinc. There are results of corrosion of pure zinc plates immersed in saturated calcium hydroxide, which satisfactorily agree with those obtained from the measurements carried out on galvanized rebar specimens embedded in concrete and stored in different curing environments (Tittarelli and Bellezze, 2010). Most of the literature on zinc passivation in alkaline media details the zinc active–passive transition under galvanostatic or potentiodynamic conditions (Bockelmann et al., 2017), which is different from spontaneous passivation. Two main mechanisms of passive film formation have been postulated: the “dissolution–precipitation” mechanism used for the interpretation of galvanostatic measurements and the “solid-state” reaction mechanism used for potentiodynamic measurements (Bockelmann et al., 2018). According to previous studies on the behavior of zinc and galvanized steel in fresh concrete, saturated calcium hydroxide solution, and simulated pore solutions, during first hours of immersion or embedding, occurs a spontaneous sudden change of potential from an active state to a passive state (Macías and Andrade, 1987a; Macías and Andrade, 1987b; Macías and Andrade, 1990; Zhang, 1996; Yeomans, 2004; Ghosh and Singh, 2007; Videm, 2007; Tittarelli and Bellezze, 2010; Dobias et al., 2017; Zheng et al., 2018b). However, as far as the authors know, there are no published reports about how fast the rate of change of such a sudden change of potential is and its effect on the type of passivating film formed during the early zinc passivation in calcium saturated or simulated pore solutions. Therefore, considering the term “passivation” being understood as the process of transition from the active to the passive state by the formation of the passivating film (Heusler et al., 1990), the aim of this work is to study the effect of the rate of change of the spontaneous and sudden change of corrosion potential on the initial formation of the passivating film of zinc in saturated calcium hydroxide solutions with and without the presence of chloride ions.
2 Materials and Methods
2.1 Materials
The test samples were 99% pure zinc plates with dimensions of about 30 mm × 20 mm x 2 mm cut from sheets of about 10 cm × 3 cm × 2 mm provided by the supplier Reactivos Química Meyer in México batch number: TK10092. For each test, 3 zinc plates were polished with 1,200 grit sandpaper and degreased with acetone. The test solutions were prepared with calcium hydroxide analytical grade, sodium chloride (pure, 99%), and tridistilled water (0.1 µS, at 25°C). Before each test, new solutions, the saturated calcium hydroxide solution and the saturated calcium hydroxide solution with 3% of chlorides, were prepared as described below. The saturated calcium hydroxide solution was prepared by direct dissolution of 0.5 g of calcium hydroxide in 250 ml of tridistilled water in a 500 ml Erlenmeyer flask; at once, the flask was sealed with parafilm to prevent the absorption of carbon dioxide from the air; then the solution was stirred in a magnetic stir plate for 30 min at 300 rpm, and then it was left to stand for 1 h. For the saturated calcium hydroxide solution with 3% of chloride ions, the same procedure was followed with the addition of 12.36 g of sodium chloride (7.5 g chloride ions).
2.2 Test Methods
The tests were carried out at room temperature, about 22°C, under aerated conditions (in equilibrium with the atmosphere) and without stirring the solution. The electrochemical measurements were made by using a Biologic SP-300 potentiostat, and a three-electrode electrochemical cell consisted of an acrylic and glass cell of about 10 cm × 15 cm with a circular opening of diameter 1 cm, as shown in Figure 1. The three electrodes were a zinc plate as the working electrode, a saturated calomel electrode (SCE) with a Luggin glass bridge as the reference electrode, and a graphite bar as the counter electrode. The specimens were introduced by moderately pressing them against a silicone o-ring of diameter 1 cm, and the exposed area was 0.785 cm2. The corrosion potential (Ecorr) measurements of the zinc plates immersed in the two different solutions were made every 60 s for at least 24 h, at least two potential tests were made, the results were within ±20 mV, and if the duplicate tests exceeded this variance, a third test was made. The anodic polarization curves of the zinc plates immersed in the two different solutions were measured potentiodynamically with potential scan rates of 0.025, 0.1, and 0.5 mV/s; from the Ecorr to a positive overpotential of 800 mV, after 1 hour of immersion, at least two polarization tests were made; the results of current were within the same order of magnitude; and if the duplicate tests exceeded this variance, a third test was made. During a different Ecorr monitoring test, the Electrochemical Impedance Spectroscopy (EIS) measurements of the zinc plates immersed in the two different solutions were measured with a sinus amplitude of ±10 mV, and the frequency range from 200 kHz to 100 mHz; before and after the spontaneous sudden change of potential, at least two EIS tests were made; the results of which were within the same order of magnitude; and if the duplicate tests exceeded this variance, a third test was made. The surface morphology and chemical composition of the zinc plates immersed in the two test solutions were characterized by using the Scanning Electron Microscope (SEM) and X-ray energy dispersive spectroscopy (EDS) techniques before and after 30 h of immersion. The surface characterization tests were carried out by using a scanning electron microscope JEOL JSM-5900. All the results were selected based on one specimen which was representative of the major findings.
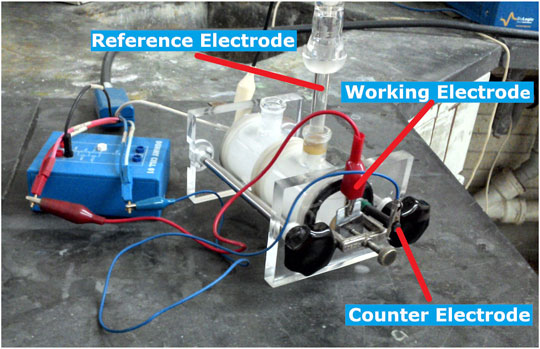
FIGURE 1. Three-electrode electrochemical cell of acrylic and glass of about 10 cm × 15 cm, with a zinc plate as the working electrode, a saturated calomel electrode (SCE) as the reference electrode, and a graphite bar as the counter electrode.
3 Modeling
A transport model using the Nernst–Planck equations (Deconinck, 2012; Newman and Thomas-Alyea, 2012) was built up to find transient information about chemical species distributions during the corrosion of pure Zn under a pH = 12.5 electrolyte with and without the presence of Cl¯. These equations were solved by using the finite element method. A computational code was written in the Python language, and the findings were corroborated with COMSOL Multyphysics® 5.3a. The governing equation is as follows:
where Ci, Ri, and Ni are the concentration (mol/m3), the net generation/consumption rate due to chemical reactions (mol/m3·s), and the molar flux (mol/m2·s), respectively, of species i. Neglecting the convective term, and for a dilute solution, the flux is expressed according to the following equation:
where Di, zi, and ui represent the diffusion coefficient (m2/s), the charge number, and the ionic mobility (s mol/kg) of species i, respectively; ϕ is the electric potential within the electrolyte (V); and F is the Faraday constant (96, 485 C/mol). ui can be estimated by means of the Nernst–Einstein relation: ui = Di/RT, where T is the absolute temperature (K) and R is the universal gas constant (8.314 J/mol K). The combination of Eqs. 1 and 2 results in the following well-known Nernst–Planck equation:
If the number of chemical species taken into account is n, then the number of unknowns in the system is n + 1 due to ϕ. The extra equation for solving the global system is the following electroneutrality condition:
At this point, the reader should bear in mind that the Nernst–Planck equations have been developed under the assumption of dealing with infinite dilute solutions (Deconinck, 2012; Newman and Thomas-Alyea, 2012). Moreover, it is well known that diffusion depends on the concentration of the electrolyte (Lohrengel et al., 2003). Then, in order to properly predict transient concentration distributions in the electrolytes used in this investigation, it has been followed the approximation made by Hung and Dinius (Hung and Dinius, 1972): The diffusion coefficient of each species i was expressed as a function of the concentration of other species, Cl− ion in the present case, as follows:
where D0i is the coefficient diffusion of species i at infinite dilution and ai is a fitting parameter. Under the previous semi-empirical considerations, Eq. 3 has been successfully implemented dealing with concentrated electrolytes (Lohrengel et al., 2003; Damme et al., 2006; Deconinck et al., 2012; Simillion et al., 2014; Simillion et al., 2016; Montoya et al., 2021).
Figure 2 is the schematic representation of the studied system: The domain Ω where the above equations were solved was the electrolyte. Disregarding O2, OH¯, and Zn++ species, a nil flux was considered as the boundary condition on the electrolyte border (Γ1 ∪ Γ2 ∪ Γ3 ∪ Γ4) for all the other species.
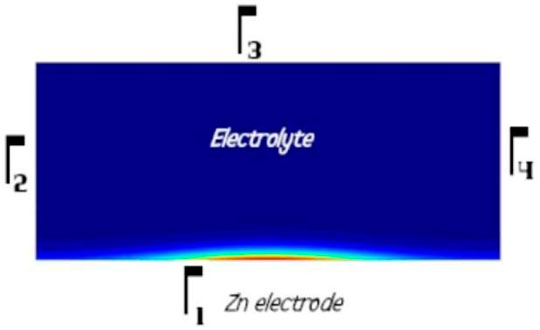
FIGURE 2. General 2D simulated system. The border Γ1 represents the Zn surface in contact with the electrolyte; Γ2, Γ3, and Γ4 represent the borders of the electrolyte in contact with the air (where the O2 concentration is fixed as 0.26(mol/m3)). The electrolyte is considered as the domain Ω of the problem.
Additionally, the dissolved oxygen concentration on the electrolyte/air boundary (Γ2 ∪ Γ3 ∪ Γ4) was considered as 0.26 (mol/m3) (Thébault et al., 2011). Regarding Ri in Eq. 3, just seven of them were used for the sake of simplicity and are presented in Table 1. The rate constants, kf and kb, of chemical reactions were taken from the literature (Zhang and Muhammed, 2001; Ziegler and Johnson, 2001; Dolgikh et al., 2019). On the other hand, the following two electrochemical reactions were taken into account:
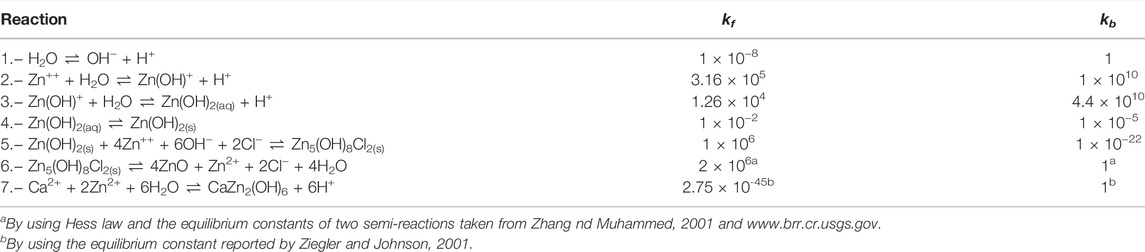
TABLE 1. Homogeneous reactions and kinetic constants (Dolgikh et al., 2019).
Zn oxidation(on Γ1):
oxygen (also on Γ1) reduction:
The above electrochemical reactions provide the electric current densities at the surface of the galvanic couple and allow defining the flux of the OH−and Zn2+ species (entering into the system) by the following equations, respectively:
where n is the number of transferred electrons in each heterogeneous reaction and v is the stoichiometric coefficient of species OH−and Zn2+, respectively. The kinetic parameter values used in this work are reported in Table 2. It is important to bear in mind that Reaction 7 puts in relation (1:4) the consumption of oxygen and the production of OH¯ on the metallic border Γ1, respectively. More parameters values used for simulations are displayed in Table 3.
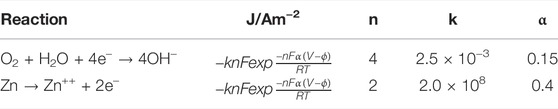
TABLE 2. Electrochemical reactions and kinetic constants (Simillion et al., 2016).
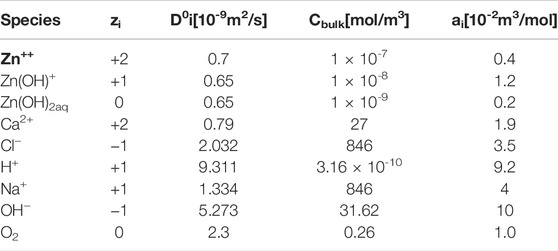
TABLE 3. Parameters considered during simulations.
Before ending this section, it is useful to indicate how the generation rate Ri in Eq. 6 was calculated. However, for the sake of simplicity, it is considered just i = Zn(OH)2(aq) since a similar procedure was followed for all other species. First of all, from Table 1, it is possible to know that species Zn(OH)2(aq) is involved just in both Reactions 3 and 4 (of such a table) and that in both of them this compound has a stoichiometric coefficient equal to one. Nonetheless, the compound appears as a product in Reaction 3 and as a reactive in reaction 4. Then, by using net reaction rates from Table 4, RZn(OH)2(aq) = r3-r4.
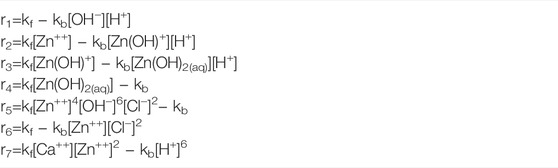
TABLE 4. Net reaction rates.
4 Results and Discussion
4.1 Corrosion Potential
In order to obtain an accurate record of the Ecorr in the early stage of zinc passivation, it was measured every 60 s, and the rate of change of potential was calculated as
Figure 3 shows the Ecorr as a function of time (Ecorr vs. time) and the rate of change of potential as a function of the corrosion potential (rcorr vs. Ecorr) for the zinc plates immersed in the two test solutions.
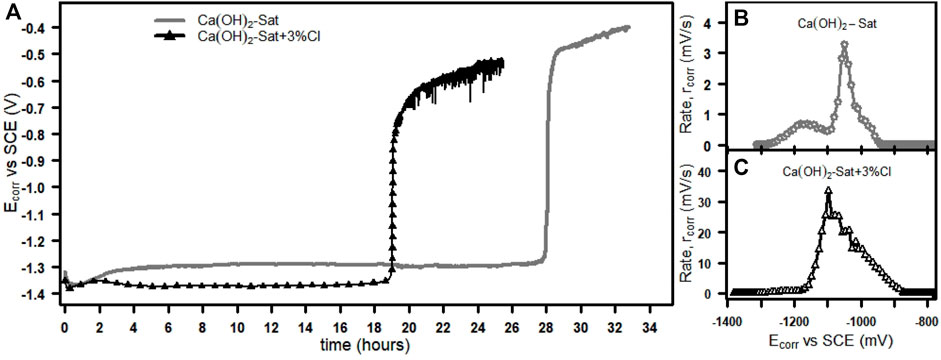
FIGURE 3. Ecorr evolution with time of (A) zinc plates in saturated Ca(OH)2 solutions with and without chlorides. (B) The rate of change of potential, rcorr vs. Ecorr, without chlorides and (C) rcorr vs. Ecorr with chlorides.
In the case of the solution without chlorides, Figure 3A shows the initial Ecorr values are below −1,300 mV; after 28 h of immersion, the Ecorr values increase rapidly from the activation state value of about −1,300 mV to a passive state potential of about −500 mV, and above −500 mV, the Ecorr rises very slowly. At this point, Ecorr = −500 mV vs. SCE; in accordance with the Pourbaix diagram for zinc (Thomas et al., 2012), zinc has a passive behavior. For the case in which the solution contains chlorides, Figure 3A also shows an analogous rise in potential, where the initial Ecorr is below -1,370 mV; after 18 h, the Ecorr changes rapidly from the activation value of about −1,370 mV to a passivation potential of about −700 mV, and beyond −700 mV, the Ecorr increases slowly. The presence of chlorides caused the onset of the sudden rise in potential to occur approximately 10 h earlier than without chlorides. After the sudden change in potential in the solution with chlorides, an intermittent variation of potential values was measured. Again at Ecorr = −700 mV, the Pourbaix diagram predicts the passive behavior of zinc and indicates a pitting potential (Epit) of about -900 mV in 0.1 M chloride environment, so an intermittent variation of Ecorr > Epit can mean the instability or breakdown of the passivating film that has just formed. The process of potential evolution can be divided into three steps. During the first step, the Ecorr has the most negative and constant value for a time until the fast rise in potential, the second step is the fast rise in potential, and finally beyond the rise in potential where the Ecorr increases slowly. The second step, the fast rise in potential, was the early stage of the zinc passivation in saturated calcium hydroxide solutions (Wilson et al., 1987; Tittarelli and Bellezze, 2010; Ghosh and Singh, 2007; Macías and Andrade, 1983).
Analyzing the second step of the Ecorr evolution, where the passivation of zinc starts, by rcorr. Figure 3B shows, for the solution without chlorides, that the rcorr is not constant and increases from about 0 mV/s at the Ecorr value of 1,300 mV to a maximum value of 3.29 mV/s at the Ecorr value of -1,049 mV. In addition, for the solution with chlorides, Figure 3C shows that the rcorr is also not constant and increases from about 0 mV/s at the Ecorr value of 1,350 mV to a maximum value of 33.37 mV/s at the Ecorr value of -1,097 mV. The maximum rcorr in the solution with chlorides was about 10 times the maximum rcorr in the solution without chlorides, which indicates that chlorides increase the rate of the fast rise of the Ecorr from active to passive state values.
Moreover, in solutions with high concentrations of Ca2+, it has been found that the potential fluctuates greatly due to the strong corrosion process and continuous passive layers composed of calcium hydroxy-zincate Ca(Zn(OH)3)2 · 2 H2O could be formed, while with the reduction of the Ca2+ concentration, the corrosion process becomes more moderate and less vigorous during the passivation process (Zheng et al., 2018b), oxygen is the fundamental oxidizing agent for the zinc passivation in saturated calcium hydroxide solutions and galvanized steel embedded in concrete (Tittarelli and Bellezze, 2010), and the present corrosion potential findings show that chlorides have also an influence on the fast zinc passivating film formation, but a fast passivation does not ensure corrosion protection by a thick passivating film. According to the point defect model for anodic films, a continuous barrier film will form on a metallic surface whenever the Ecorr is more positive than the Flade potential. Hence, the film growth results from a reaction at the metal/film interface, and thus, the potential difference at the film/solution interface is independent of the film thickness (Chao et al., 1981; Macdonald, 1992).
4.2 Anodic Polarization Curves
To confirm the effect of the rate of change of potential on the early stage of zinc passivation, anodic polarization curves were obtained at different scan rates of the zinc plates immersed in the two different test solutions. The anodic polarization curves, potential vs. logarithm of current density (E vs. log j) and current density vs. potential (j vs. E) at scan rate values of 0.5 mV/s, 0.1 mV/s, and 0.025 mV/s in the two test solutions, are shown in Figure 4.
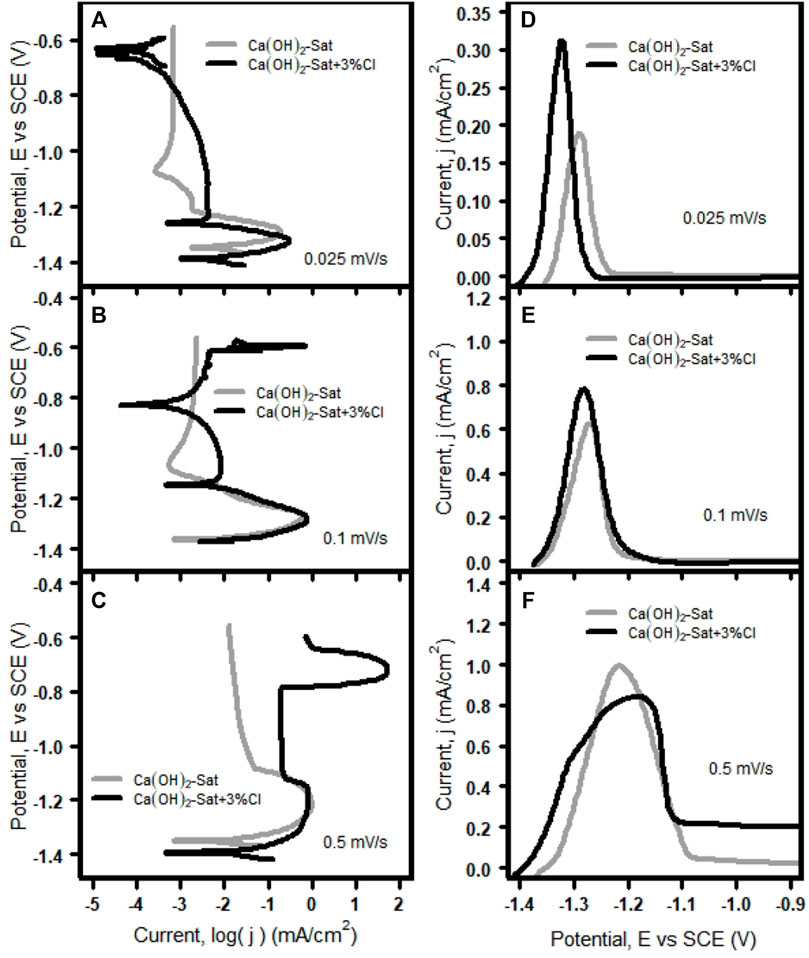
FIGURE 4. Polarization curves of zinc plates in the two test solutions: E vs. log j at (A) 0.025 mV/s, (B) 0.1 mV/s, and (C) 0.5 mV/s, and j vs. E at (D) 0.025 mV/s, (E) 0.1 mV/s, and (F) 0.5 mV/s.
Figures 4A–C show the anodic curves, E vs. log j, conducted at variable scan rates. In the active region, the anodic curves are independent of the scan rate, and there are no significant differences in the Ecorr values and in the shape of the curves. From the lowest to the highest scan rate, the region about the active–passive transition loses its nose shape, which makes it difficult to distinguish the active–passive transition at the highest scan rate (0.5 mV/s). The lowest and intermediate scan rates (0.025 mV/s and 0.1 mV/s) in the solution with chlorides, Figures 4A,B; the passive region is interrupted by that looks like two additional corrosion potentials, which are actually “cathodic loops”. These curves arise when the concentration controlled region (diffusion) of the true cathodic curve intersects the passive region of the true anodic curve (Kelly et al., 2002; Flitt and Schweinsberg, 2005).
Figures 4D–F show the anodic curves, j vs. E, conducted at variable scan rates in the two test solutions. At the lowest scan rate, Figure 4D, the current shows a maximum of 0.190 mA/cm2 at the Flade potential of −1,289 mV without chlorides, and with chlorides, the current shows a maximum current of 0.311 mA/cm2 at a Flade potential of −1,323 mV. These current peaks are symmetrical and correspond to the active–passive transition (Lorbeer and Lorenz, 1981).
At the intermediate scan rate, Figure 4E, without chlorides, the current shows a maximum of 0.628 mA/cm2 at a Flade potential of −1,269 mV, and with chlorides, the current shows a maximum of 0.784 mA/cm2 at a Flade potential of −1,280. These current peaks have values about twice higher than those at the lowest scan rate, and again these are symmetrical and correspond to the active–passive transition. At the highest scan rate, Figure 4F, the current shows a maximum of 0.993 mA/cm2 at a Flade potential of −1,216 mV without chlorides and the maximum current is 0.840 mA/cm2 at a Flade potential of −1,182 mV with chlorides. In this case, the current peak without chlorides is symmetrical and corresponds to the active–passive transition, but with chlorides, the current peak is not symmetrical, and it is lower than without chlorides; the region about the active–passive transition is not well defined, and the passivation current has a value greater than without chlorides.
It is clear that at low velocities, the current peaks in the presence of chlorides are higher than the current peak without chlorides, and this is because the presence of chlorides inhibits the formation and growth of insoluble species such as oxides/hydroxides on the Zn surface. Instead it promotes the formation of complex species, and therefore, the chloride anion increases the solubility of Zn by the diffusion of chloro-zinc species (ZnCI42-) away from the electrode surface (Zhang, 1996).
Therefore, the presence of chlorides causes instability at the interphase zinc solution during the active–passive transition due to the possible formation of an unstable intermediate (Zheng et al., 2018a; Román et al., 2014). In addition, according to these anodic polarization results, it is clear that the current peaks at the Flade potential with the increase of the scan rate and with the presence of chlorides were higher than without chlorides. This behavior indicates that faster scan rates produce higher current peaks, thus a poorer passivating film on the surface zinc plate (Pyun et al., 1994).
4.3 Electrochemical Impedance Spectroscopy
To provide information about the effect of the spontaneous rise in potential on the formation of the passivating film, EIS tests were carried out before and after the fast and sharp rise in potential. The EIS spectra for zinc plates in the two test solutions are shown in Figure 5.
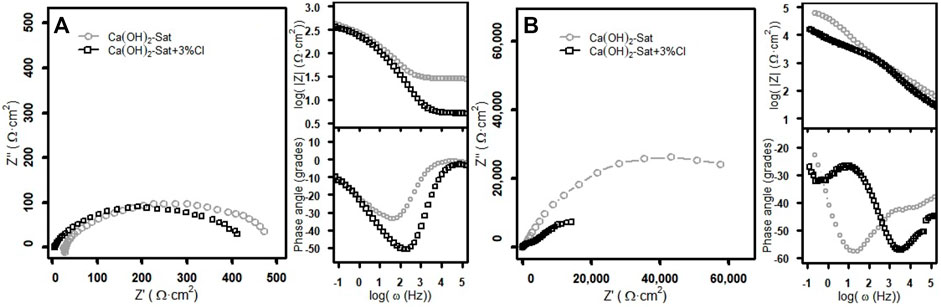
FIGURE 5. EIS spectra of zinc plates in the two test solutions: (A) before the sudden rise in the Ecorr and (B) after the sudden rise in the Ecorr.
Figure 5A shows the Nyquist and Bode spectra before the spontaneous rise in potential. The Nyquist plots for both cases, with and without chlorides, show that the semicircles are similar to each other. These depressed semicircles have approximately 500 Ω cm2 of diameter and a maximum of about 100 Ω cm2 on the imaginary impedance axis. The Bode plots of the log(|Z|) modulus show that at low frequencies, the plots join at the same log(|Z|) value of about 2.6; at middle frequencies, these plots have only one slope; and at high frequencies, the log(|Z|) value is approximately 1.5 without chlorides, and with chlorides, it is approximately 0.7.
The difference between the plots indicates the increase of the conductivity due to the presence of chlorides. The Bode plot of the phase angle without chlorides is higher than the plot with chlorides, and these plots show only a minimum phase angle value. The minimum phase angle without chlorides is −33.59o at the log(ω) value of 1.68, and with chlorides, the minimum phase angle is −50.58o at the log(ω) of 2.35.
Figure 5B shows the Nyquist and Bode spectra after the jump of potential. The Nyquist semicircle without chlorides at low frequencies has a real impedance (Z″) value of 57,651.1 Ω cm2, and the imaginary impedance (Z′) has a maximum of 26,215.7 Ω cm2. In the case of with chlorides, the Nyquist plot clearly shows two semicircles; at low frequencies, the Z” value is 14,234.1 Ω cm2 and the maximum Z’ value is 7,276.8 Ω cm2. The Nyquist semicircle without chlorides is visibly bigger than the two semicircles with chlorides.
The Bode plots of the log(|Z|) show that at low frequencies, the log(|Z|) values for the solution without chlorides are more high than with chlorides; at middle frequencies, these plots have more than one slope; and at high frequencies, again the log(|Z|) value without chlorides is higher than with chlorides; the log(|Z|) value is approximately 1.9 without chlorides, and with chlorides, it is approximately 1.6, and these values are more high than in the case before the jump of potential. The Bode plots of the phase angle after the jump of potential show that the minimum phase angle values obtained in both solutions have a similar magnitude. A similar phase angle of about −57o is observed at a log(ω) value of 1.25 in the solution without chlorides and at a log(ω) value of 3.56 in the solution with chlorides.
First, the differences in the impedance diagrams after the jump in potential may be due to the influence of the concentration of Ca2+, where the higher the concentration of Ca2+, the higher the impedance modulus; the minimum phase angle is shifted towards the low frequencies, forming a surface film with better passive properties (Zheng et al., 2018b), and second, in the presence of chlorides, the effect is the opposite, the higher the concentration of chlorides, the lower the impedance modulus, and the minimum phase angle is shifted towards the high frequencies, and thus the protective property of the passive film is reduced (Zheng et al., 2018a).
In order to obtain more detailed information of the passivating film on zinc plates before and after the jump in potential in the two test solutions, the experimental EIS spectra were fitted to equivalent circuits. Three typical equivalent circuits, the bare metal surface (Rs + CP Edl/Rct), the metal surface with a barrier film (Rs + CP Ef/Rf + CP Edl/Rct), and the metal surface with a porous barrier film (Rs + CP Ef/[Rpore + CP Edl/Rct]), were used, and these circuits are described in Zheng et al. (2018a, 2018b).
The numerical fitting of the EIS data was made using the equivalent circuits and the Randomize+ Simplex method, which was stopped at a 0.1 × 10⁻³relative error. The experimental EIS spectra with the simulation of EIS by equivalent circuits, using the values of the electrical components obtained by numerical fitting Table 5, are shown as Nyquist plots in Figure 6. It can be seen that there is a good agreement between the simulated results and the experimental data.
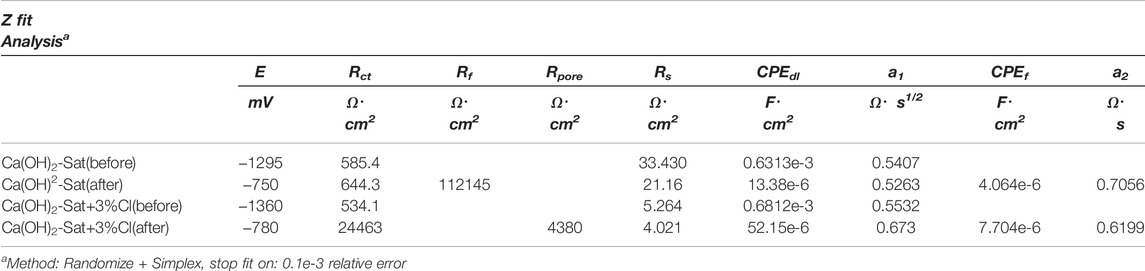
TABLE 5. Z fit analysis of the experimental EIS data of zinc plates in the two test solutions.
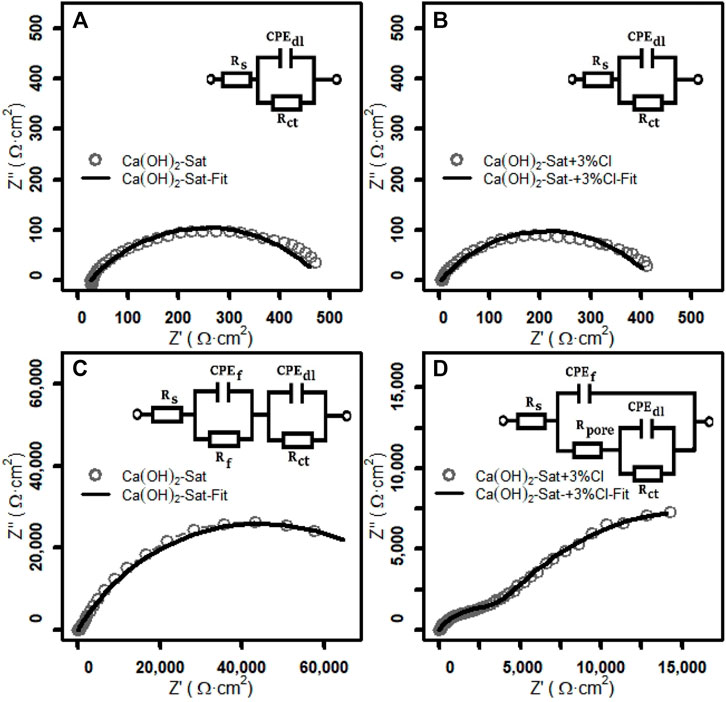
FIGURE 6. Nyquist spectrum of the Z fit analysis of zinc plates in the two test solutions: before the sudden rise in the Ecorr (A) without chlorides and (B) with chlorides, and after the sudden rise in the Ecorr (C) without chlorides and (D) with chlorides.
Considering the good agreement of the equivalent circuit simulations with the experimental data shown in Figure 6, it can be suggested that the system before the sudden increase of potential is an active bare zinc surface in the two test solutions. The system after the sudden jump of potential without chlorides is a zinc surface with a homogenous non-porous film. In addition, in the presence of chlorides, the system is a zinc surface with a porous film.
4.4 Surface Analysis
The surface morphology and chemical composition of the zinc plates immersed in the two test solutions were studied by SEM images and EDS analysis. The SEM and optical images of zinc plates immersed for 30 h in the two test solutions are shown in Figures 7B,C. On the optical images, it is possible to observe that the zinc plates are uniformly covered with a film of crystals perfectly overlapped. On SEM images, it is possible to observe for the solution without chlorides that the crystals are larger than the crystals formed in the presence of chlorides. These rhombic crystals have been identified as calcium hydroxyzincate crystals (Ca[Zn(OH)3]2 · 2 H2O) (Blanco et al., 1984), and the formation of these crystals is by surface nucleation and precipitation (Lin et al., 1995).
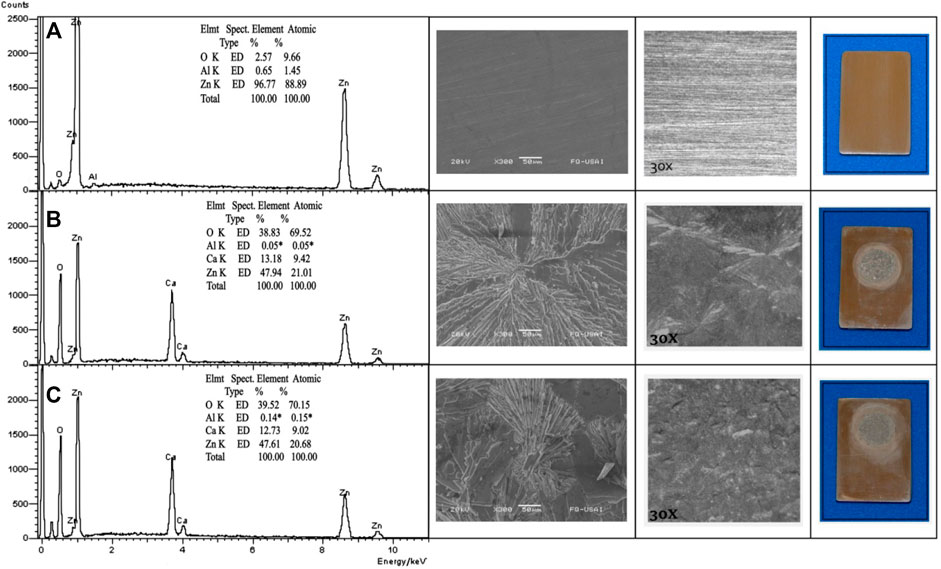
FIGURE 7. EDS Analysis and SEM micrographs (300x) of zinc plates in the two test solutions: (A) untested, (B) after 30 h without chlorides, and (C) after 30 h with chlorides.
The EDS analysis after the immersion was performed on a rhombic crystal. The spectra for the zinc plates with and without chlorides are quite similar to each other (Figures 7B,C), which have high intensity peaks of zinc, calcium, and oxygen, with elemental compositions about 47, 12, and 38%, respectively. These spectra show that at this early stage of passivation, where the passive state was just reached, no chloride peaks were detected, so the main corrosion products on the surface of the zinc plates under immersion in both test solutions are crystals of calcium hydroxi-zincate (Ca(Zn(OH)3)2 · H2O). It is expected that in environments with the presence of chlorides, simokolleite (Zn5(OH)8Cl2 · H2O) would be part of the corrosion products, but as in this case, some authors have reported that the presence of chloride is not detected in the corrosion product film at initial stages (Ghosh and Singh, 2007; Román et al., 2014). In addition, the presence of simonkolleite is considered a signal of a low pH value at the zinc/solution interface (Román et al., 2014; Bullard et al., 1997). The above is confirmed by the dependence of the formation of simonkolleite on the pH value, where the formation of simonkolleite is favored at intermediate pH values and through the reaction of either ZnO or Zn(OH)2 intermediate products (Cousy et al., 2017). However, on this film of crystals, with an extended time, in the presence of chlorides, simonkolleite (Zn5(OH)8Cl2 · H2O) and zincite (ZnO) eventually grow and become detectable, and this fact has been documented in the literature by long-term laboratory tests of specimens of zinc and galvanized steel after the pitting corrosion occurred (Belaid et al., 2000; Tittarelli and Bellezze, 2010; Zheng et al., 2018a; Román et al., 2014). In addition, in the long term, when there is no presence of chlorides, wulfingite (Zn(OH)2) and zincite (ZnO) have been identified (Hegyi et al., 2017; Pokorný et al., 2017; Pokorný et al., 2019).
The differences in the structure of the passivating film of zinc in the alkaline electrolyte can be explained by the conditions for the formation of two different types of corrosion product films. A type I film forms in the absence of convection by precipitation from a supersaturated layer of zincate near the surface. A type II film occurs by a potential-driven direct oxidation of the zinc surface (Bockelmann et al., 2017; Bockelmann et al., 2018; Powers and Breiter, 1969; Mokaddem et al., 2010). The way which the potential-dependent type II film is favored without interference from the type I involves the use of an instantaneous overpotential jump from the Ecorr value to a potential in the passivation domain greater than 0.15 V (Mokaddem et al., 2010; Powers and Breiter, 1969). Considering that the main corrosion products on the surface of the zinc plates are crystals of calcium hydroxyzincate in the two test solutions and the rapid but not instantaneous change of potential spontaneously presented by the zinc plates, it can be said that a type I film is rapidly formed by precipitation of hydroxyzincate on the Zn surface. Moreover, this jump in potential is 10 times faster in the presence of chlorides; therefore, the size and structure of the crystals presented in the SEM images, which affect the protective barrier effect of the passivating film, are mainly a consequence of how fast the Zn surface is covered by the hydroxyzincate type I film with its consequent increase of the rate of change of potential.
4.5 Modeling
Figure 8 shows numerical findings regarding the formation of Zn(OH)2, Zn5(OH)8Cl2, and CaZn2(OH)6, respectively. No ZnO was predicted under a 0.03% Cl¯ electrolyte. It is straightforward to observe that the corrosion products mainly consist of both Zn(OH)2 and CaZn2(OH)6. According to Reactions 5 and 6 in Table 1, the presence of Cl¯ ions is directly responsible for the generation of both Zn5(OH)8Cl2 and ZnO compounds. It is important to point out that the presence of ZnO is neglectable since the small quantities of simonkolleite remain stable under such conditions. However, the opposite situation is found for electrolytes with high concentration of Cl¯ ions: The simonkolleite becomes unstable, and it is finally destroyed to generate ZnO according to Reaction 6 in Table 1. Indeed, Figure 9A shows that the presence of ZnO under high Cl¯ concentrations is much more important than the corresponding presence of the simonkolleite for low Cl¯ concentrations. On the other hand, in order to appreciate the effect of Cl¯ ions on the formation of the CaZn2(OH)6 compound, Figure 9 shows the concentration of such a compound (into the Zn surface) in both concentrated and very dilute electrolytes.
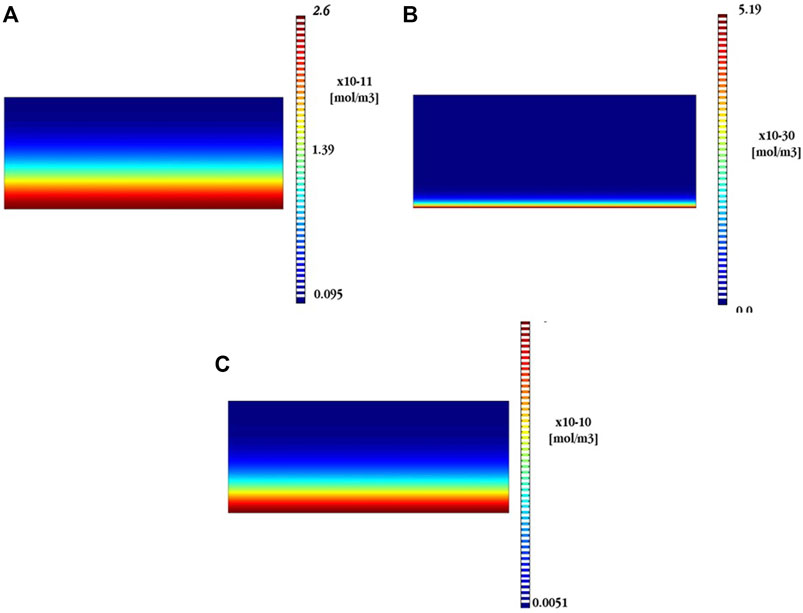
FIGURE 8. Numerical results for the generation of (A) Zn(OH)2, (B) Zn5(OH)8Cl2, and (C) CaZn2(OH)6 compounds on top of the Zn surface after 24 h in a chloride dilute electrolyte (0.03% Cl¯).
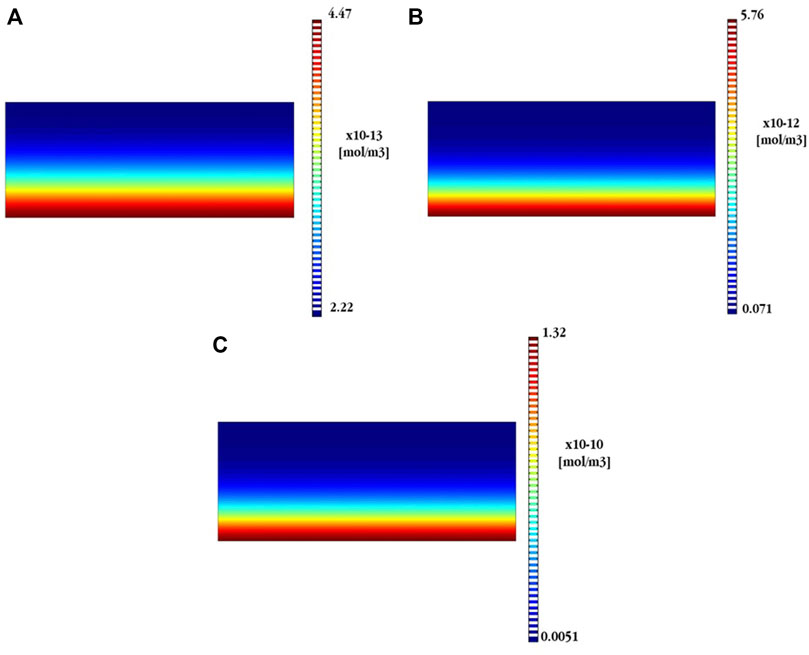
FIGURE 9. Numerical predictions, into the electrolyte, of the formation of (A) ZnO (in 3%Cl¯), (B) CaZn2(OH)6 (in 3%Cl¯), and (C)CaZn2(OH)6 (in 0.03%Cl¯).
Comparing both Figures 9B,C, it is possible to see that the presence of CaZn2(OH)6 remains important even in a concentrated electrolyte (3% Cl¯). However, it is clearly smaller, almost 100 times, than in a dilute electrolyte (0.03% Cl¯). This potentially explains the poor physical conditions of the passivating film generated on the Zn surface when Cl¯ ions are present in the electrolyte. Moreover, it should bear in mind that the concentration of Zn(OH)2 is not represented in Figure 9 since such a compound was not numerically detected under concentrated electrolytes.
In short, from the numerical point of view, the poor physical condition of the passivating film in the presence of chlorides could be the consequence of the generation of a first and stable layer of Zn(OH)2 that is partially destroyed in the presence of chlorides. In a similar way, the simonkolleite becomes unstable and almost fully transformed into ZnO in the presence of chlorides. Finally, calcium hydroxy-zincate is stable under both conditions (high and low chloride concentrations). Nonetheless, it is clearly a much more important product, present on the Zn surface, working with electrolytes with very low chloride concentration.
It is a work in progress in our research group to build up a more robust model including more chemical species (e.g., calcium and zinc complexes formed with chlorides) in order to fully confirm findings and trends presented in this section. However, the present numerical findings represent a very important progress in understanding the zinc dissolution phenomenon.
5 Conclusion
The corrosion potential of zinc, during the early hours of immersion in the saturated calcium hydroxide conditions, shows a spontaneous sudden change from the active state below −1.3 V vs. SCE to the passive state above −0.7 V vs. SCE, where the presence of chloride ions increases the rate of change of potential by 10-fold from about 3 mV/s to 33 mV/s.
Under potentiodynamic polarization of zinc, the current peaks at the active–passive transition and at the highest scan rate of 0.5 mV/s have values about twice higher than those at the lowest scan rate of 0.025 mV/s from about 0.9 mA/cm2 to 0.4 mA/cm2. The major influence of the scan rate on the current response in the active–passive transition was in the presence of chlorides.
The zinc before the spontaneous sudden increase of corrosion potential has an impedance response similar to that of an active bare zinc surface in the two test solutions; after the sudden jump of potential without chlorides, the impedance of the zinc is similar to that of a zinc surface with a homogenous non-porous corrosion product film; and in the presence of chlorides, the impedance of the zinc is similar to that of a zinc surface with a porous corrosion product film.
In this early stage of passivation, the main corrosion product, with and without chlorides, is the calcium hydroxy-zincate Ca(Zn(OH)3)2 · 2 H2O in the form of crystals; without chlorides, the crystals are larger than the crystals formed in the presence of chlorides.
Then, it can be suggested that during the early stage of zinc passivation, the porous passive-like behavior by the presence of chlorides in conjunction with the fast corrosion potential increase leads to a decrease in the protective barrier effect of the corrosion products in relation to the non-porous behavior of zinc in the solution without chlorides.
In a very similar way, and from the point of view of modeling, findings show that Cl¯ ions promote the generation of oxides (ZnO) and, at the same time, the destruction of both simonkolleite and hydroxides. On the other hand, although the calcium hydroxy-zincate was predicted as the most important compound with and without chlorides, its presence was much more important in electrolytes with very low concentration of chlorides. The present numerical findings could provide enough evidence to better understand the fast potential change during the Zn passivating film formation in the presence of Cl¯ ions. However, more chemical species should be taken into account in future numerical calculations to have overwhelming evidence.
Data Availability Statement
The raw data supporting the conclusions of this article will be made available by the authors, without undue reservation.
Author Contributions
All of the authors made substantial contributions to the manuscript and qualify for authorship, and no authors have been omitted. AG-R conducted research, compiled data, and drafted the manuscript. RM provided modeling analysis and participated in both writing and reviewing the manuscript. FR-G, GJ, and TP-L directed the research and reviewed both the manuscript and data critically.
Funding
This work has been supported thanks to a grant from Consejo Nacional de Ciencia y Tecnología, CONACYT (grant number: 167439). The UNAM-DGAPA-PAPIIT program (TA101521) has also supported this work.
Conflict of Interest
The authors declare that the research was conducted in the absence of any commercial or financial relationships that could be construed as a potential conflict of interest.
Publisher’s Note
All claims expressed in this article are solely those of the authors and do not necessarily represent those of their affiliated organizations, or those of the publisher, the editors, and the reviewers. Any product that may be evaluated in this article, or claim that may be made by its manufacturer, is not guaranteed or endorsed by the publisher.
References
Arenas, M. A., Casado, C., Nobel-Pujol, V., and Damborenea, J. d. (2006). Influence of the Conversion Coating on the Corrosion of Galvanized Reinforcing Steel. Cem. Concr. Compos. 28 (3), 267–275. doi:10.1016/j.cemconcomp.2006.01.010
Belaid, F., Arliguie, G., and Francois, R. (2000). Corrosion Products of Galvanized Rebars Embedded in Chloride Contaminated Concrete. Corrosion 56 (9), 960. doi:10.5006/1.3280600
Blanco, M. T., Andrade, C., and Macías, A. (1984). SEM Study of the Corrosion Products of Galvanized Reinforcements Immersed in Solutions in the pH Range 12·6 to 13·6. Br. Corros. J. 19 (1), 41–48. doi:10.1179/000705984798273524
Bockelmann, M., Becker, M., Reining, L., Kunz, U., and Turek, T. (2018). Passivation of Zinc Anodes in Alkaline Electrolyte: Part I. Determination of the Starting Point of Passive Film Formation. J. Electrochem. Soc. 165 (13), A3048–A3055. doi:10.1149/2.0331813jes
Bockelmann, M., Reining, L., Kunz, U., and Turek, T. (2017). Electrochemical Characterization and Mathematical Modeling of Zinc Passivation in Alkaline Solutions: A Review. Electrochimica Acta 237, 276–298. doi:10.1016/j.electacta.2017.03.143
Bullard, S. J., Covino, B. S., Holcomb, G. R., Cramer, S. D., and McGill, G. E. (1997). Bond Strength of Thermal Sprayed Zinc on Concrete during Early Electrochemical Aging. New Orleans, Louisiana: Corrosion97.
Chao, C. Y., Lin, L. F., and Macdonald, D. D. (1981). A Point Defect Model for Anodic Passive Films: I . Film Growth Kinetics. J. Electrochem. Soc. 128 (6), 1187–1194. doi:10.1149/1.2127591
Cousy, S., Gorodylova, N., Svoboda, L., and Zelenka, J. (2017). Influence of Synthesis Conditions over Simonkolleite/Zno Precipitation. Chem. Pap. 71 (12), 2325–2334. doi:10.1007/s11696-017-0226-4
Damme, S. V., Nelissen, G., Bossche, B. V. d., and Deconinck, J. (2006). Numerical Model for Predicting the Efficiency Behaviour during Pulsed Electrochemical Machining of Steel in NaNO3. J. Appl. Electrochem 36, 1–10. doi:10.1007/s10800-005-9020-z
Deconinck, D., Van Damme, S., and Deconinck, J. (2012). A Temperature Dependent Multi-Ion Model for Time Accurate Numerical Simulation of the Electrochemical Machining Process. Part I: Theoretical Basis. Electrochimica Acta 60, 321–328. doi:10.1016/j.electacta.2011.11.070
Deconinck, J. (2012). Current Distributions and Electrode Shape Changes in Electrochemical Systems, 75. Springer Science & Business Media.
Dobias, D., Pokorny, P., and Pernicova, R. (2017). Evaluation of Resistance of Intermetallic Fe-Zn Coating in the Model Environment as Concrete Pore Solution. Procedia Eng. 172, 226–231. doi:10.1016/j.proeng.2017.02.053
Dolgikh, O., Simillion, H., Lamaka, S. V., Bastos, A. C., Xue, H. B., Taryba, M. G., et al. (2019). Corrosion Protection of Steel Cut-Edges by Hot-Dip Galvanized Al (Zn, Mg) Coatings in 1 Wt% Nacl: Part II. Numerical Simulations. Mater. Corros. 70 (5), 780. doi:10.1002/maco.201810210
Farina, S. B., and Duffó, G. S. (2007). Corrosion of Zinc in Simulated Carbonated Concrete Pore Solutions. Electrochimica acta 52 (16), 5131–5139. doi:10.1016/j.electacta.2007.01.014
Flitt, H. J., and Schweinsberg, D. P. (2005). A Guide to Polarisation Curve Interpretation: Deconstruction of Experimental Curves Typical of the Fe/H2O/H+/O2 Corrosion System. Corros. Sci. 47 (9), 2125–2156. doi:10.1016/j.corsci.2004.10.002
Ghosh, R., and Singh, D. (2007). Kinetics, Mechanism and Characterisation of Passive Film Formed on Hot Dip Galvanized Coating Exposed in Simulated Concrete Pore Solution. Surf. Coatings Technol. 201 (16-17), 7346–7359. doi:10.1016/j.surfcoat.2007.01.048
González, J. A., and Andrade, C. (1982). Effect of Carbonation, Chlorides and Relative Ambient Humidity on the Corrosion of Galvanized Rebars Embedded in Concrete. Br. Corros. J. 17 (1), 21–28. doi:10.1179/000705982798274589
Hegyi, A., Dico, C., Constantinescu, H., and Baeră, C. (2017). Influence of Hot-Dip Galvanizing of Reinforcement on the Kinetics and Thermodynamics of Corrosion Process in Concrete. Procedia Eng. 181, 226–233. doi:10.1016/j.proeng.2017.02.380
Heusler, K. E., Landolt, D., and Trasatti, S. (1990). Electrochemical Corrosion Nomenclature (Recommendations 1988). Electrochimica Acta 35 (1), 295–298. doi:10.1016/0013-4686(90)85074-w
Hung, G. W., and Dinius, R. H. (1972). Diffusivity of Oxygen in Electrolyte Solutions. J. Chem. Eng. Data 17, 449–451. doi:10.1021/je60055a001
Kelly, R., Scully, J., Shoesmith, D., and Buchheit, R. (2002). Electrochemical Techniques in Corrosion Science and Engineering, Corrosion Technology. New York, NY: CRC Press.
Lin, T.-C., Mollah, M. Y. A., Vempati, R. K., and Cocke, D. L. (1995). Synthesis and Characterization of Calcium Hydroxyzincate Using X-Ray Diffraction, Ft-Ir Spectroscopy, and Scanning Force Microscopy. Chem. Mat. 7 (10), 1974–1978. doi:10.1021/cm00058a031
Lohrengel, M. M., Klüppel, I., Rosenkranz, C., Bettermann, H., and Schultze, J. W. (2003). Microscopic Investigations of Electrochemical Machining of Fe in NaNO3. Electrochimica Acta 48, 3203–3211. doi:10.1016/S0013-4686(03)00372-4
Lorbeer, P., and Lorenz, W. J. (1981). A Critical Consideration of the Flade Potential. Corros. Sci. 21 (1), 79–86. doi:10.1016/0010-938x(81)90066-4
Macdonald, D. D. (1992). The Point Defect Model for the Passive State. J. Electrochem. Soc. 139 (12), 3434–3449. doi:10.1149/1.2069096
Macías, A., and Andrade, C. (1987). Corrosion of Galvanized Steel in Dilute Ca(OH)2 solutions (pH 11·1-12·6). Br. Corros. J. 22 (3), 162–171. doi:10.1179/000705987798271505
Macías, A., and Andrade, C. (1987). Corrosion of Galvanized Steel Reinforcements in Alkaline Solutions: Part 1: Electrochemical Results. Br. Corros. J. 22 (2), 113–118. doi:10.1179/000705987798271631
Macías, A., and Andrade, C. (1983). Corrosion Rate of Galvanized Steel Immersed in Saturated Solutions of Ca(OH)2 in the pH Range 12-13 · 8. Br. Corros. J. 18 (2), 82–87. doi:10.1179/bcj.1983.18.2.82
Macías, A., and Andrade, C. (1990). The Behaviour of Galvanized Steel in Chloride-Containing Alkaline Solutions-I. The Influence of the Cation. Corros. Sci. 30 (4-5), 393–407. doi:10.1016/0010-938x(90)90046-8
Marder, A. R. (2000). The Metallurgy of Zinc-Coated Steel. Prog. Mater. Sci. 45 (3), 191–271. doi:10.1016/s0079-6425(98)00006-1
Mokaddem, M., Volovitch, P., and Ogle, K. (2010). The Anodic Dissolution of Zinc and Zinc Alloys in Alkaline Solution. I. Oxide Formation on Electrogalvanized Steel. Electrochimica Acta 55 (27), 7867–7875. doi:10.1016/j.electacta.2010.02.020
Montoya, R., Ruiz-García, A. G., Ortiz-Ozuna, A., Ramírez-Barat, B., and Genesca, J. (2021). Acidification of the Electrolyte during the Galvanic Corrosion of AA7075: A Numerical and Experimental Study, Materials and Corrosion. doi:10.1002/maco.202012274
Pernicova, R., Dobias, D., and Pokorny, P. (2017). Problems Connected with Use of Hot-Dip Galvanized Reinforcement in Concrete Elements. Procedia Eng. 172, 859–866. doi:10.1016/j.proeng.2017.02.086
Pokorný, P., Kouřil, M., and Kučera, V. (2019). Kinetics of Zinc Corrosion in Concrete as a Function of Water and Oxygen Availability. Materials 12 (17), 2786. doi:10.3390/ma12172786
Pokorný, P., Tej, P., and Kouřil, M. (2017). Evaluation of the Impact of Corrosion of Hot-Dip Galvanized Reinforcement on Bond Strength with Concrete - A Review. Constr. Build. Mater. 132, 271–289. doi:10.1016/j.conbuildmat.2016.11.096
Powers, R. W., and Breiter, M. W. (1969). The Anodic Dissolution and Passivation of Zinc in Concentrated Potassium Hydroxide Solutions. J. Electrochem. Soc. 116 (6), 719. doi:10.1149/1.2412040
Pyun, S.-I., Bae, J.-S., Park, S.-Y., Kim, J.-S., and Lee, Z.-H. (1994). The Anodic Behaviour of Hot-Galvanized Zinc Layer in Alkaline Solution. Corros. Sci. 36 (5), 827–835. doi:10.1016/0010-938x(94)90173-2
Räsänen, V., and Penttala, V. (2004). The pH Measurement of Concrete and Smoothing Mortar Using a Concrete Powder Suspension. Cem. Concr. Res. 34 (5), 813–820. doi:10.1016/j.cemconres.2003.09.017
Román, J., Vera, R., Bagnara, M., Carvajal, A. M., and Aperador, W. (2014). Effect of Chloride Ions on the Corrosion of Galvanized Steel Embedded in Concrete Prepared with Cements of Different Composition. Int. J. Electrochem. Sci. 9 (2), 580
Sahoo, G., and Balasubramaniam, R. (2008). On the Corrosion Behaviour of Phosphoric Irons in Simulated Concrete Pore Solution. Corros. Sci. 50 (1), 131–143. doi:10.1016/j.corsci.2007.06.017
Simillion, H., Dolgikh, O., Terryn, H., and Deconinck, J. (2014). Atmospheric Corrosion Modeling. Corros. Rev. 32, 73–100. doi:10.1515/corrrev-2014-0023
Simillion, H., Van den Steen, N., Terryn, H., and Deconinck, J. (2016). Geometry Influence on Corrosion in Dynamic Thin Film Electrolytes. Electrochimica Acta 209, 149–158. doi:10.1016/j.electacta.2016.04.072
Struble, L. J., States., U., and University, P. (1987). The Influence of Cement Pore Solution on Alkali-Silica Reaction [microform]/L.J. Struble. Gaithersburg, MD: U.S. Dept. of CommerceNational Bureau of Standards.
Tan, Z. Q., and Hansson, C. M. (2008). Effect of Surface Condition on the Initial Corrosion of Galvanized Reinforcing Steel Embedded in Concrete. Corros. Sci. 50 (9), 2512–2522. doi:10.1016/j.corsci.2008.06.035
Thébault, F., Vuillemin, B., Oltra, R., Allely, C., and Ogle, K. (2011). Modeling Bimetallic Corrosion under Thin Electrolyte Films. Corros. Sci. 53 (1), 201–207. doi:10.1016/j.corsci.2010.09.010
Thomas, S., Birbilis, N., Venkatraman, M. S., and Cole, I. S. (2012). Corrosion of Zinc as a Function of pH. Corrosion 68 (1), 1. doi:10.5006/1.3676630
Tittarelli, F., and Bellezze, T. (2010). Investigation of the Major Reduction Reaction Occurring during the Passivation of Galvanized Steel Rebars. Corros. Sci. 52 (3), 978–983. doi:10.1016/j.corsci.2009.11.021
Vera, R., Venegas, R., Carvajal, A. M., Corvo, F., and Pérez, T. (2012). Performance of Carbon Steel and Galvanized Steel in Reinforced Concrete Structures after Accelerated Carbonation. Int. J. Electrochem. Sci. 7 (11), 10722
Videm, K. (2007). “Corrosion and Electrochemistry of Zinc in Alkaline Solutions and in Cement Mortar,” in Corrosion of Reinforcement in Concrete, European Federation of Corrosion (EFC) Series. Editor M. Raupach (Woodhead Publishing), 10–26. doi:10.1533/9781845692285.10
Wilson, A., Nicholson, J., and Prosser, H. (1987). Surface Coatings—2, Surface Coatings. Springer Netherlands.
Yadav, A. P., Nishikata, A., and Tsuru, T. (2004). Degradation Mechanism of Galvanized Steel in Wet-Dry Cyclic Environment Containing Chloride Ions. Corros. Sci. 46 (2), 361–376. doi:10.1016/s0010-938x(03)00153-7
Yeomans, S. R. (1995). Coated Steel Reinforcement for Corrosion Protection in Concrete. HKIE Trans. 2 (2), 17–28. doi:10.1080/1023697x.1995.10667682
Zhang, X. G. (1996). Corrosion and Electrochemistry of Zinc. Plenum Press, New York, NY: Springer Science & Business Media.
Zhang, Y., and Muhammed, M. (2001). Critical Evaluation of Thermodynamics of Complex Formation of Metal Ions in Aqueous Solutions. Hydrometallurgy 60 (3), 215–236. doi:10.1016/s0304-386x(01)00148-7
Zheng, H., Dai, J.-G., Li, W., and Poon, C. S. (2018). Influence of Chloride Ion on Depassivation of Passive Film on Galvanized Steel Bars in Concrete Pore Solution. Constr. Build. Mater. 166, 572–580. doi:10.1016/j.conbuildmat.2018.01.174
Zheng, H., Dai, J.-G., Poon, C. S., and Li, W. (2018). Influence of Calcium Ion in Concrete Pore Solution on the Passivation of Galvanized Steel Bars. Cem. Concr. Res. 108, 46–58. doi:10.1016/j.cemconres.2018.03.001
Keywords: EIS, galvanized, concrete, zinc passivation, fast potential change, modeling
Citation: Garnica-Rodríguez A, Montoya R, Rodríguez-Gomez FJ, Pérez-López T and Genesca J (2022) Effect of a Fast Potential Change on the Early Stage of Zinc Passivation in a Saturated Calcium Hydroxide Solution. Front. Mater. 9:877728. doi: 10.3389/fmats.2022.877728
Received: 17 February 2022; Accepted: 05 May 2022;
Published: 24 June 2022.
Edited by:
David M. Bastidas, University of Akron, United StatesReviewed by:
Idalina Vieira Aoki, University of São Paulo, BrazilQing-feng Liu, Shanghai Jiao Tong University, China
Copyright © 2022 Garnica-Rodríguez, Montoya, Rodríguez-Gomez, Pérez-López and Genesca. This is an open-access article distributed under the terms of the Creative Commons Attribution License (CC BY). The use, distribution or reproduction in other forums is permitted, provided the original author(s) and the copyright owner(s) are credited and that the original publication in this journal is cited, in accordance with accepted academic practice. No use, distribution or reproduction is permitted which does not comply with these terms.
*Correspondence: R. Montoya, cm1vbnRveWFsQHVuYW0ubXg=