 Jaemin Lee
 Seunghwa Ryu
- Department of Mechanical Engineering, Korea Advanced Institute of Science and Technology (KAIST), Daejeon, South Korea
Plastic deformation of metallic glasses, which show no long-range structural order, proceeds by shear transformation of a local group of atoms referred to as the shear transformation zone (STZ). Unlike crystalline solids, it is difficult to identify STZs and predict the onset of plasticity from a random atomic configuration under a given loading. Recently, significant efforts have been made to predict the shear transformation with initial atomic properties using machine learning. However, despite the class imbalance, where the atoms participating in shear transformation is much rarer compared to the others, few studies have explored the issue of the proper predictive metric choice, with most studies considering widely used metrics such as Recall or AUC in the machine learning community. Therefore, here we train a graph neural network that predicts the initially activated STZ and evaluate its predictive power using various metrics considered to be proper for handling imbalanced datasets. We find that the AUC value is significantly overestimated due to the class imbalance and too many atoms are misclassified as initial STZ, so other metrics such as the precision, f1, MCC, and AP indicate very low predictive power close to zero. Additionally, we reveal that the predictive performance changes significantly over the threshold value of non-affine displacement, above which an atom is classified as the initially activated STZ, due to the change in the degree of class imbalance. Our study implies that it is crucial to use an identical threshold for this type of classification (i.e., the class ratio) for a fair assessment of ML models adapted in different studies and to holistically evaluate the predictive performance based on various metrics.
Introduction
Despite the superior elastic limit and strength exceeding their crystalline counterparts, the application area of metallic glasses has been limited due to catastrophic failures via the formation of shear bands (Spaepen, 1977; Cheng and Ma, 2011; Wang, 2012; Greer et al., 2013). The sites of potential shear transformations are referred to as shear transformation zones (STZs) and are defined by the presence of defects in amorphous solids (Argon, 1979; Argon and Shi, 1983; Schuh et al., 2007; Homer and Schuh, 2009; Falk and Langer, 2011; Hufnagel et al., 2016). Despite long efforts over a few decades to deepen our understanding of plastic deformation, it remains difficult to relate the strength and ductility of metallic glasses to well-defined short- or medium-range orders in metallic glasses. It has been revealed that several atomic properties, such as the Cu-centered icosahedral structure, an atomic-level modulus, and the participation fraction of low-frequency vibrational modes are related to the activation of a STZ (Cheng et al., 2008; Ding et al., 2014; Barbot et al., 2018; Xu et al., 2018; Schwartzman-Nowik et al., 2019; Xu et al., 2021) to some extent. Also, it was reported that the correlation between these atomic properties and STZ activation is highest in initially activated STZ and gradually decreases with the applied strain (Patinet et al., 2016). However, the existing studies discuss the correlations among the aforementioned atomic features and STZ sites without providing definitive prediction accuracy.
Recently, the advancement of machine learning (ML) algorithms for handling various complex problems with nonlinearity or high dimensionality (Harrington et al., 2019; Tian et al., 2020) has led to STZ prediction studies based on ML algorithms, starting with Cubuk’s pioneering study which defined “softness” using a support vector machine with the geometric features of atoms (Cubuk et al., 2015). In this line of studies, the predictive performance of a trained ML model was evaluated by metrics such as the AUC (area under the curve) of ROC (receiver operating characteristic) curve or with a probability plot associated with recall (Schoenholz et al., 2016; Cubuk et al., 2017; Wang and Jain, 2019; Wang et al., 2020). Unfortunately, STZ prediction is a classification problem with an inherently large class imbalance because a very small fraction of atoms undergoes shear transformation, whereas AUC and recall are known to be inadequate if used to evaluate the ML model in the presence of a large class imbalance (Davis and Goadrich, 2006; Lobo et al., 2008). For example, when evaluating the performance of a test kit for the COVID-19 virus for 1,000 people with 990 normal and 10 positive cases (i.e., a class ratio of 99:1), a test kit correctly classifying all ten patients but incorrectly classifying 90 normal cases as positive will have the recall of 100%. In contrast, the precision, which is the ratio of actual positive cases among those predicted to positive, becomes 10%. Therefore, in most class-imbalance classification problems, various complementary metrics, such as precision, the f1-score, the Matthews correlation coefficient, and AP (average precision) as well as recall and AUC are used for performance evaluations of ML models (Davis and Goadrich, 2006; Boughorbel et al., 2017; Johnson and Khoshgoftaar, 2019; Chicco and Jurman, 2020).
In this paper, therefore, we predict the initially shear transformed atoms for the
Methods
Molecular dynamics simulation and atom labelling
A schematic diagram of the overall procedure for predicting shear transformed atoms is shown in Figure 1. First, a
where
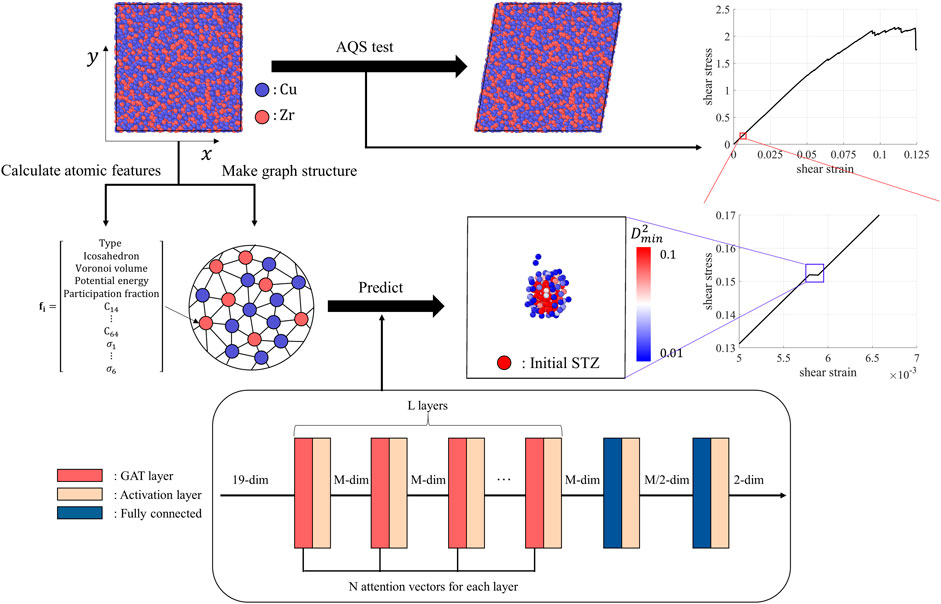
FIGURE 1. Schematic diagram of the overall procedure for predicting shear transformed atoms. We conducted an AQS (athermal quasi-static shear) test of six different directions with 75 different
Atomic features
Next, for the initial state before applying shear deformation, the atomic properties of each atom were calculated and assigned as a feature vector,
Machine learning algorithm and evaluation metrics
As a machine learning model for predicting the initial STZ activation, a graph attention network (GAT) was selected to account for the features of surrounding atoms efficiently. In each layer of GNN, the feature vectors of neighbor nodes are aggregated and multiplied by a trainable weight matrix. Therefore, as the number of layers increases, the features of farther atoms can be aggregated. Through this, medium-range features, which are known to be important in predicting STZ, can be applied. Also, Unlike a graph convolutional network (GCN), which aggregates feature vectors of neighboring nodes equally, the GAT shows better performance because it performs a weighted sum using trainable attention vectors (Veličković et al., 2017). In terms of the architecture, like most graph neural network structures, fully connected layers were combined after several GAT layers, and Mish was used as an activation function (Misra, 2019). In addition, because the performance of a neural network changes greatly according to the structure of the network or the hyperparameters, the number of GAT layers (L: [2,4,6,8,10,12]), the output dimension of each layer (M: [10, 15, 20,25, 30, 35,40]), and the number of attention vectors (N: [6, 9, 12, 15]) are optimized by means of grid search and four-fold cross-validation. In addition, in order to prevent the model from being biased toward the major class during training due to the class imbalance, the weighted cross-entropy is used as a loss function.
Finally, unlike previous studies, the predictive power of the trained machine learning model is measured with the six evaluation metrics of recall, precision, the F1 score, the Matthews correlation coefficient (MCC), AUC-ROC and the average precision (AP). The test dataset was evaluated by the trained model and the results were classified as true positives (TP, true: label 1 and predict: label 1), false positives (FP, true: label 0 and predict: label 1), false negatives (FN, true: label 1 and predict: label 0), and true negatives (TN, true: label 0, predict: label 0). With these values, recall
Results and discussion
The evaluation of model performance using various metrics
The performance of the model was evaluated with the six metrics of recall, precision, the f1-score, the Matthews correlation coefficient (MCC), AUC-ROC, and the average precision of the precision-recall curve (AP). The reference value,
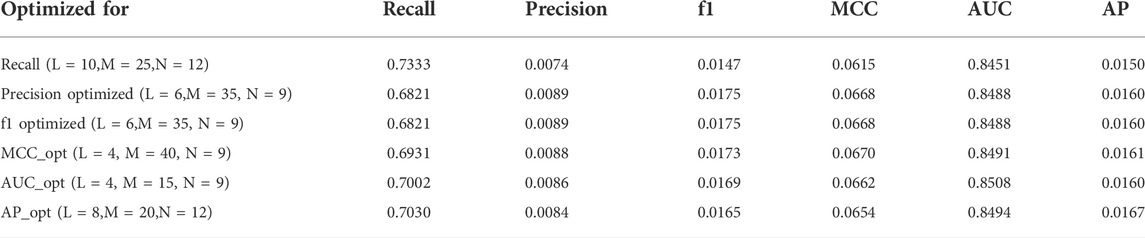
TABLE 1. Hyperparameter optimization results. The columns of the table are the values of each metric for an imbalanced dataset. The rows are the metrics used for optimization and the corresponding optimized hyperparameters. A
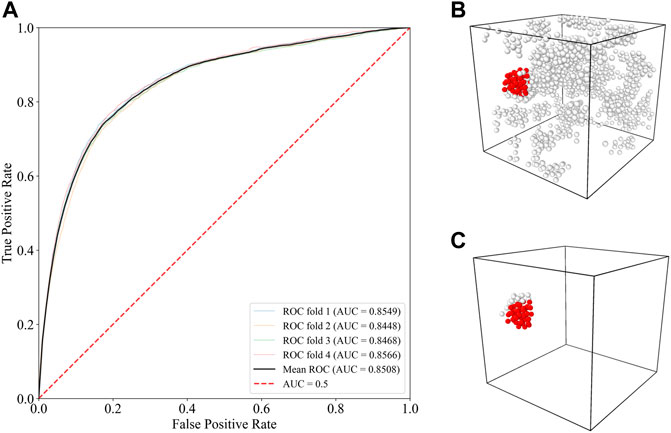
FIGURE 2. Prediction results of the machine learning model: (A) The receiver operating characteristic (ROC) curve of the test specimens. (B) The predicted shear transformed atoms which the model classified as label 1. The red atoms are true positive atoms and the white atoms are the atoms predicted as label 1 but that are actually label 0. (C) The true shear transformed atoms which we labeled as 1. The red atoms are both true and correctly predicted (true positive atoms) and the white atoms are shear transformed atoms that the model incorrectly classified as label 0.
To better understand the prediction results, we plotted the ROC curve of the test dataset and visualized the true and predicted STZ atoms in a supercell, as shown in Figure 2. Figure 2B visualizes all atoms predicted as STZ atoms, while the true STZ atoms among them are shown in red. In Figure 2C, all true STZ atoms are shown, while the correctly predicted STZ atoms among them are shown in red. Our results indicate that a large proportion of true STZ atoms are correctly predicted as STZs, whereas only a small portion of the predicted STZ atoms are true STZ atoms. More quantitatively, for the classification task of our test dataset atoms, true positives (TP) numbered 1,134, false positives (FP) amounted to 126,180, false negatives (FN) numbered 486, and true negatives (TN) amounted to 772,200. Because the number of false positives (FP), referring to the number of erroneous predictions of normal atoms as STZ atoms, was very high, the precision score, which is the ratio of the true STZ atoms among the predicted STZ atoms, was significantly low. Therefore, even if the AUC is relatively high at 0.85, it may have been overestimated due to the class imbalance, and various metrics such as precision must be considered together to assess the predictive power of a ML model fairly.
Correlation between non-affine displacement field and prediction confidence of machine learning model
As shown in Figure 3A, the prediction results were also evaluated with a probability plot while varying the non-affine displacement value. In many existing studies, the validity of machine learning models was evaluated with this plot, although only the recall of atoms with a specific non-affine displacement value can be assessed. As the non-affine displacement increases, the accuracy of the trained model (evaluated only with the recall metric) converges to a value over 70%, but approximately 20% of the atoms with low non-affine displacement are incorrectly predicted as STZs. However, as shown in Figure 3B, with an increase in the non-affine displacement value, the number of atoms undergoing that amount of non-affine displacement exponentially decreases. Hence, the probability plot indicates that very few of predicted STZ atoms are true STZ.
FIGURE 3. Correlation between non-affine displacement and the probability that the model classifies atoms of specific non-affine displacements as STZ: (A) the x-axis is the non-affine displacement of atoms and the y-axis is the probability (ratio) that the trained model classifies atoms with a corresponding non-affine displacement value as STZ atoms. (B) Histogram of non-affine displacement values (normalized as the probability density function). (C) The figure on the left is the true STZ atoms and the corresponding non-affine displacement values. A cross-section view at a constant z value is displayed in 2D in the figure on the right. (D) The figure on the left shows the predicted STZ atoms and the probability that the model predicted them as STZ atoms (i.e., confidence). Also, the cross-section view at the same z value in (C) is displayed in 2D on the right.
However, the fact that the model more correctly classifies atoms with large non-affine displacement has certain implications. Figure 3C shows a true STZ cluster and its cross-section view, and the non-affine displacement value of each atom is expressed in color. It can be seen that in a STZ cluster, atoms located at the center tend to have a larger non-affine displacement value. Also, Figure 3D shows atoms classified as STZs by our ML model for the same specimen shown in Figure 3C; the figure on the right is a cross-section at the same height (i.e., an identical z value) as that shown in Figure 3C. In Figure 3D, the confidence (probability that the model classifies the atom as STZ) is shown in color. We note that the probability in Figure 3D differs from that in Figure 3A. Probability (ratio) in Figure 3A refers to the proportion of atoms classified as STZ atoms by the model among atoms with a specific non-affine displacement value. On the other hand, the confidence in Figure 3C is the ‘probability that an atom is STZ’ obtained by the softmax function in the last layer of the ML model, and if the confidence is 0.5 or more, the model determines that the atom is STZ.
As mentioned above, the model misclassifies too many normal atoms as STZ atoms. However, in clusters predicted as STZ, it can be seen that the atom located at the center has a higher probability value, which means that the model classified central atoms with greater confidence. Not only for true STZ atoms but also the incorrectly classified STZ clusters, the confidence level is higher for atoms located closer to the center of each cluster. Hence, we can conclude that the ML model learned some characteristics of the STZ cluster, i.e., that the non-affine displacement is larger towards the center. It is plausible that incorrectly classified STZ clusters may undergo shear transformation under greater shear strain. However, even if this is the case, because we only learn and evaluate the ML model with the initially activated STZs, those must be counted as false prediction cases. Additionally, most atomic features used in the present study have scalar values, and it can be inherently difficult to predict STZs that occur in different patterns under different shear strain directions for an identical specimen.
The effect of
Additionally, we trained the GAT model while varying the threshold value of the non-affine displacement and evaluated its predictive power with six different metrics. The non-affine displacement of an atom is a value indicating how inhomogeneously the atom is displaced relative to its neighbor, and its distribution is a monotonically decaying function with a long tail. Because there is no abrupt change in the histogram, existing studies chose a certain threshold value above which the recall of the ML model converges (Cubuk et al., 2015) or an arbitrary threshold value (Wang and Jain, 2019). However, as discussed earlier, the performance of the classification model for class imbalance problem cannot be assessed by a single metric; therefore we ran the evaluation with all six metrics, as depicted in Figure 4.
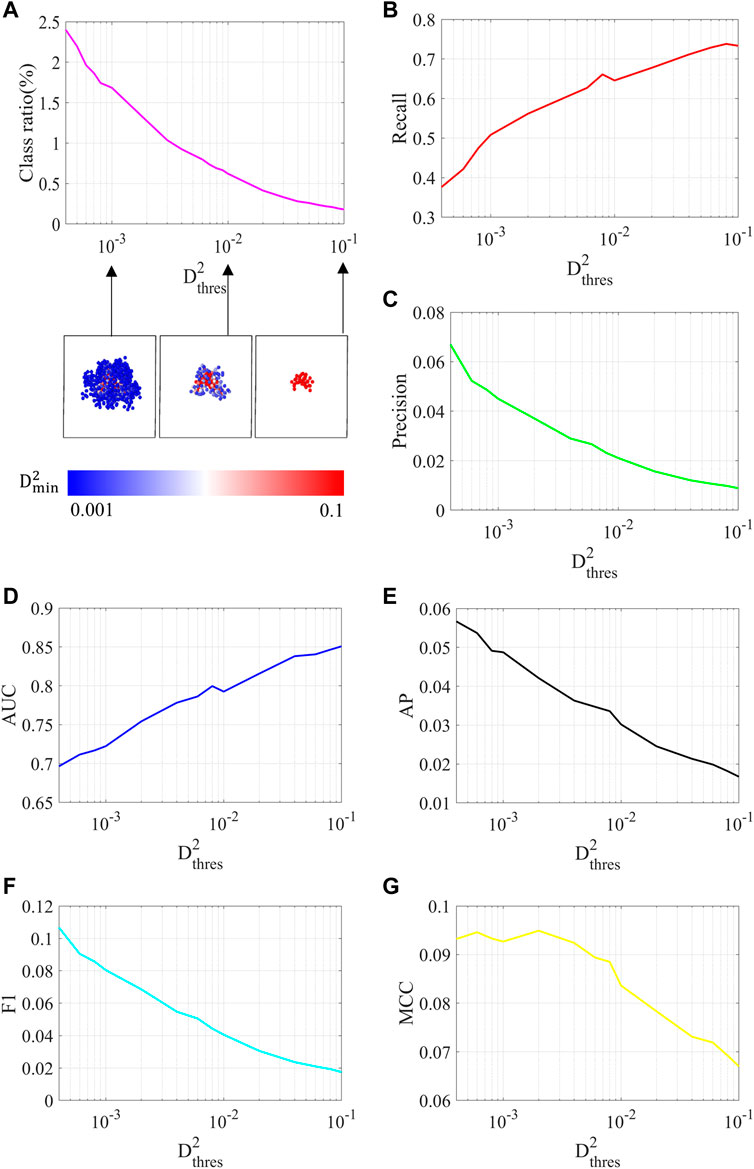
FIGURE 4. For various non-affine displacement threshold values, the (A) class ratio, (B) recall, (C) precision, (D) AUC, (E) AP, (F) f1, and (G) MCC are plotted.
Figure 4A shows the class ratio, the ratio of STZ atoms to normal atoms as a function of the threshold value. Because the non-affine displacement value increases as an atom is located closer to the core of a STZ cluster, the class ratio decreases quickly with an increase of the threshold. Hence, all metrics change dramatically with a change of the threshold value (Figures 4B–G). As the threshold increases, recall and AUC increase, whereas precision, F1, and AP decrease. We note that although AUC is often used as a metric in many existing studies (Wang and Jain, 2019; Wang et al., 2020), it is questionable if AUC can serve as a reasonable metric, as it changes from 0.7 to 0.85 (note that this is a dramatic change, considering its bound of [0.5, 1]) with an adjustment of the threshold. Interestingly, MCC shows a maximum at an intermediate value of the threshold, which appears properly to reflect the increase in the recall and the decrease in the precision with a change of the threshold. Unlike AUC, which overestimates the model’s performance with a decrease of the class ratio, MCC reflects the limited predictive power of our GAT model and can be considered as a more comprehensive and proper metric. Our results imply that the performance of a ML model must be analyzed with various metrics to account for the class imbalance.
Conclusion
In this paper, we trained a GAT model to predict STZ atoms with various atomic features and evaluated its performance with various metrics for the class imbalance problem. Although the trained GAT model shows a superior AUC value, other metrics are found to be close to zero, which indicates that the actual predictive power of the model is very limited. We find that although our model was able to learn several features of STZ clusters, such as ‘higher non-affine displacement for atoms closer to the core of a STZ cluster’, it predicts too many false positives; i.e., too many predicted STZ atoms turn out to be normal atoms. It is well known that similar limitations exist for ML models trained for classification tasks of datasets with high levels of class imbalance in general. Our study implies that the class imbalance problem can serve as a fundamental barrier preventing realistic predictions of the onset of plasticity in metallic glasses and that a multifaceted analysis is thus required when assessing the performance of a ML model for STZ predictions. In the future, we plan to apply more strategies for overcoming the class imbalance, such as under-sampling the major class, over-sampling the minor class, and using focal loss. Additionally, we note that the large class imbalance does not always causes a challenge in the classification task if a distinguishable feature exists as in the case of defects in the crystalline solids. A recent paper (Yang et al., 2021) reported that the STZ formation may be associated with thermodynamic feature beyond the structural origin considered here. Likewise, it is expected that the performance of prediction model will significantly improve as features associated with the shear transformation are developed through the constant efforts of the material science community.
Data availability statement
The raw data supporting the conclusions of this article will be made available by the authors, without undue reservation.
Author contributions
JL conducted the research under the guidance of SR. JL and SR contributed to the results analysis, and wrote the manuscript.
Funding
This work is supported by the KAIST funded Global Singularity Research Program for 2022 under award number 1711100689, Nanomedical Devices Development Project of NNFC in 2022, and the National Research Foundation of Korea under award number 2021M3E5E3080379.
Acknowledgments
The authors thank Sunghwan Kim for his assistance with molecular dynamics simulation
Conflict of interest
The authors declare that the research was conducted in the absence of any commercial or financial relationships that could be construed as a potential conflict of interest.
Publisher’s note
All claims expressed in this article are solely those of the authors and do not necessarily represent those of their affiliated organizations, or those of the publisher, the editors and the reviewers. Any product that may be evaluated in this article, or claim that may be made by its manufacturer, is not guaranteed or endorsed by the publisher.
References
Argon, A. (1979). Plastic deformation in metallic glasses. Acta metall. 27, 47–58. doi:10.1016/0001-6160(79)90055-5
Argon, A., and Shi, L. T. (1983). Development of visco-plastic deformation in metallic glasses. Acta Metall. 31, 499–507. doi:10.1016/0001-6160(83)90038-x
Barbot, A., Lerbinger, M., Hernandez-Garcia, A., García-García, R., Falk, M. L., Vandembroucq, D., et al. (2018). Local yield stress statistics in model amorphous solids. Phys. Rev. E 97, 033001. doi:10.1103/physreve.97.033001
Boughorbel, S., Jarray, F., and El-Anbari, M. (2017). Optimal classifier for imbalanced data using Matthews Correlation Coefficient metric. PloS one 12, e0177678. doi:10.1371/journal.pone.0177678
Cheng, Y., Cao, A. J., Sheng, H., and Ma, E. (2008). Local order influences initiation of plastic flow in metallic glass: Effects of alloy composition and sample cooling history. Acta Mater. 56, 5263–5275. doi:10.1016/j.actamat.2008.07.011
Cheng, Y., and Ma, E. (2011). Atomic-level structure and structure–property relationship in metallic glasses. Prog. Mater. Sci. 56, 379–473. doi:10.1016/j.pmatsci.2010.12.002
Cheng, Y., Ma, E., and Sheng, H. (2009). Atomic level structure in multicomponent bulk metallic glass. Phys. Rev. Lett. 102, 245501. doi:10.1103/physrevlett.102.245501
Chicco, D., and Jurman, G. (2020). The advantages of the Matthews correlation coefficient (MCC) over F1 score and accuracy in binary classification evaluation. BMC genomics 21, 6. doi:10.1186/s12864-019-6413-7
Cubuk, E. D., Ivancic, R., Schoenholz, S. S., Strickland, D., Basu, A., Davidson, Z., et al. (2017). Structure-property relationships from universal signatures of plasticity in disordered solids. Science 358, 1033–1037. doi:10.1126/science.aai8830
Cubuk, E. D., Schoenholz, S. S., Rieser, J. M., Malone, B. D., Rottler, J., Durian, D. J., et al. (2015). Identifying structural flow defects in disordered solids using machine-learning methods. Phys. Rev. Lett. 114, 108001. doi:10.1103/physrevlett.114.108001
Davis, J., and Goadrich, M. (2006). “The relationship between Precision-Recall and ROC curves,” in Proceedings of the 23rd international conference on Machine learning), 233–240.
Ding, J. (2014). Local structure and structural signature underlying properties in metallic glasses and supercooled liquids. Baltimore: Johns Hopkins University.
Ding, J., Patinet, S., Falk, M. L., Cheng, Y., and Ma, E. (2014). Soft spots and their structural signature in a metallic glass. Proc. Natl. Acad. Sci. U. S. A. 111, 14052–14056. doi:10.1073/pnas.1412095111
Falk, M. L., and Langer, J. S. (2011). Deformation and failure of amorphous, solidlike materials. Annu. Rev. Condens. Matter Phys. 2, 353–373. doi:10.1146/annurev-conmatphys-062910-140452
Falk, M. L., and Langer, J. S. (1998). Dynamics of viscoplastic deformation in amorphous solids. Phys. Rev. E 57, 7192–7205. doi:10.1103/physreve.57.7192
Greer, A., Cheng, Y., and Ma, E. (2013). Shear bands in metallic glasses. Mater. Sci. Eng. R Rep. 74, 71–132. doi:10.1016/j.mser.2013.04.001
Harrington, M., Liu, A. J., and Durian, D. J. (2019). Machine learning characterization of structural defects in amorphous packings of dimers and ellipses. Phys. Rev. E 99, 022903. doi:10.1103/physreve.99.022903
Homer, E. R., and Schuh, C. A. (2009). Mesoscale modeling of amorphous metals by shear transformation zone dynamics. Acta Mater. 57, 2823–2833. doi:10.1016/j.actamat.2009.02.035
Hufnagel, T. C., Schuh, C. A., and Falk, M. L. (2016). Deformation of metallic glasses: Recent developments in theory, simulations, and experiments. Acta Mater. 109, 375–393. doi:10.1016/j.actamat.2016.01.049
Johnson, J. M., and Khoshgoftaar, T. M. (2019). Survey on deep learning with class imbalance. J. Big Data 6, 27. doi:10.1186/s40537-019-0192-5
Lee, M., Lee, C.-M., Lee, K.-R., Ma, E., and Lee, J.-C. (2011). Networked interpenetrating connections of icosahedra: Effects on shear transformations in metallic glass. Acta Mater. 59, 159–170. doi:10.1016/j.actamat.2010.09.020
Lobo, J. M., Jiménez‐Valverde, A., and Real, R. (2008). Auc: A misleading measure of the performance of predictive distribution models. Glob. Ecol. Biogeogr. 17, 145–151. doi:10.1111/j.1466-8238.2007.00358.x
Misra, D. (2019). Mish: A self regularized non-monotonic neural activation function. arXiv preprint arXiv:1908.08681 4, 2.
Patinet, S., Vandembroucq, D., and Falk, M. L. (2016). Connecting local yield stresses with plastic activity in amorphous solids. Phys. Rev. Lett. 117, 045501. doi:10.1103/physrevlett.117.045501
Plimpton, S. (1995). Fast parallel algorithms for short-range molecular dynamics. J. Comput. Phys. 117, 1–19. doi:10.1006/jcph.1995.1039
Schoenholz, S. S., Cubuk, E. D., Sussman, D. M., Kaxiras, E., and Liu, A. J. (2016). A structural approach to relaxation in glassy liquids. Nat. Phys. 12, 469–471. doi:10.1038/nphys3644
Schuh, C. A., Hufnagel, T. C., and Ramamurty, U. (2007). Mechanical behavior of amorphous alloys. Acta Mater. 55, 4067–4109. doi:10.1016/j.actamat.2007.01.052
Schwartzman-Nowik, Z., Lerner, E., and Bouchbinder, E. (2019). Anisotropic structural predictor in glassy materials. Phys. Rev. E 99, 060601. doi:10.1103/physreve.99.060601
Sheng, H., Kramer, M., Cadien, A., Fujita, T., and Chen, M. (2011). Highly optimized embedded-atom-method potentials for fourteen fcc metals. Phys. Rev. B 83, 134118. doi:10.1103/physrevb.83.134118
Spaepen, F. (1977). A microscopic mechanism for steady state inhomogeneous flow in metallic glasses. Acta metall. 25, 407–415. doi:10.1016/0001-6160(77)90232-2
Tian, L., Fan, Y., Li, L., and Mousseau, N. (2020). Identifying flow defects in amorphous alloys using machine learning outlier detection methods. Scr. Mater. 186, 185–189. doi:10.1016/j.scriptamat.2020.05.038
Veličković, P., Cucurull, G., Casanova, A., Romero, A., Lio, P., and Bengio, Y. (2017). Graph attention networks. arXiv preprint arXiv:1710.10903.
Wakeda, M., and Shibutani, Y. (2010). Icosahedral clustering with medium-range order and local elastic properties of amorphous metals. Acta mater. 58, 3963–3969. doi:10.1016/j.actamat.2010.03.029
Wang, Q., Ding, J., Zhang, L., Podryabinkin, E., Shapeev, A., Ma, E., et al. (2020). Predicting the propensity for thermally activated β events in metallic glasses via interpretable machine learning. npj Comput. Mat. 6, 194. doi:10.1038/s41524-020-00467-4
Wang, Q., and Jain, A. (2019). A transferable machine-learning framework linking interstice distribution and plastic heterogeneity in metallic glasses. Nat. Commun. 10, 5537. doi:10.1038/s41467-019-13511-9
Wang, W. H. (2012). The elastic properties, elastic models and elastic perspectives of metallic glasses. Prog. Mater. Sci. 57, 487–656. doi:10.1016/j.pmatsci.2011.07.001
Xu, B., Falk, M. L., Li, J., and Kong, L. (2018). Predicting shear transformation events in metallic glasses. Phys. Rev. Lett. 120, 125503. doi:10.1103/physrevlett.120.125503
Xu, B., Falk, M. L., Patinet, S., and Guan, P. (2021). Atomic nonaffinity as a predictor of plasticity in amorphous solids. Phys. Rev. Mat. 5, 025603. doi:10.1103/physrevmaterials.5.025603
Keywords: metallic glass, machine Learning, graph neural network, imbalanced dataset, shear transformation zone
Citation: Lee J and Ryu S (2022) Evaluating the predictive power of machine learning model for shear transformation in metallic glasses using metrics for an imbalanced dataset. Front. Mater. 9:874339. doi: 10.3389/fmats.2022.874339
Received: 12 February 2022; Accepted: 01 July 2022;
Published: 22 July 2022.
Edited by:
Takuya Iwashita, Oita University, JapanReviewed by:
Yunjiang Wang, Institute of Acoustics (CAS), ChinaBin Wu, Beijing Normal University, China
Copyright © 2022 Lee and Ryu. This is an open-access article distributed under the terms of the Creative Commons Attribution License (CC BY). The use, distribution or reproduction in other forums is permitted, provided the original author(s) and the copyright owner(s) are credited and that the original publication in this journal is cited, in accordance with accepted academic practice. No use, distribution or reproduction is permitted which does not comply with these terms.
*Correspondence: Seunghwa Ryu, cnl1c2hAa2Fpc3QuYWMua3I=