 Mark A. Turk
 Hengli Cao
 Adam J. Thompson
 Jonathan P-H. Belnoue
 Stephen R. Hallett
 Dmitry S. Ivanov
- Bristol Composites Institute, University of Bristol, University Walk, Bristol, United Kingdom
Forming of dry engineering textiles is a quality-critical operation in composites manufacturing. There are various different defect mitigation strategies that have been developed to ensure that material will not wrinkle or fold when depositing and forming. One promising direction is the modification of textile properties in the regions where a defect is likely to form. This can be achieved by the integration of patches: additional materials, such as reactive thermally-conditioned resins, tufted or stitched yarns, thermoplastic films, locally activated binder, etc. This method is simple and effective for a certain class of forming problems. The success of the forming operation depends on the balance of properties between dry and patched materials. At present, there is no clearly established methodology for the characterisation of these formability enhancements. Patches are local and an isolated coupon often cannot be extracted from a hosting fabric. This paper discusses the feasibility of adapting the conventional bias extension test to extract the shear properties of locally enhanced material. The obtained properties are critical for modelling tools that can inform the optimum patch location and orientation. The suggested approach is practical, simple to implement and proven to provide properties to a reasonable degree of accuracy for non-linear elastic and visco-elastic patch behaviours.
1 Introduction
The behaviour of dry fabrics prior to infusion heavily influences the resultant properties of cured composites. Fibre orientation, wrinkling and tow spreading depend both on material properties and the design of the manufacturing processes. The complexity of the problem often demands computational modelling as the tool to inform whether the envisaged strategy is optimal and guarantees a defect-free solution. When modelling the behaviour of dry preforms in deposition and forming operations it is essential to know the shear and bending behaviour of the fabric. Effective methods for the characterisation of dry fabric are well established (Sharma et al., 2003; Harrison et al., 2004; Barbagallo et al., 2017). Depending on the balance of these properties, simulated fabric behaves in a wide spectrum of ways from unformable paper to an unrealistically compliant pin-joint net (Boisse 2017). Shear behaviour can be derived using the picture frame shear test (Sharma et al., 2003; Harrison et al., 2004), the biaxial test (Sharma et al., 2003) the bias extension test (Harrison et al., 2004; Barbagallo et al., 2017), and off-axis tensile tests (Potter 2002; Schirmaier et al., 2017; Wang et al., 2020). Typically, uniform fabric behaviour is assigned to the entire preform and then the forming process (fabric constraints, blank holders, sequence of operations) is optimised. An alternative approach, suggested by Turk et al. (Turk et al., 2020), is to alter the preform properties locally. It was shown that depositing resin patches in critical locations allows for the improvement of the drapability of complex geometry. The process involves the following sequence of steps: 1) optimisation of patch placement through numerical simulation, 2) integration of patches to a flat preform, 3) forming over the curved tool, 4) infusion and consolidation. Patch creation can be addressed by a variety of methods, such as deposition of liquid resin using dispenser on a flat preform followed by thermal conditioning, pressing thermoplastic film into the preform using hot press, or integrating constraining yarns by means of tufting/stitching or other textile methods. Depending on the chosen methods, it may have different implications for the flow and subsequent properties. Some of them may impede the flow, some, like tufting, promote it. The discussion of the specific patch creation methods goes beyond the scope of this paper, as well as the mechanical implications of patching. Some preliminary studies suggest that the fibre bridged interfaces can be positive for the mechanical performance of a part (Stanier et al., 2019) and (Ivanov et al., 2016).
Conceptually similar approaches can be implemented in terms of stitching (Molnár et al., 2007) or tufting (Liu et al., 2015). This approach does not require a complex arrangement of forming operations and hence can be attractive due to its simplicity. However, the local properties of modified regions need to be known for accurate process optimisation. This adds complexity to material characterisation. Extracting a patch for testing would lead to fabric disintegration. On the other hand, there is no established procedure for measuring local properties in a heterogenous material. All of the conventional testing methods either try to minimise non-uniformity of deformation in samples, as in the picture frame test, or to tailor the data processing to an assumed deformation map, as in the bias extension test.
This study seeks to investigate the feasibility of a new experimental procedure where the properties of patches, which can be highly non-linear and time-dependent, are extracted by testing a larger volume of the material. This testing will also give a deeper insight on how localised enhancements affects the macroscale behaviour. The experimental procedure is based on several elements: 1) reference testing of blank fabric, 2) detailed deformation analysis using optical methods, 3) concurrent numerical modelling. The process is first analysed in a virtual environment where input (hypothetical) properties of the patch need to correspond to deduced properties from the test. The methodology for the derivation of shear behaviour using an experimental setup needs to be practical, repeatable and reliable.
The bias extension test (BET) is a popular method for obtaining the shear properties of a fabric (Sharma et al., 2003; Harrison et al., 2004; Boisse et al., 2017; Zhu et al., 2007). A rectangular specimen is clamped between two grips creating a diamond shaped pure shear zone in the centre from which can be derived the shear angle and shear stress. The resultant deformation field is not uniform, which demands a specific conversion of both displacement and force into shear strain and shear stress. Yet, the resulting shear diagrams can be reliably obtained as evidenced by both numerical simulations and independent validation with picture frame tests (Sharma et al., 2003; Harrison et al., 2004). The advantage of BET over the picture frame test is the simplicity of implementation and absence of tensioning effects associated with clamping. This approach is also equally valid for establishing the shear behaviour of pre-impregnated fabrics despite the much higher shear stiffness of these materials (Boisse et al., 2017; Pourtier et al., 2018).
For validation of the testing procedure, this paper explores two different characteristic material behaviours; 1) approximating patches with increased localised stiffness response through the use of PLA (poly lactic acid) (non-linear elastic) and 2) increased localised viscosity through the use of epoxy resin film (viscoelastic). In the finite element analysis, elastic response is implemented using a non-linear hypo-elastic model, and time-dependent response of impregnated fabric is modelled using a hypo-viscoelastic model where the exponential stiffening behaviour of fabric is superimposed with a dash element connected in parallel. In the case of elastic response the model validation is deemed satisfactory if the emulated experiment succeeds in reproducing the input shear stress-strain curve assigned to a patch. In the case of visco-elastic response, this also includes successful derivation of the viscosity of the dash element. Once the numerical procedure has confirmed the methodology is suitable, the approach can be attempted experimentally.
This paper begins by exploring how the bias extension test can be adapted to derive the properties of a patch with non-linear elastic properties. These properties are characteristic for thermoplastic printed elements. In a virtual testing procedure, the properties are derived from independent “measurements” and checked against the input properties. This procedure is then expanded to viscoelastic patches which may be close in behaviour to the case of epoxy resin film. Based on the outcome of these two modelling approaches experiments are conducted to deduce the actual properties of PLA and epoxy resin film.
2 Methodology
The conventional bias extension test involves clamping a rectangular specimen of biaxial woven fabric lengthwise between two grips. The length of the specimen is prescribed to be at least twice that of the width (Boisse et al., 2017), with the orientation of the fibres at ±45°. This arrangement leads to the creation of a diamond shaped pure shear zone in the centre where deformation is close to the state of pure shear. The specimens are clamped across the full width and the clamps moved apart at a constant rate. The constraint-free boundary along the long edge ensures that the fibres are free from tension as each fibre has at least one non-gripped end. The resultant deformation field is not uniform over the sample area which therefore demands a specific conversion of both displacement and force into shear strain and shear stress. The layout of the deformation zones are shown in Figure 1.
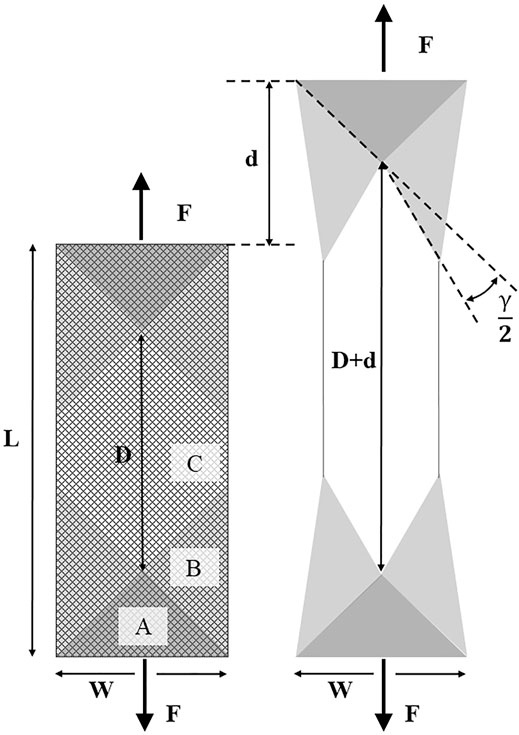
FIGURE 1. Bias extension test standard design.
In a sample with uniform distribution of properties, the crosshead load and displacement of the bias extension test can be used to derive both the shear stress and shear angle respectively within the pure shear zone as detailed by Boisse et al. (Boisse et al., 2017):
Where γ is shear angle, D is the length of the pure shear zone (i.e. length of full sample minus width of full sample) and d denotes crosshead displacement. Shear force as a function of crosshead load is calculated incrementally based on the considerations of energy dissipated in various zones (Boisse et al., 2017):
Where F is the crosshead applied load and l is the width of the specimen. Fsh denotes the shear force within the pure shear region.
It is known that the calculation of shear stress, eq. 2 and shear strain, eq. 1 in BET begin to break down at large shear angles (e.g. above 40°, (Harrison et al., 2004)) due to intra-ply slippage becoming a significant deformation mechanism (Harrison et al., 2004; Boisse et al., 2017). This leads to locally measured shear angle being the preferred option. As a result it is common to use optical measurements such as optical Digital Image Correlation (DIC) measurements rather than rely on the crosshead displacement eq. 1 to assess the strain within the sample directly and without making assumptions on strain homogeneity. The cameras can also be a more effective way of identifying the start point of the experiment as they can track the beginning of shearing in the fabric (this is often several seconds after the crosshead begins to move due to slack in the fabric). Implementing DIC requires applying a speckle pattern on the surface of the fabric. Even though the application of paint on the surface may change the behaviour of the fabric, this gives a good idea about the specimen kinematics. In Section 5 DIC is used to assess how the presence of the patches affects the strain distribution. The samples were painted with a white background and black speckles of approximately 1 mm diameter. Two 5 MP cameras were used at a frame rate of 2 fps, these were focused on the central portion of the test with the window size measuring 250 mm × 250 mm. Prior to the test, the cameras were calibrated according to the procedure recommended by the manufacturer of the system (using calibration plates) to ensure spatial correlation. A subset size of 31 pixels was used with a step size of eight pixels.
The shear angle was calculated by averaging a horizontal rectangular strip across the centre of zone C (see Figure 1). Section 5 also makes use of still frames captured with optical cameras which are analysed manually, based on the visible rotations of yarns in the areas of interest.
Through the trialling of various methods the most effective way to ensure 45° yarns and zero pre-shearing when cutting the samples was through the use of a weighted stencil matching the dimensions of the bias test. This allowed for accurate dimensions and manual alignment of the yarns against the stencil edges to ensure no yarns were dropped and no shearing occurred during cutting. To ensure the required yarn orientation at the start of the test, the grips were kept horizontal by aligning the top of the grip to the load cell clamps using a solid metal flange built into the grip.
The current study explores the possibility of modifying the sample by depositing patches on the bias extension sample and deducing the stress-strain relationship within the patch based on local optical measurements and scaling of load along with crosshead load and displacement. The main motivation to choosing the partial coverage test configuration is that the method needs to be robust for various modification/patch types such as tufting (Liu et al., 2015; Shen et al., 2020) or fast curing resin (Turk et al., 2020), where full coverage is clearly not an option. The purpose of this layout is solely the derivation of patch properties and not formability enhancement. It is important to distinguish wrinkling seen in the test on bias experiments and wrinkles that can be expected during forming. Patches play different roles in these two cases. It is anticipated that restraining the fabric will help in different circumstances, such as creating additional tensile stresses in critical locations or mitigating against excessive shearing beyond the locking angle. The discussion of this has been initiated in the papers of Turk et al. (Turk et al., 2020) as well as on the papers with stitched/tufted patches (Liu et al., 2015; Shen et al., 2020). The purpose of this layout is solely the derivation of patch properties and not formability enhancement.
From forming and testing perspectives, various configurations of patch placement were considered. For brevity of the paper, only two that were deemed more plausible are discussed. The main factors of patch placement are the following:
(1) Orientation of the patch. The work of Turk et al. (Turk et al., 2020) demonstrated that the most promising configuration was the placement of narrow line patches at 45° to the fibre direction and enveloping a critical location. This orientation modifies shear resistance of the fabric without having a major impact on local bending properties of the fabric (NB: aligning the patch along the fibre direction has negligible effects on the tensile stiffness but may affect bending stiffness and lead to folds). Placing patches along the direction of the bias test is the logical choice as it maximises the contribution to the measured force response.
(2) Length of the patches. The main choice here is between placing patches only in the central zone of pure shear or to make them extend continuously along the length of the sample. The latter option was deemed preferable because it results in a more homogenous sample overall. See Figure 2. With this arrangement each individual region of the BET sample has the same percentage coverage and therefore the same average stress-strain response.
(3) Spacing and number of patches. These parameters are assessed through numerical simulations and, as will be shown later, may be different for various patches depending on their properties and contrast in stiffness with the hosting fabric.
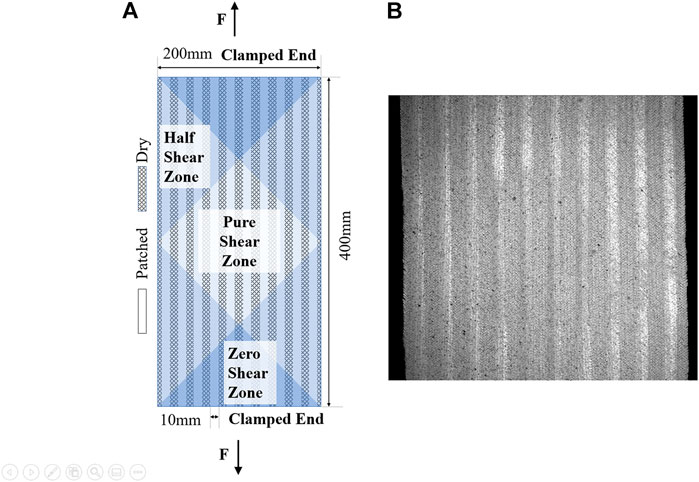
FIGURE 2. Bias extension test with modified sample geometry (A) schematic diagram of patch distribution; (B) actual geometry of the sample with 50% coverage of PLA patches (painted).
The procedure suggested for patched samples relies on several key assumptions. The primary assumption is that the total reaction force of the sample can simply be summed up from the contributions of the dry area and average response of the patches. Though the mechanics of patched fabric in the context of the bias test is complex this pragmatic assumption is later extensively verified in conjunction with numerical simulations of the test. It also assumes that the stress field within the patches is relatively uniform. In reality, the addition of patches inevitably violates the homogeneity of the deformation even in the central zone of the sample, adding to the intrinsic non-uniformity of the deformation field in the BET test. Hence, the virtual experiment needs to assess the precision with which the properties can be extracted.
The proposed procedure for extracting patch shear behaviour can be condensed to the following key elements:
(1) The fabric is partially covered in striped patches placed at a regular spacing and extending along the length of the entire specimen–Figure 2.
(2) The BET test, instrumented with optical measurements of local deformations, is conducted both for patch-treated fabric and, separately, untreated preform. The behaviour of untreated preform is then used to subtract the contribution of dry areas from the sample deformation.
Shear stress vs. shear strain plots are generated for both types of specimen. Shear strain is averaged over the central shear zone, whereas the calculation of the shear stress is done according to the standard procedure for untreated samples based on the measurements of load eq. 2. A scaling of the load needs to be applied to calculate how much of the load fraction can be attributed to patch deformations. The dry fabric shear stress value is subtracted from the patched sample value for a given shear strain and the resulting graph scaled up based on the percentage patch coverage eq. 3.
Where
Another important aspect that needs to be explored through virtual testing is susceptibility of the chosen sample configuration to undesired deformation modes such as buckling. As will be shown, the patch coverage can play a significant role in this.
A final significant consideration is the effect of pre-shearing of the sample due to gravity. This is noticeable primarily for the dry fabric samples, where patches were present this shearing due to gravity was significantly reduced. This was mitigated by ensuring the space between top and bottom grips was equal to the cut length of the sample when the experiment began, ensuring the sample dimensions were maintained and that crosshead displacement was therefore comparable between experiments, even if this led to some sagging (slack) in the middle of the sample. The samples with patches of either PLA or resin film were considerably less prone to this problem.
3 Non-Linear Elastic Patches
In this section the feasibility of deducing non-linear elastic properties of patches from the bias extension test is explored. These properties are likely to be exhibited by patches with fully cured resin or patches created by dry sub-reinforcement, i.e. tufting and stitching. Various patch arrangements are trialled and the accuracy of the technique is assessed by comparing model output (replicating how data is acquired in actual test) to input, defined by the hypo-elastic model.
3.1 Model Description
To simulate the bias-extension test the fabric was modelled using a continuous 2D finite element approach. In line with (Turk et al., 2020), a hypo-elastic material model developed for the deformation behaviour of 2D textiles was used for both the dry fabric and modified patches, this model specifies that the material exhibits nonlinear, but reversible behaviour. This is not strictly accurate for dry fabrics as upon unloading and reloading they exhibit a different loading trajectory, however this is deemed satisfactory for monotonic loading. Following the formulation initially proposed by Khan et al. (Khan et al., 2010), the fabric is modelled using a hypo-elastic material model programmed into a VUMAT user material subroutine for Abaqus explicit. The model allows for the tracking of fibre reorientation and enables the correct calculation of shear angles at large deformations. The shear stress and shear strain behaviour are defined in the coordinate system associated with the orientation of yarns. One of the challenges when modelling textiles as continuums is the separation of the bending and tensile behaviour to ensure the model captures the high tensile stiffness but significantly lower flexural stiffness. One approach, as demonstrated by Thompson et al. (Thompson et al., 2020) and similarly to Haanappel et al. (Haanappel et al., 2010), is the superposition of shell and membrane elements which allows for the realistic modelling of both the high in-plane tensile stiffness and low out of plane bending stiffness. This enables the realistic representation of the main features of woven fabric behaviour: fibre rotation, shear stiffening, uncoupled bending and tension responses.
The simulated bias extension test is conducted on a sample of dimensions 100 mm by 200 mm with a displacement of 30 mm. A mesh size of 1 mm was used, bearing in mind that the patch width used is 5mm, resulting in each strip being approximately five elements wide. Rectangular elements were used, oriented at 45° to the loading direction. It has been well-documented that shear-locking of elements can lead to spurious wrinkles when simulating forming processes (Yu et al., 2006; ten Thije and Akkerman 2008; Hamila and Boisse 2013), these non-physical deformations are a product of shear locking of the elements. While using reduced integration elements can minimise this phenomenon, it was been shown in (Yu et al., 2006) that this does not eliminate the occurrence of shear locking for all orientations of the mesh in respect to the fibre orientations. To avoid shear locking, the mesh has therefore been aligned with the fibre direction when simulating the bias extension test. The solver used is Abaqus explicit. This model is suitable for any biaxial woven fabric.
3.2 Simulation Input
The simulated test is run with various different patch coverage levels, in this case 25, 50, 75, and 100% (see Figure 3). Using this range of coverages it is possible to get a clearer idea of how much patch material must be present on the surface of the fabric to obtain sufficient material data for property extraction. The 100% coverage scenario is not practical to replicate experimentally but is included here for the purpose of verification of the patch property extraction procedure.

FIGURE 3. Bias extension simulation with striped patches at 25% coverage.
The characteristic input properties for the dry fabric are provided as an empirical dependency of shear tangent rigidity vs. shear angle. Driven by simplicity of implementation, this dependency is defined as a fifth order polynomial.
The plot of shear stress vs. shear angle is shown in Figure 4. The chosen patch behaviour is not intended to be representative of a specific material at this stage but rather to examine features that may be observed in practice and show sufficiently contrasting properties. The patched regions are modelled as having a shear stiffness of approximately one order of magnitude higher than that of the dry fabric, this is superimposed on top of the underlying dry fabric behaviour already present in these regions. There is also a significantly differing early stiffness response at lower shear angles. The early stiffening is chosen to reflect the initial resistance of the patches, which for some material forms may be more similar to composite-like behaviour than dry fabric. As the sample approaches the locking angle the influence of the dry fabric begins to contribute more significantly to the overall loading response.
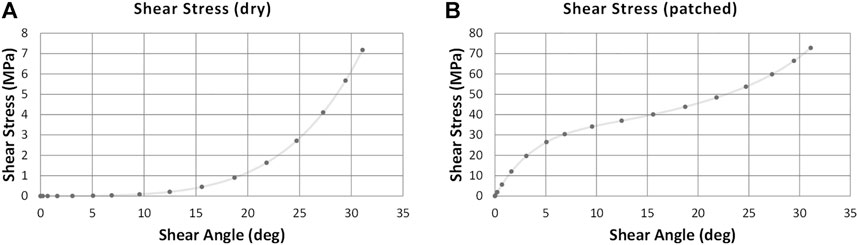
FIGURE 4. (A) Shear stress input for dry regions (B) shear stress input for patched regions (note: differing y-axis scale).
The underlying polynomial equation for dry and patched fabrics in the graphs of Figure 4 is:
The dry and patched fabric input polynomial coefficients are shown in Table 1 (obtained from (Thompson, 2017)), where α is a coefficient, τ is shear stress and t = 6-i.
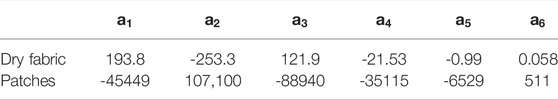
TABLE 1. Polynomial coefficients for dry and patched fabric as used in simulations.
Note that these polynomials define the shear rigidity not shear stress and therefore define the gradient of the graphs of Figure 4.
The shear stiffness is of an order of magnitude higher in the patched regions when compared to the dry fabric behaviour. This relatively low contrast is chosen to allow the simulations to cover a wide range of potential future patch properties. In practice it is anticipated that the contrast in material properties between the two would be considerably larger than this for PLA patches. It is expected that a larger difference in behaviour will lead to a more accurate identification of the patch properties. The modelling exercise is set to establish the protocol for the property extraction ahead of the experimentation and hence, the specific behaviour of the fabric does not affect the outcome of the exercise (processing of data obtained from the test). The characteristic behaviour of woven fabric was adapted from the study of Thompson (Thompson 2017), exhibiting exponential stiffening typical for many engineering fabrics including carbon and glass woven preforms.
3.3 Result Post-Processing
The post-processing of the patched sample is done in several steps. First, the effective response of the sample is assessed using the conventional methodology for BET using the crosshead load and displacement data eqs 1, 2. Second, the shear angle used in the calculation, is revised and instead averaged over the diamond shaped pure shear zone in the centre of the sample (zone C) based on local strain measurements rather than derived from eq. 1. The resultant shear stress vs. shear angle curves can be compared to the input shear properties of the patch. Particular attention is paid to the onset of lateral out-of-plane buckling and what impact this has on the validity of the shear angle calculations. The shear stress vs. shear angle derived patch results for the range of coverages are shown in Figure 5A with the input curve overlaid. Both graphs are scaled based on percentage coverage as per eq. 3.
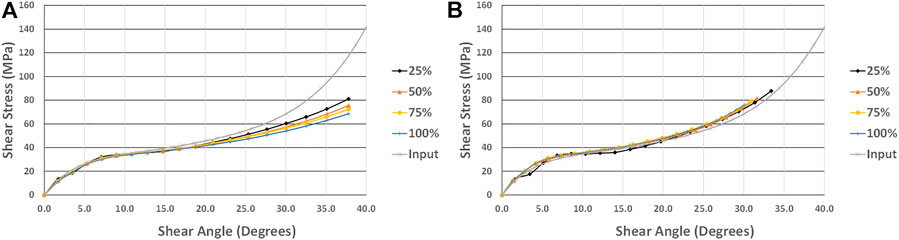
FIGURE 5. Derived patch shear stress outputs compared with patch property input (A) output crosshead derived (B) output based on average local strain measurements (a and b both scaled by percentage patch coverage).
It can be seen in Figure 5A that because of the dominance of patch properties the dry fabric does not contribute to the apparent behaviour of the sample for shear angles up to approximately 20°, with relatively little impact of percentage coverage on the result. At 20° the largest error of recovered properties is 6.8%, which is somewhat surprisingly observed for the 100% coverage sample. Above 20° the derived shear stress begins to fall below the actual patch response. Based on the significantly better correlation shown in Figure 5B, this can be attributed almost entirely to the overestimation of shear angle by eq. 1 due to the onset of out of plane buckling, which begins almost immediately and gradually worsens over the course of the simulation (see Figure 6). Any significant out of plane buckling leads to lower shear than eq. 1 due to the material finding another degree of freedom to accommodate the deformation. These results show that with a patch material of sufficiently higher shear stiffness than that of the dry fabric, the shear response of the patch regions dominate allowing for extraction of patch properties. For reference the height of the out of plane buckling visible in Figure 6B is 3 mm from peak to trough compared to a patch width of 5 mm.
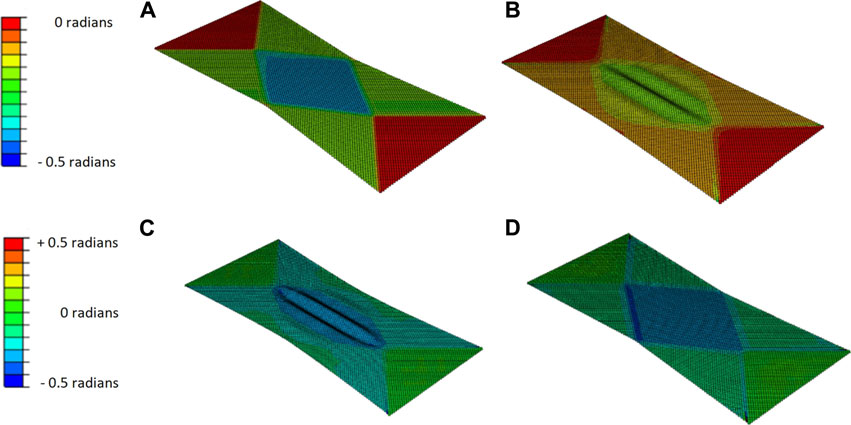
FIGURE 6. Comparison of the deformation pattern at 20° shear angle in the pure shear zone for (A) dry fabric and (B) 50% coverage) also comparison at 16° for (C) 50% coverage (D) central stripe.
The limit of accuracy at 20° is concerning as, when using patches with relatively low shear stiffness, this threshold could well be exceeded (Turk et al., 2020). To improve the accuracy of property extraction, the shear strain within the patches could be directly measured rather than calculated from the cross-head displacement. This would rely on the assumption that the kinematics of the test would not be changed when incorporating the patches. These measurements could be realized by optical methods, such as digital image correlation (DIC). The results show that kinematics of the test and stress balance are now accurately captured to higher shear deformation despite the progressive lateral buckling of the samples. Note that the initial instability is caused by the iterative calculation of shear stress using eq. 2 which is extremely sensitive to minor initial fluctuations in load.
4 Visco-Elastic Patches
Section 3 explored the derivation of patch properties with a hypo-elastic model for the scenario where there is a strong contrast in shear stiffness between patched fabric and dry fabric. This section considers the scenario where the desired patch property may be much less pronounced. This could be representative of the case of uncured or partially cured epoxy resin film deposited on the preform. Thermal conditioning of the deposited resin prior to forming allows for the various viscosities to be obtained and hence, allows the user to flexibly tailor material performance to the requirements of the process.
4.1 Model Description
In the virtual testing experiment, the resin patch is modelled as a combination of a fully viscous element, representing the behaviour of resin film, and a non-linear elastic element that represents the behaviour of impregnated fabric. The elements are mutually constrained (using coincident nodes) ensuring that the deformation of the viscous and elastic elements are the same:
Where τ is shear stress, γ is shear strain,
This model is implemented through a user material subroutine based on a simplification of the work of Wang et al. (Wang et al., 2021) using the Kelvin-Voigt model (Larberg and Åkermo 2014), the overall stress being the sum of the contributions from the two elements.
This relation is a significant simplification of the actual behaviour of the impregnated fabric, which is known to be more complicated for materials such as prepregs (Wang et al., 2021). However, this exercise investigates the conceptual feasibility of extracting viscous patch properties from a BET. For a start, the behaviour of the elastic elements G(γ) is assumed to be the same as the behaviour of the dry fabric eq. 4 and the virtual trial is focussed on deriving the viscosity of the liquid (damping) element from the BET. In practice, the lubrication is likely to affect the behaviour of the fabric. The possibility for generalization of the methodology will be discussed upon review of actual experimental results in later sections.
4.2 Result Post-Processing
The viscosity is explored in the range of 0.15–1,500 MPa s which covers a wide range of values observed in practice from thermally-conditioned liquid resin intended for liquid moulding, to rigid PLA patches. The experimental procedure is adapted for the visco-elastic behaviour of the patches by conducting a series of tests at different strain rates. It is important to note that the constant strain-rate of the cross-head does not guarantee constant strain-rate within the patch, on the contrary strain rate will gradually increase as the shear angle increases. To deduce the viscosity, the results of the tests are mapped in the 3D space of shear stress/shear strain rate/shear strain. The viscosity is then obtained by regression of the data points with eq. 4.
The total time of the test for the given displacement of the viscoelastic simulations varies from 10 to 100 s to give a range of strain rates. Only the 50% coverage scenario is implemented in the virtual experimental trials to keep the number of experiments manageable.
The crosshead load, represented in the model by the reaction force is converted to shear force using eq. 2 and normalised by the nominal cross-sectional area to obtain shear stress - plotted on the Y-axis of Figure 7. Due to the accuracy errors previously found when using eq. 1 in Section 3, results are presented from both crosshead derived and directly acquired shear angles. Directly acquired shear angle is extracted from the elements within the model and averaged over zone C, this mimics optical measurement techniques. Shear strain rate is calculated by measuring the increment of shear deformation at each step of the run and dividing this by the duration of the step. A surface fit is calculated using MATLAB for the discrete data points. The surface fit is organized such that across every shear stress-shear strain cross-section the curve is described by 5th order polynomial in agreement with the dry fabric elastic response eq. 4 and across every shear stress shear strain-rate cross-section is fitted by 1st order polynomial in agreement with a Newtonian flow model. Thus, the fit presents as a curve extruded in the shear strain rate space. This surface fit, based on data from the five different strain rates, is shown in Figure 7A (note that for brevity only the directly acquired “optical” derived results are plotted). The fit was implemented using built-in MatLab polynomial regression with its quality characterised by R-square value of 0.97.
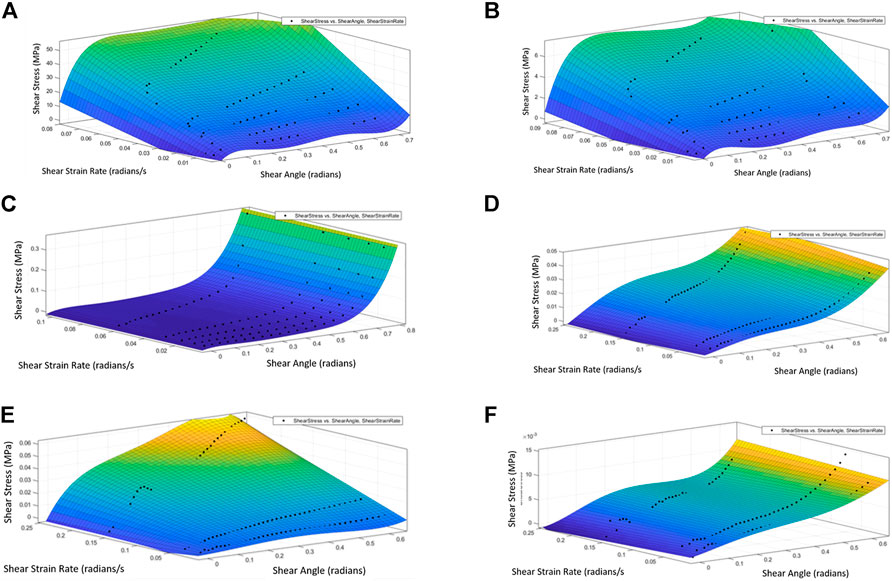
FIGURE 7. Surface fit of the shear stress response at various strain rates (A) simulated 50% coverage (B) simulated 5% coverage (C) simulated dry fabric (D) experimental visco-elastic 50% coverage (E) experimental visco-elastic 100% coverage (F) experimental dry fabric.
The gradient of the surface fit corresponds to the viscosity value, however this gradient fit varies with γ (x-axis, shear angle), therefore it is necessary obtain the gradient at a given shear angle x = 0.288 in order to get one fixed gradient value. The detailed reasons for selecting 0.288 radians as the shear angle are justified based on the later experiments shown in Section 5. This is sufficiently far through the simulation to avoid initial fluctuations caused by abrupt loading onset but well before the onset of exponential stiffening, therefore being the ideal point to obtain the most accurate viscosity reading.
Derived viscosity values are shown in Table 2. The viscosity value is the gradient scaled by the percentage coverage. The viscosity value derived using the crosshead displacement has an error of 28% when compared to the input viscosity of 1,500 MPa s, this is a significant level of error, by contrast the results based on local strain assessment is considerably better at 6.9%. This shows that due to the buckling and non-uniformity of the deformations, eq. 1 does not represent the actual intensity of shear in the central zone. It is also observed that due to the relatively high coverage of patches, out of plane buckling occurs very early on in the run.
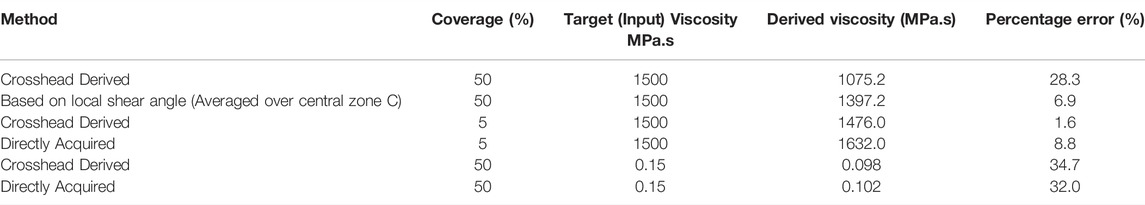
TABLE 2. Calculated viscosity at both 50% coverage and 5% coverage firstly derived using Eq. 1 based on crosshead displacement and then secondly derived by averaging the pure shear zone C taking values directly from the model.
On the basis of these issues it was decided to reconfigure the experiment in the hope of improving the accuracy when calculating shear angle based on crosshead displacement. A dry fabric sample with identical dimensions as before is treated with just one central stiffened strip 5 mm wide, as shown in Figure 8, this reduces coverage significantly and avoids multiple patches alternating with unpatched regions across the sample.
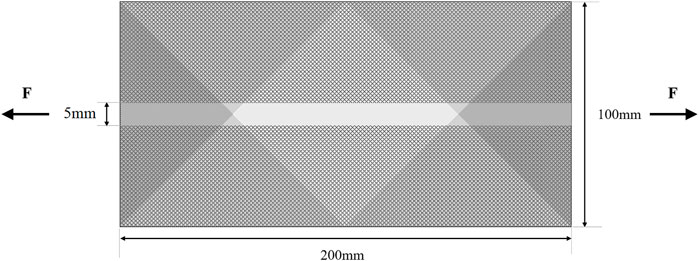
FIGURE 8. Bias extension test schematic diagram with one central stiffened strip.
The simulated deformation pattern is compared with the previous setup in Figures 6C,D demonstrating that this new approach does indeed significantly reduce out of plane bucking. The comparison between 50% coverage and 5% coverage is shown at the midway point of 0.277 rad/15.9° shear angle.
The 3D curve fit for the data from these experiments are shown in Figure 7B with the derived viscosity shown in Table 2. Again, for brevity, only locally derived shear results are shown in figures. As before the gradient is taken at 0.288 radians.
It can be seen that the derived viscosity values from this second method show a significant improvement in accuracy for the crosshead derived results, with the error reduced from 28.3 to 1.6%. This comes directly from eliminating earlier buckling. By contrast the directly acquired error increased from 6.9 to 8.8% due to difficulties associated with the stress resolution as the single central patch provides smaller relative contribution to the reaction load compared to heavier patching. It can be surmised that the close proximity of multiple patches to each other overly constrains the dry fabric between, meaning that its effect on the load displacement curve can no longer be considered negligible. In agreement with observations of elastic patching, the viscosity can be extracted even beyond buckling onset if local deformations in the central zones are tracked directly.
The previously considered cases prove the fundamental feasibility of the viscosity extraction but examine a rather extreme value of viscosity (1,500 MPa s). To further explore the applicability of the method the viscosity was significantly reduced for further trials and matched to the characteristic value of thermally-conditioned liquid resin deposited in liquid form (0.15 MPa s). The derived viscosity for the data from these experiments are shown at the bottom of Table 2.
It can be seen that at lower viscosity values, the algorithm loses its accuracy though still correctly identifies the order of magnitude of viscosity values. This is due to the fact that the stress resolution is reduced. Lower viscosity means that the stress in the patched region is considerably lower than in previous cases and the test resolution does not succeed in capturing the exact contribution of patched region.
Based on Table 2 and observations of the deformation in the simulations, the out of plane buckling has been fully avoided, leading to an excellent match between crosshead derived and “optical” (directly acquired) measurements. However, this has not led to an improvement in overall accuracy. This appears to be due to the lack in contrast between the patched fabric behaviour and dry fabric behaviour compared to higher viscosity. The exact viscosity of low-viscocity patches presents less practical interest as it does not necessarily contribute significantly to the behaviour of the fabric and hence their application for defect mitigation during forming may be limited. In either case the characteristic values were extracted with satisfactory precision for the optimisation of forming using modelling tools.
5 Bias Extension Test Tests on Treated Fabric
The simulations have shown the theoretical feasibility of the two approaches proposed in sections 3 and 4. This section aims to validate the feasibility of property extraction experimentally and explore the behaviour of heterogenous samples. To validate the procedure the following steps are carried out. Firstly, striped patches are applied to the fabric and a bias extension test is carried out. Data from this test is post processed and from this, patch shear behaviour is calculated (either non-linear elastic or viscosity depending on the assumed material behaviour). The experiments are conducted with varying patch coverage to 1) verify the role of buckling predicted by the model, 2) validate the robustness of experimental procedure. The validation tests are compared with the results of numerical simulations deploying properties extracted at different patch coverages.
There are several key characteristics of the BET which are worth bearing in mind with these experiments. The calculation of shear stress eq. 2 and shear strain eq. 1 in BET begin to break down at large shear angles (e.g. above 40° (Harrison et al., 2004)) due to intra-ply slippage becoming a significant deformation mechanism (Harrison et al., 2004; Liu et al., 2015). The BET also requires at least one end of each yarn to be free on order to prevent any significant tension within the yarns, a condition which can easily be undermined by the presence of localised stiffening. Finally, the conventional result processing is assumed to be valid until the onset of out-of-plane buckling. In the previous section it was shown that the deployment of local strain measurement can lift some of these limitations and successfully extract properties beyond the conventional constraint with the help of optical tracking of fibre reorientation, using DIC or other optical systems (Harrison et al., 2004; Boisse et al., 2017; Lee et al., 2008), to ensure that shear angle readings are accurate even at higher shear angles.
5.1 Bias Extension Test on Preform With Deposited Poly Lactic Acid Patches
BET tests were carried out by applying PLA patches integrated to dry glass fabric to assess the procedure for extraction of non-linear elastic properties and to establish whether experimental results support the hypothesis presented in section 3 with a reasonable correspondence.
PLA is chosen as it is easy to handle, simple to shape and press into the fabric and exhibits a shear response of significant contrast to that of the dry fabric.
Experiments were conducted with samples of 280 gsm 2 × 2 twill woven glass cloth (Easy Composites LTD GF-22-280-100). The fabric was cut to a size of 440 mm × 200 mm, with the yarns oriented 45° to the edges. The 440 mm length includes an extra 20 mm at each end to accommodate the clamps. A sample prepared for the bias extension test is shown in Figure 2.
The 8 mm wide PLA strips were prepared using Ultimaker 2+ 3D printers and were hot pressed into the fabric from one side at 160°C and 0.4 MPa for 2 min to ensure impregnation of the fabric without excessive spreading of the polymer within the fabric. It is observed that the strips printed at 8 mm initially spread to approximately 10 mm after the hot press has been used. The PLA thickness was selected to approximately match that of the fabric, though this was not considered critical for demonstrating the concept, providing there is consistency of sample dimensions.
PLA coverage was set at 25, 50 and 75% giving a total of three samples. Three PLA-free samples were also tested to be used as a baseline for establishing the properties of untreated fabric. These tests revealed, that in line with the hypothesis discussed in Section 3, there is minimal impact of strain rate on the results. The sample was clamped into custom made grips across the full width top and bottom (see Figure 2). The total displacement of the upper grips constituted 60 mm which roughly corresponds to 73° theoretical shear. The PLA samples were assumed to be rate-independent and tested at a single crosshead displacement rate of 1.2 mm/s with the total time of experiment being 50 s.
A full 3D DIC system (LaVision) was set up to examine both the shear deformation and susceptibility of the samples to out-of plane buckling. Two cameras were used as mentioned in section 2. For the samples with PLA patches, white paint was sprayed onto the surface of the sample followed by a fine speckle pattern of black to allow the DIC cameras to track the fabric distortion.
The added paint might be expected to impact the fabric behaviour. However, this did not affect the extracted properties. The patch behaviour is not influenced by the presence of the paint as they are too stiff compared to the fabric. The shear stresses resulting from the underlying fabric behaviour and the paint in the dry samples were found to be negligible compared to the patched samples. The behaviour of painted fabric itself, on the other hand, was accounted for by the testing painted patch-free fabric.
A typical shear map taken by the DIC cameras is shown in Figure 9, this image corresponds to a crosshead displacement of 16.8 mm out of 60 mm total resulting in an average shear angle in the central zone of 6.5°. The non-uniformity induced by the PLA patches is clear in the central zone where the three middle stripes have considerably higher shear interspersed with non-patched regions having lower shear due to distorting out of plane instead (Harrison 2016).
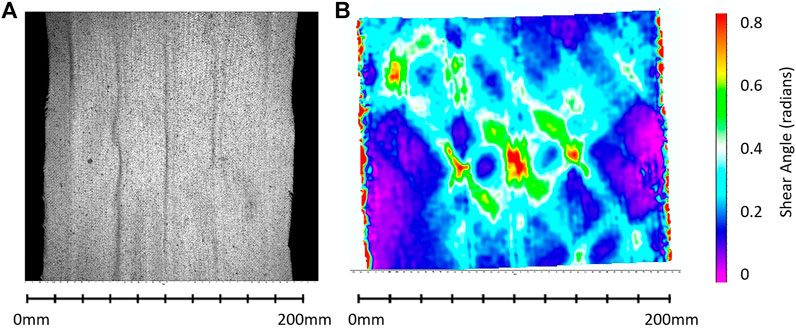
FIGURE 9. (A) Image taken by DIC camera and (B) shear map generated for 25% coverage of PLA (at 16.8 mm crosshead displacement out of 60 mm).
The crosshead load and optically measured shear angle data is first processed in line with the methodology shown in Section 2; Eqs 1 and 2. This derived shear stress vs. shear angle dependencies were compared at different coverage levels. Following the data extraction procedure established by the simulations in Section 3, the baseline dry fabric behaviour has been deducted and the results scaled up based on coverage level. The results are presented in Figure 10.
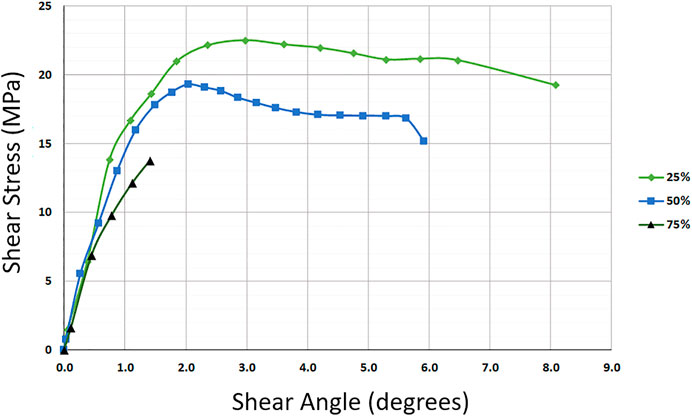
FIGURE 10. PLA shear stress response at various coverage levels.
The most important observation from Figure 10 is that all three sample configurations show patch rupture at very low shear angles–between 6° and 9°. In the case of the 75% coverage, the load capacity of the tensile machine (1 kN) was reached before patch failure and the test was stopped. At lower coverage, the experiment is aborted due to the fabric beginning to tear (for clarity data points after the onset of tearing are not plotted). The tearing occurs well before the characteristic deformation at which exponential fabric stiffening occurs. These patches appear to rigidise the fabric changing its deformation behaviour rather than just stiffening its behaviour as was modelled in the previous section. The measurement of bending properties, though possibly critical, goes beyond the scope of the current paper. Numerical simulations are important to understand the implications of those factors and their influence on mechanical behaviour in the context of forming simulations.
In general, the patch behaviour exhibited at various coverage is in sensible agreement, at 5° shear angle the deviation between 25 and 50% coverage is 20%. This is reasonable in the context of the characteristic scatter for the dry fabric testing and discussed in the next section. The testing confirms the feasibility of property extraction procedure.
5.2 Experiments on Visco-Elastic Patches
For the verification of the procedure for viscoelastic property extraction presented in Section 4, BET tests were carried out on dry glass fabric preforms with imprinted XPREG XA120 Epoxy Resin Film. The selection of this resin offered a reasonable balance between wide range of viscosities that can be achieved through thermal conditioning and stable behaviour for the time scales of the test.
The resin film was hot pressed into the fabric at 70°C and 0.4 MPa for 30 s. These parameters ensure that the resin propagates through the thickness of the fabric without excessive spreading due to capillary forces. Tests were carried out with either five strips evenly spaced resulting in a coverage of 50% or 100% coverage of resin film conducted as a validation test. Some initial experiments were carried out with 5% coverage in one central strip as suggested by the simulations in Section 4, however these resulted in too low a registered crosshead load and accurate results could not be obtained, this is discussed further in Section 6.
Dry fabric was tested once more to be used as a baseline, this time without paint. A few amendments were made as detailed below. The displacement range was unchanged however the total time of the experiment was now varied depending on the strain rate required. Runs at each coverage level were carried out (Dry, 50 and 100%) at three strain rates, with the dry fabric and 50% samples each repeated 3 times, and the 100% coverage samples only conducted once. This gave a total of 21 experiments. The crosshead displacement rates were 1.2 mm/s, 3 mm/s and 12 mm/s.
The properties of infused thermosetting patches are comparable with the properties of the fabric. Hence, the application of paint may significantly affect the deformation of the samples. Therefore, shear deformations were tracked manually on the images since the warp and weft yarns were clearly visible in the patched regions. Two sample images at 16.5° shear angle (as measured in pure shear zone C) are shown in Figure 11. Even with a thinner paint, a noticeable impact on the shear properties is still expected. Paint remains a viable option where there is a strong contrast between patch and host fabric properties. For patches produced by liquid resin, a direct observation of fabric shearing was considered to be a more reliable method for determining the local shear.
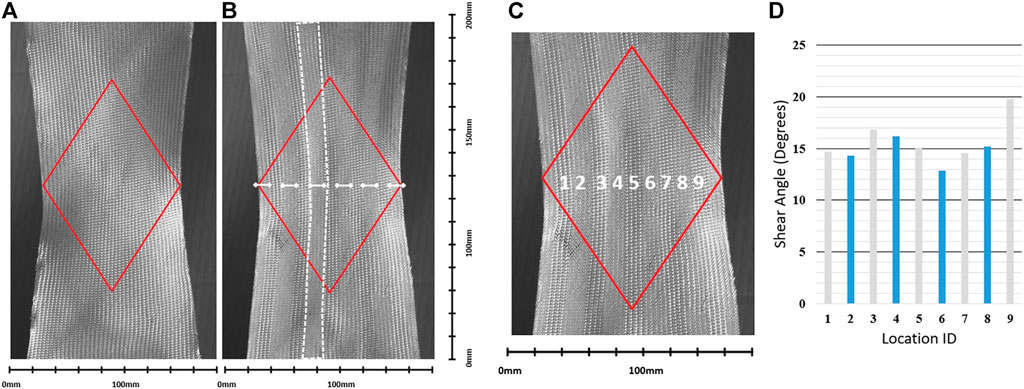
FIGURE 11. (A) Image taken by videogauge at 0% coverage (B) image taken by videogauge at 50% coverage. (C) labels of shear angle measurement locations reading horizontally across the sample (D) charts the shear angle with grey denoting dry fabric and blue denoting patched locations. The red diamond outlines the approximate edges of the theoretical pure shear zone. The patch locations are indicated in white with one patch outlined.
The extraction of patch viscosity is conducted as described in Section 4 (i.e. plotting the results in 3D space, surface fitting and taking the viscosity measurement from the gradient of the material response surface). However, it is first necessary to narrow down the range of shear angles where the viscosity can be extracted with better confidence. When observing the central (“pure shear”) zone C it is observed that the onset of out of plane buckling occurs at shear angle of approximately 26° for the 50% coverage samples, with exponential stiffening beginning to dominate from approximately 21° upwards. Hence, this level of deformation represents the upper limit for the identification of viscosity. It is also observed that a clear deformation pattern with central shear zone is not fully developed before the angle of approximately 12° shear angle. This therefore provides a narrow window for determining viscosity with 16.5° identified as a suitable mid-way point (this corresponds to a shear angle of 0.288 radians).
Manual calculation of the shear angle based on images is estimated to give an error of approximately ±2° (based on repeated blind tests). Given that the shear level chosen was just 16.5° as stated above it was decided that using crosshead displacement in conjunction with eq. 1 would lead to more accurate results, however the shear angles calculated are later verified against the corresponding images to confirm their accuracy. Note that Figure 5A demonstrated a maximum error of 6.8% for eq. 4 up to 20°, with the subsequent loss of accuracy attributable to out of plane buckling occurring beyond this shear level.
The shear angle values for three of the runs are compared in Table 3 against the shear angles measured on the images to assess any discrepancy. To reduce the manual error as much as possible four readings were taken at the four corners of the diamond shaped central shear zone and the average and range calculated. The three experiments selected for this verification were the first run of each coverage level at the highest shear crosshead displacement rate (12 mm/s). According to eq. 1 the identified shear angle of 16.5° occurs at a crosshead displacement of 20mm, therefore the video gauge frame corresponding to this displacement was analysed and the shear angle measured from the image. The results are shown in Table 3.
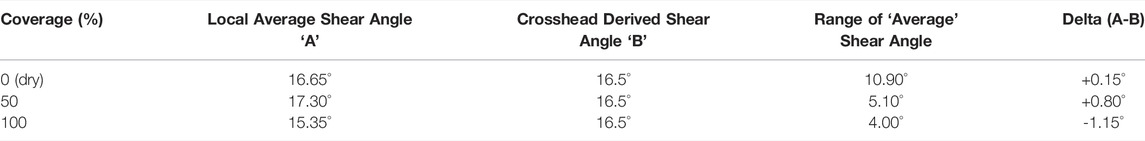
TABLE 3. Shear angle measurements by coverage level as measured from video gauge frame and also derived based on crosshead displacement.
Based on the very low delta values of Table 3 these results were concluded to give sufficient confidence to proceed using shear angle measurements derived from the crosshead displacement.
To assess the uniformity of the pure shear zone shear angle measurements were taken from an image of a 50% coverage sample, again at 16.5°, show in Figure 11C and Figure 11D. This coverage level was deemed to be the most likely to have a non-homogeneous shear zone due to the contrasting material properties. It can be seen that the shear angle does vary across the sample but this appears to mostly be random scatter with no clear pattern in terms of location or if patched/unpatched. This, therefore, can be attributed to a combination of minor variations in fabric properties and inaccuracy of the measurement itself.
The results from the 50% coverage scenario at the three different strain rates were plotted in 3D space and the results mapped to a surface in keeping with eq. 4 and the earlier simulated results. As the 50% coverage scenario was repeated three times each for each of the strain rates the shear stress values were first averaged reducing 9 data sets to 3. This data fit is shown in Figure 7D. This averaging was required to allow for a clear graph due to significant variations between repeat experiments (see Figure 12) which is discussed further in Section 6. Such variations are not uncommon, see for example (Cao et al., 2008).
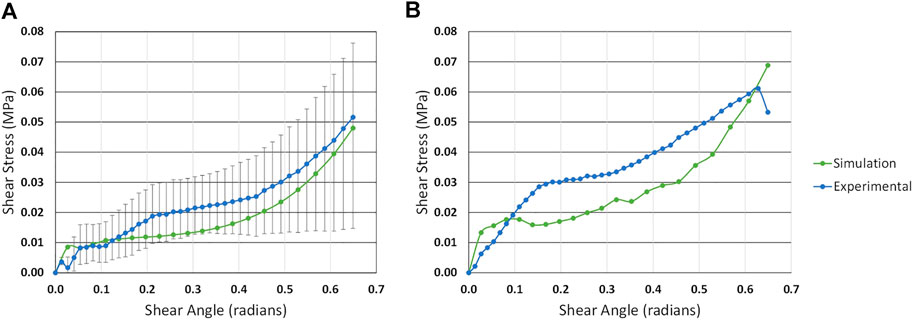
FIGURE 12. Comparison of experimental and simulated results for (A) 50% and (B) 100% coverage at 12 mm/s crosshead displacement rate.
The R-value for this surface fit is 0.94. Solving the polynomial equation generated for the fit with x = 0.288 results in a gradient of 0.0565 MPa s and hence a viscosity value of 0.113 MPa s, in accordance with the methodology of Table 2.
The results from the 100% coverage samples are plotted in the same way and the gradient again derived, this is shown in Figure 7E. For brevity the polynomial is not shown here, however with this coverage a viscosity of 0.167 MPa s was derived. This value is 47% higher than that derived from 50% coverage. It is noted that the experiment at the highest strain rate has a small initial peak in the stress-strain diagram, followed by a trough, this is due to the initial frictional resistance of the fabric being overcome and levelling out which is more pronounced at higher coverage levels and strain rates. The R-value for this surface fit is 0.99.
Before concluding that the viscous behaviour shown is due to the applied resin it is also necessary to establish whether the dry fabric itself displays any viscous behaviour. The same graph is therefore plotted following identical steps as for the 50 and 100% scenarios above. The results are shown in Figure 7F, the R-value for this surface fit is 0.97.
This results in a gradient and hence viscosity value of 0.002 at a shear angle of 0.288. This is over 50 times lower than the viscosity obtained for the 50% coverage sample and can be considered negligible, therefore it can be concluded that the dry fabric alone is not behaving in a viscous manner.
To quantify the accuracy of the viscosity value of 0.113 MPa s derived from the 50% coverage scenario, the value is used as the input for a simulated run of both the 50 and 100% coverage samples, and subsequently compared to experimental results. As discussed in Section 4 the two required inputs are the shear behaviour of the underlying fabric defined as the shear modulus in the form of a fifth order polynomial, and the viscosity already obtained. The input polynomial is taken as the derivative of the average of the experiments plotted in Figure 7F. Similarly to the 50% coverage samples the simulated and experimental results are post processed in order to plot shear stress against shear angle. As the viscosity this time is treated as an input value (as it is derived from the experiments), the results are not plotted in 3D and instead a 2-D plot of comparison between experimental results and simulated results are produced for the highest strain rate trialled (12 mm/s) at both 50 and 100% coverage. This strain rate is chosen because it leads to the highest stresses and hence errors are more noticeable and easier to distinguish from noise. The results are shown in Figure 12.
The simulated and experimental results for 50% coverage shown in Figure 12A show reasonable correlation, however, it can be seen that the simulated results give a 59% lower shear stress compared to the experiments in the critical central region of interest at 0.288 rad shear angle. For the 100% coverage sample shown in Figure 12B the simulated results give a 41% lower shear stress compared to the experiments at this same shear angle. It is noteworthy that the experimentally derived results for the 100% coverage sample gave a higher viscosity value than at 50% coverage suggesting the discrepancy is a combination of both the method and the modelling approach. It is also noted that the discrepancy between the 50 and 100% coverage results is within the experimental scatter of the experiments.
The noise noticeable from the simulated results is primarily due to the use of the iterative eq. 2 which is very sensitive to fluctuations introduced when there is a large initial step up in load as we have here. It is good practice to have a gradual ramp up in displacement when using an explicit time stepping scheme in order to minimise dynamic fluctuations, however this was not possible here due to the need to have a fixed crosshead strain rate.
6 Results and Discussions
6.1 Experimental Set-Up
Despite all the considerations mentioned in section 2 and with considerable care being taken in their implementation it was still difficult to ensure a perfect pure shear zone occurred across all samples. The main issue being the pure shear zone occurring at a slight angle deviation away from vertical when comparing the upper and lower tips of the diamond. All the issues mentioned in section 2 are considerably more problematic for dry fabric samples than for pre-preg as pre-preg has significantly higher initial shear stiffness. It is concluded both that the bias test when conducted on dry fabric is extremely sensitive to sample misalignment and also that minor inherent variations between the weave of each sample contribute to a notable level of variation between even “identical” runs. This was mitigated in this paper through up to three repeats of each scenario to give a clear idea of experimental discrepancy.
6.2 Hypo-Elastic Model and Poly Lactic Acid Experiments
It was shown in Section 3 that the accuracy of the simulated results for high stiffness non-viscous materials was heavily dependant on extracting shear angle measurements directly from the sample rather than deriving from crosshead displacement using eq. 1. This was concluded to be due to early onset of out of plane buckling at very low shear angles (<20°) whenever a significant proportion of the sample is covered by high stiffness patches. The planned approach to tackle this experimentally was to track shear angles optically through the use of DIC tracking a speckled paint pattern painted on top of the fabric and patches, thus allowing useful material data to still be collected even after the onset of buckling. This tracking was successful in measuring shear angle for the PLA samples.
A key limitation in the experiments is the low cohesion of the yarns at the edge of the specimens, when under deformation the yarns slip relative to one another causing large relative displacements to occur between individual yarns and ultimately “unweaving” of the material. This leads to disintegration/tearing of the speckled pattern and hence the DIC is no longer able to track the deformations. This occurred at the edges of the patched samples which led all samples to fail at less than 10°. It is therefore concluded that excessive stiffening of the fabric architecture with such materials as PLA leads to impractically high loads on the fabric leading to sample failure rather than shearing. A less stiff material or a considerably lower percentage coverage may lead to more useful results. This technique remains promising but 50% coverage of such a stiff material as PLA is clearly pushing the boundaries of this technique.
The results obtained are still useful for providing an approximate shear stiffness of PLA patches in simulations as the following exponential stiffening behaviour at higher shear angles can be inferred from the dry fabric behaviour with the two experiments combined to give an approximate hybrid curve. Despite the relatively low shear angle at which the experiment had to be stopped, useful data has been obtained within the region 0°–6°. Given the very high stresses shown here compared to those involved in dry fabric only testing, patches with such high shear stiffness as PLA would be expected to have very minimal shearing in a formability experiment. If a lower stiffness material was used or a lower percentage coverage more data at higher shear angles could be obtained effectively.
Should the approach be extended to idealize the impact on shear behaviour of stitching or tufting, consideration would again need to be given to keeping the percentage coverage as low as practically possible.
6.3 Visco-Elastic Model and Resin Film Experiments
In the visco-elastic simulations similar issues with out-of-plane bucking leading to the inaccuracy of eq. 1 were found as for the hypo-elastic model. As before these were partially resolved through directly obtaining the shear angle from the simulated mesh itself. A second approach was also trialled for the visco-elastic simulations using only 5% coverage in one central strip. This approach seem promising in the simulations but when it was trailed experimentally these resulted in too low a registered crosshead load and accurate results could not be obtained. The load obtained at such a low coverage was only slightly higher than that of dry fabric and was very hard to distinguish from the inherent error of the method. It was also discovered early on in the experiments that the influence of the paint required for the DIC shear tracking was heavily influencing the results as the paint itself was viscous and had notable thickness. Therefore, the decision was made to run the experiments without DIC and instead take images with a video gauge to be analysed manually using the visible warp and weft to calculate shear angle rather than requiring paint. Though, as mentioned in Section 5.2, due to the low shear angle for extracting the viscosity value, the crosshead derived shear angle was ultimately considered the most accurate at low shear and this was verified in Table 3.
A viscosity value was successfully obtained from samples at both 50% coverage and 100% coverage. The value obtained at 100% coverage was 47% higher than that obtained from 50% coverage. The primary aim of identifying a reasonably accurate viscosity value to assist formability simulations is therefore fulfilled. However it is unclear why this variation in apparent viscosity between coverage levels. The three most feasible options are:
(1) The dash-pot model (Wang et al., 2021) may not be fully applicable. This is a very rough approximation as it treats the patches as a fully viscous material and does not consider the patch to have any resistance at infinitesimally small strain rates. This is far from sufficient and needs more data to derive an adequate model. This study gives it a first attempt and proves the fundamental possibility for finding an appropriate form of a model.
(2) Experimental variation between sample could account for the discrepancy. Significant variation was found between experiments of up to 100% of the total load (i.e. results from two or more “identical” experiments could have the highest result recording as much as twice the load as the lowest sample for a given shear angle). In literature such variations are not uncommon (Cao et al., 2008).
(3) The error might be inherent to the method, i.e. the higher the coverage the higher the apparent viscosity (even after scaling so that results are comparable).
The only clear way to distinguish the cause between these three options would be to run considerably more bias extension tests to establish more accurate average responses in order to quantify and eliminate the impact of variation between samples.
It is important to emphasise here the difference between the viscous properties of the resin and the viscous properties of the resin impregnated fabric. The viscosity value obtained here is the viscous behaviour of resin infused fabric not the viscosity of the standalone resin. The two components superimposed in the modelling work are the underlying fabric behaviour and the viscous behaviour of patched fabric, rather than the underlying fabric and the viscous behaviour of the resin alone. This means that a direct comparison between the values obtained and the manufacturer data for both PLA and the imprinted resin is not directly applicable and is therefore beyond the scope of this paper.
7 Conclusion
The numerical experiments tested the applicability of the suggested approach for various material types and property ranges. It was found that both non-linear elastic and viscous properties of the patches can be deduced when there is a sufficient contrast between the properties of the patch and the hosting fabric. When these properties are comparable, the procedure becomes less robust. However, in the case of low contrast, a very accurate estimate of the patch properties becomes less practically relevant. The precision of property determination is well within the scatter observed when testing common engineering preforms (Cao et al., 2008).
The technique shown in this study is a promising approach for characterising the properties of preform enhancements. It is currently demanding both in experimental and simulation time but nonetheless the viscous model allows for a good level of accuracy when attempting to model patched fabric shear behaviour. It remains to be explored how well the technique can be carried across to other material combinations. It is clear that for high stiffness patching materials a very low percentage coverage is required in order to obtain results at higher shear angles, in the experiments presented here only the initial behaviour for the shearing of PLA was successfully obtained, with the experiment failing at approximately 10°. Obtaining the viscous behaviour of resin film was considerably more successful with the simulations matching well to the experimental results and a viscosity value in the range of 0.11–0.17 MPa s was obtained, further work is needed to investigate an accurate value for experimental variability.
Data Availability Statement
The original contributions presented in the study are included in the article/Supplementary Materials, further inquiries can be directed to the corresponding authors. Data are available at the University of Bristol data repository, HYPERLINK "https://data.bris.ac.uk/data/" data.bris, at https://doi.org/10.5523/bris.1jsmmz8a3kp7y2ss529sf3sti7.
Author Contributions
MT: Lead author and experiment lead. HC: Support in experimental trials. AT: Guidance on forming simulations and article review. JB: Expertise on numerical modelling and precursor testing. SH: Research overview, coordination with related projects. DI: Project supervision, concept, direction.
Funding
The work of Thompson, Belnoue and Hallett has been supported by the EPSRC Platform Grant [EP/P027350/1] SIMulation of new manufacturing PROcesses for Composite Structures (SIMPROCS). The work of Turk and Ivanov has been supported by the EPSRC through the Future Composites Manufacturing Research Hub [EP/P006701/1].
Conflict of Interest
The authors declare that the research was conducted in the absence of any commercial or financial relationships that could be construed as a potential conflict of interest.
Publisher’s Note
All claims expressed in this article are solely those of the authors and do not necessarily represent those of their affiliated organizations, or those of the publisher, the editors, and the reviewers. Any product that may be evaluated in this article, or claim that may be made by its manufacturer, is not guaranteed or endorsed by the publisher.
References
Barbagallo, G., Madeo, A., Azehaf, I., Giorgio, I., Morestin, F., and Boisse, P. (2017). Bias Extension Test on an Unbalanced Woven Composite Reinforcement: Experiments and Modeling via a Second-Gradient Continuum Approach. J. Compos. Mater. 51, 153–170. doi:10.1177/0021998316643577
Boisse, P. (2017). Simulations of Woven Composite Reinforcement Forming. Woven Fabr. Eng. Polona Dobnik Dubrovski 978-953-307-194-7. hal-016.
Boisse, P., Hamila, N., Guzman-Maldonado, E., Madeo, A., Hivet, G., and dell’Isola, F. (2017). The Bias-Extension Test for the Analysis of In-Plane Shear Properties of Textile Composite Reinforcements and Prepregs: a Review. Int. J. Mater. Form. 10, 473–492. doi:10.1007/s12289-016-1294-7
Cao, J., Akkerman, R., Boisse, P., Chen, J., Cheng, H. S., de Graaf, E. F., et al. (2008). Characterization of Mechanical Behavior of Woven Fabrics: Experimental Methods and Benchmark Results. Composites A: Appl. Sci. Manufacturing 39, 1037–1053. doi:10.1016/j.compositesa.2008.02.016
Haanappel, S. P., Thije, R. T., and Akkerman, R. (2010). “Forming Predictions of Ud Reinforced Thermoplastic Laminates,” in 14th Eur. Conf. Compos. Mater., Budapest, Hungary, 7-10 June 2010, 1–10.
Hamila, N., and Boisse, P. (2013). Locking in Simulation of Composite Reinforcement Deformations. Analysis and Treatment. Composites Part A: Appl. Sci. Manufacturing 53, 109–117. doi:10.1016/j.compositesa.2013.06.001
Harrison, P., Clifford, M. J., and Long, A. C. (2004). Shear Characterisation of Viscous Woven Textile Composites: A Comparison between Picture Frame and Bias Extension Experiments. Composites Sci. Technol. 64, 1453–1465. doi:10.1016/j.compscitech.2003.10.015
Harrison, P. (2016). Modelling the Forming Mechanics of Engineering Fabrics Using a Mutually Constrained Pantographic Beam and Membrane Mesh. Composites Part A: Appl. Sci. Manufacturing 81, 145–157. doi:10.1016/j.compositesa.2015.11.005
Ivanov, D. S., Le Cahain, Y. M., Arafati, S., Dattin, A., Ivanov, S. G., and Aniskevich, A. (2016). Novel Method for Functionalising and Patterning Textile Composites: Liquid Resin Print. Compos. Part. A. Appl. Sci. Manuf. 84, 175–185. doi:10.1016/j.compositesa.2016.01.018
Khan, M. A., Mabrouki, T., Vidal-Sallé, E., and Boisse, P. (2010). Numerical and Experimental Analyses of Woven Composite Reinforcement Forming Using a Hypoelastic Behaviour. Application to the Double Dome Benchmark. J. Mater. Process. Technol. 210, 378–388. doi:10.1016/j.jmatprotec.2009.09.027
Larberg, Y., and Åkermo, M. (2014). In-plane Deformation of Multi-Layered Unidirectional Thermoset Prepreg - Modelling and Experimental Verification. Composites Part A: Appl. Sci. Manufacturing 56, 203–212. doi:10.1016/j.compositesa.2013.10.005
Lee, W., Padvoiskis, J., Cao, J., de Luycker, E., Boisse, P., Morestin, F., et al. (2008). Bias-extension of Woven Composite Fabrics. Int. J. Mater. Form. 1, 895–898. doi:10.1007/s12289-008-0240-8
Liu, L., Zhang, T., Wang, P., Legrand, X., and Soulat, D. (2015). Influence of the Tufting Yarns on Formability of Tufted 3-Dimensional Composite Reinforcement. Composites Part A: Appl. Sci. Manufacturing 78, 403–411. doi:10.1016/j.compositesa.2015.07.014
Molnár, P., Ogale, A., Lahr, R., and Mitschang, P. (2007). Influence of Drapability by Using Stitching Technology to Reduce Fabric Deformation and Shear during Thermoforming. Composites Sci. Technol. 67, 3386–3393. doi:10.1016/j.compscitech.2007.03.022
Potter, K. (2002). In-plane and Out-Of-Plane Deformation Properties of Unidirectional Preimpregnated Reinforcement. Composites Part A: Appl. Sci. Manufacturing 33, 1469–1477. doi:10.1016/s1359-835x(02)00138-0
Pourtier, J., Duchamp, B., Kowalski, M., Legrand, X., Wang, P., and Soulat, D. (2018). Bias Extension Test on a Bi-axial Non-crimp Fabric Powdered with a Non-reactive Binder System. AIP Conf. Proc. 1960, 020023. doi:10.1063/1.5034824
Schirmaier, F. J., Dörr, D., Henning, F., and Kärger, L. (2017). A Macroscopic Approach to Simulate the Forming Behaviour of Stitched Unidirectional Non-crimp Fabrics (UD-NCF). Composites Part A: Appl. Sci. Manufacturing 102, 322–335. doi:10.1016/j.compositesa.2017.08.009
Sharma, S. B., Sutcliffe, M. P. F., and Chang, S. H. (2003). Characterisation of Material Properties for Draping of Dry Woven Composite Material. Composites Part A: Appl. Sci. Manufacturing 34, 1167–1175. doi:10.1016/j.compositesa.2003.09.001
Shen, H., Yang, Y., Wang, P., Hong, Y., Legrand, X., Yang, X., et al. (2020). Effect of Tufting Technique on Sound Insulation of Multi-Layer Glass Woven Fabrics. Mater. Res. Express 7, 095510. doi:10.1088/2053-1591/abb855
Stanier, D., Radhakrishnan, A., Gent, I., Roy, S. S., Hamerton, I., Potluri, P., et al. (2019). Matrix-graded and Fibre-Steered Composites to Tackle Stress Concentrations. Compos. Structures 207, 72–80. doi:10.1016/j.compstruct.2018.09.019
ten Thije, R. H. W., and Akkerman, R. (2008). Solutions to Intra-ply Shear Locking in Finite Element Analyses of Fibre Reinforced Materials. Composites Part A: Appl. Sci. Manufacturing 39, 1167–1176. doi:10.1016/j.compositesa.2008.03.014
Thompson, A. J., Belnoue, J. P. H., and Hallett, S. R. (2020). Modelling Defect Formation in Textiles during the Double Diaphragm Forming Process. Compos. Part. B Eng. 202, 108357. doi:10.1016/j.compositesb.2020.108357
Thompson, A. J. (2017). Multi-Scale Modelling of Textile Composite Manufacture. PhD Thesis (Exeter, UK: University of Exeter).
Turk, M. A., Vermes, B., Thompson, A. J., Belnoue, J. P. H., Hallett, S. R., and Ivanov, D. S. (2020). Mitigating Forming Defects by Local Modification of Dry Preforms. Compos. Part. A. Appl. Sci. Manuf. 128, 105643. doi:10.1016/j.compositesa.2019.105643
Wang, Y., Chea, M. K., Belnoue, J. P. H., Kratz, J., Ivanov, D. S., and Hallett, S. R. (2020). Experimental Characterisation of the In-Plane Shear Behaviour of UD Thermoset Prepregs under Processing Conditions. Compos. Part. A. Appl. Sci. Manuf. 133, 105865. doi:10.1016/j.compositesa.2020.105865
Wang, Y., Belnoue, J. P.-H., Ivanov, D. S., and Hallett, S. R. (2021). Hypo-viscoelastic Modelling of In-Plane Shear in UD Thermoset Prepregs. Composites Part A: Appl. Sci. Manufacturing 146, 106400. doi:10.1016/j.compositesa.2021.106400
Yu, X., Cartwright, B., McGuckin, D., Ye, L., and Mai, Y.-W. (2006). Intra-ply Shear Locking in Finite Element Analyses of Woven Fabric Forming Processes. Composites Part A: Appl. Sci. Manufacturing 37, 790–803. doi:10.1016/j.compositesa.2005.04.024
Keywords: forming, liquid moulding, bias extension, local properties, preform
Citation: Turk MA, Cao H, Thompson AJ, Belnoue JP-, Hallett SR and Ivanov DS (2022) A New Approach to Measuring Local Properties of Preforms Enhanced for Formability. Front. Mater. 9:867591. doi: 10.3389/fmats.2022.867591
Received: 01 February 2022; Accepted: 04 April 2022;
Published: 27 April 2022.
Edited by:
Alberto Corigliano, Politecnico di Milano, ItalyReviewed by:
Valter Carvelli, Politecnico di Milano, ItalyPierre J.J. Dumont, Institut National des Sciences Appliquées de Lyon (INSA Lyon), France
Copyright © 2022 Turk, Cao, Thompson, Belnoue, Hallett and Ivanov. This is an open-access article distributed under the terms of the Creative Commons Attribution License (CC BY). The use, distribution or reproduction in other forums is permitted, provided the original author(s) and the copyright owner(s) are credited and that the original publication in this journal is cited, in accordance with accepted academic practice. No use, distribution or reproduction is permitted which does not comply with these terms.
*Correspondence: Mark A. Turk, bWFyay50dXJrQGJyaXN0b2wuYWMudWs=; Dmitry S. Ivanov, ZG1pdHJ5Lml2YW5vdkBicmlzdG9sLmFjLnVr