 Joachim Osterberger
 Franz Maier
95% of researchers rate our articles as excellent or good
Learn more about the work of our research integrity team to safeguard the quality of each article we publish.
Find out more
ORIGINAL RESEARCH article
Front. Mater. , 20 May 2022
Sec. Mechanics of Materials
Volume 9 - 2022 | https://doi.org/10.3389/fmats.2022.865477
This article is part of the Research Topic Mechanical Testing of Composite Precursors View all 7 articles
The increasing demand for automated manufacturing processes for carbon fiber-reinforced polymers necessitates accurate forming simulations. For that purpose, the multi-purpose finite element solver Abaqus provides the phenomenological *Fabric material model. While it is designed for woven materials, both structural directions and shear properties can be independently adjusted. We aim to quantify its applicability to model forming of UD semi-finished prepregs in a diaphragm forming station. We describe the material characterization and modeling and compare the simulation results to experiments using accurate laser scans of manufactured parts. Various simulation aspects are methodically altered to better gauge their impact on the simulated forming result. An accurate calibration of the bending behavior was found to be most important for the forming results. This is realized in the *Fabric material model by softening the compressive stiffness and the limitations of this workaround must be investigated in more detail. Other aspects, like rate-dependent modeling of the transverse direction and anisotropic properties for friction should be considered. Overall, a good agreement with experimental results including regions with fiber bridging or the formation of folds and the contour of the part could be achieved.
Manufacturing of continuously fiber-reinforced plastic (CFRP) parts in automotive and aircraft industries is increasingly automated. One of these automated processes is diaphragm forming, i.e., draping of the semi-finished products by using a silicon membrane pulled in by vacuum. The process was originally invented for thermoplastic composites, but could also reduce the part costs for thermoset composites significantly, compared to manual lay-up (Bersee et al., 2007), especially when used in combination with out-of-autoclave curing prepregs (Sun et al., 2012; Bian et al., 2013; Alshahrani and Hojjati, 2017). A major advantage is that only a one-sided tool is required, thus reducing investment costs compared to, close-tolerance, double-sided tools for the press processes (Alshahrani and Hojjati, 2017; Chen et al., 2017).
An accurate and reliable finite-element (FE) draping simulation can help to prevent forming defects and optimize forming results, without the need for manufactured prototypes, resulting in an accelerated development process. If followed by a subsequent curing simulation and virtual testing, a complete virtual process chain, allowing for a simulation “as built”, can be established (Henning et al., 2019).
Toward these goals, various modeling approaches exist. Kinematic draping simulations, neglecting the material properties, based on geometric mapping techniques can provide reasonable results only for dry and balanced fabrics (Pickett et al., 2005) and are still the state of the art in aircraft industries. However, accurate results and especially for impregnated semi-finished products (prepregs) with various textile types, other than plain weave fabrics and complex tooling geometries, necessitate the use of FE approaches.
Macroscopic FE modeling, using smeared (homogenized) material properties for the composite, allows for time-efficient computations, despite the large-scale parts commonly used in automotive and aerospace industries. Macroscopic models need to account for large fiber rotations and non-orthogonal material properties, which requires hypo- or hyperelastic non-linear constitutive models (Kärger et al., 2020). One main aspect of interest is the bending behavior for fiber-reinforced materials and an overview of recent developments is given in Boisse et al. (2018) (Boisse et al., 2018a). Using single-layer shell elements with classic bending theories for such applications implies a deficit for modeling the out-of-plane bending behavior in conjunction with high tensile stiffness (Boisse et al., 2018a; Boisse et al., 2018b). To decouple bending and in-plane behavior, classic shell and membrane elements can be superimposed (Haanappel et al., 2014) and the bending properties can additionally be modified via subroutines, e.g., defining a non-linear relationship (Schirmaier et al., 2017) or including a dependency on the curvature (Yu et al., 2020). Alternatively, the shell formulation can be modified to include the decoupling (Dörr et al., 2018) or modified shell formulations such as the Ahmad framework (Ahmad et al., 1970; Liang et al., 2017) or a three-node shell (Hamila et al., 2009) can be used to better simulate the ending behavior. Also, numerical effects like shear locking need to be considered and avoided for macroscopic FE modeling (Yu et al., 2006).
The multi-purpose FE-solver ABAQUS provides a built-in material model for forming simulations, without the need for additional user subroutines or software add-ons. The hypoelastic *FABRIC material model, available in ABAQUS/explicit, captures the mechanical response of a woven fabric phenomenologically. The two structural directions are independent of each other and the shear behavior only depends on the angle enclosed by the two principal directions (Abaqus 6.11-1, 2021). The model is able to consider rate-dependent, non-linear anisotropic behavior. It is well established for forming simulations of dry woven fabrics (Kärger et al., 2020), however, its applicability for other semi-finished CFRP types and a roadmap on how to obtain the required test data is not shown in detail so far. In this work, we demonstrate the use of the *FABRIC material model for a UD prepreg and elaborate on the impact/necessity of several important simulation parameters.
The material used for this research is a carbon UD prepreg (HexPly® M79/34%/UD300/CHS), using a low-temperature cure epoxy resin with recommended cure cycles of 70–120°C and curing times of 8 hours to less than 1 hour, respectively. It can be processed at pressures from 0.3 to 5 bar. In uncured condition, the material thickness is approximately 0.35 mm. The material is suitable for preforming in the single diaphragm forming process.
We used a uniaxial test setup inspired by ISO 527-5 and applied it to uncured prepreg specimen to test the mechanical response in (single ply 136 × 15 mm, n = 5, Zwick/Roell Z020, 20 kN load cell) and perpendicular (4 plies, 25 × 60 mm, n = 6, Zwick/Roell Z0, 5, 500 N load cell) to the fiber direction without cap strips. The enlarged width and multiple plies for the latter are necessary to ensure a force response well detectable with the 500-N load cell. Tests were performed at three loading rates of 100–500–1,000 mm/min, for n = 5 at each speed, longitudinal and 100–1,000–2,000 mm/min, for n = 6 at each speed, perpendicular to the fiber direction, i.e., equally spaced over the range of possible loading rates for the corresponding testing machine.
A silicon membrane (MS2-3 mm; RAPHA Systems), with a specified failure strain of 700%, is used in the diaphragm station. Tests were performed according to ISO 527-2 (specimen type 5A) at velocities 50–500–2000 mm/min, for n = 6 at each speed, on a uniaxial testing machine (Zwick/Roell Z0, 5).
The highest applied deformation rate, i.e., 2000 mm/min, corresponds to 70% of the median process velocity, determined via simulation.
We used a 10° off-axis tensile test similar to NASA technical note (TN) D-8215 and recorded the deformation with a digital image correlation (DIC) system [cf., Wang et al. (2020)]. Multiply specimens (three plies, 25 × 260 mm) were speckled with white matting spray and mounted to a uniaxial testing device (Zwick/Roell Z0,5, 500 N load cell). Specimen dimensions ensured that the fibers are not clamped at the top and bottom and thus allowing for a shear band (Figure 1) to form. Tests were performed at 150−1,500–2000 mm/min, for n = 6 at each speed (the adaptation toward higher rates accounts for the findings of the uniaxial extension tests).
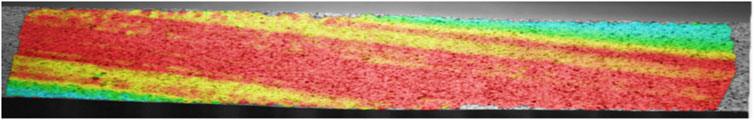
FIGURE 1. Illustration of the localized shear band within a 10° off-axis test sample, recorded with the Aramis DIC system.
The tests were recorded with a two-camera system (Aramis 12M, GOM) at a frame rate of 8 Hz or 84 Hz for higher speeds, respectively, and the strain fields were calculated (Correlate V2019, GOM). Strain values were exported from the localized shear band and the resulting shear strain was calculated according to NASA TN D-8215. The corresponding stress data are obtained by synchronizing data from the tensile testing machine with the respective Aramis strain field data by aligning the measured and applied axial strain.
To determine the bending behavior, we built a test apparatus inspired by ISO 9073-7, i.e., a manual cantilever beam bending test (cf., Figure 2A). Application of this method for uncured composite materials is challenging, as prepregs tend to twist slightly out of plane due to irregularities in the material and samples tend to stick to the apparatus due to the tacky surface, thus cannot slide. To overcome these drawbacks, the test procedure is converted into a freefall test, i.e., the specimen is positioned with an overhanging section and a pin (135 mm from the edge) is removed. In case of a specimen exceeding a length of 140 mm, additional support at the end is used to avoid initial sag of the specimen. The length of the overhanging section, required to reach the declined plane within a specified time, is measured. To account for the highly time-dependent response, due to the viscosity of the resin, two timescales are considered. Reaching the plane within 10 s is considered the instantaneous response and within 10 min, the long-term response. These configurations defined a lower and upper bound for the bending length, respectively.
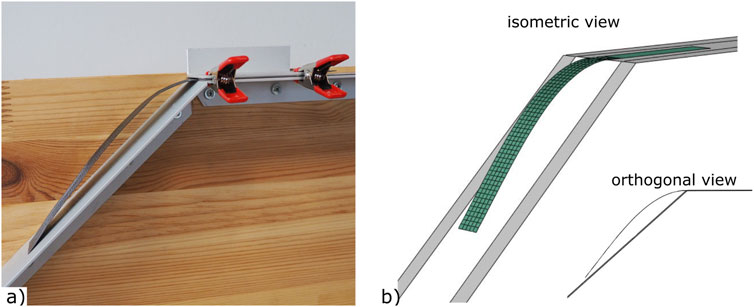
FIGURE 2. (A) Modified free-fall cantilever beam bending test and (B) representative FE results of the calibrated model.
Single ply specimen (0°: 25 × 350 mm, n = 6 for instant and n = 6 for long-term; 90°: 25 × 30 mm, n = 6 for instant and long-term) were placed with varying overhanging sections until the minimal length was found for the specified time. The result was considered reliable when the outcome could be repeated for six consecutive specimens. Preliminary tests were performed to narrow down the bending length.
A test setup inspired by ISO 8295 with a carrier system (200 g sled) is used for friction testing. Single-ply specimens (60 × 60 mm, n = 6 for each configuration) are used and tested at 100 mm/min test speed. All occurring contact pairs (tool with release agent Frecote 700-NC, 0° and 90° ply, membrane, PTFE separation film) involved in the single diaphragm preform process are tested in and transverse to the fiber direction, resulting in a total of 10 configurations.
The test-data-based *FABRIC material model in ABAQUS/explicit requires the stressF02Dstrain behavior for both structural directions in tension and compression, as well as shear properties. The model is readily available in ABAQUS, but cannot be selected via the CAE interface but must be assigned by editing the input file. This material model can be adjusted to mimic the behavior of a broad spectrum of materials because the directional properties can be altered independent of each other, despite being originally designed for woven fabrics. In the case of UD prepregs, one yarn direction is governed by the mechanical properties of the fiber and the other by the properties of the uncured resin.
Because the uncured resin provides almost no structural support to the prepreg, even small compressive loads cause buckling effects, posing a challenge to determine compressive properties experimentally. Thus, it is recommended to use a compressive behavior which reinstates stiffness after a short range of very small resistance near zero (Abaqus 6.11-1, 2021). This is modeled with a bilinear approach, indicated as path 1 in Figure 3. There is an initial step with a small stiffness up to a critical strain value, followed by a section with significantly higher stiffness. As such the compressive behavior in the *FABRIC model is crucial for modeling the bending behavior.
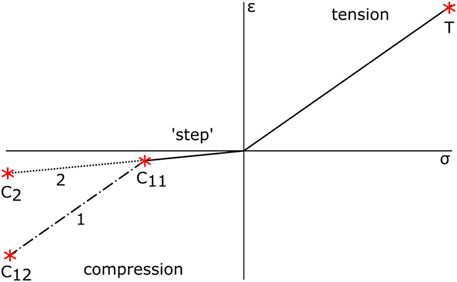
FIGURE 3. Schematic of the tension-compression nonlinearity in fiber direction to model the bending behavior. The highlighted points T, C11, C12, and C2 indicate the points specified in the input file.
To determine the input parameters, we used a purely phenomenological approach to match the experimentally determined bending length with our simulation (cf., Figure 2B). The definition of the initial step in compression direction is freely selectable by the operator and was adjusted until the bending test simulation matched experimental results. Additionally, we tried an alternative approach to adjust the bending properties by just using a linear approach with a reduced stiffness for the compression phase, i.e., without reinstating the stiffness (cf., path 2 in Figure 3).
The transverse shear stiffness is derived from the shear modules by applying a shear correction coefficient (typically 5/6 for isotropic materials (Abaqus, 2021a)). Determining an approximated mean value for the shear stiffness and assuming a coefficient of 5/6 resulted in
The test-data-based *FABRIC material model can either capture non-linear elastic behavior considering rate dependency or damage, i.e., softening of the unloading path, or non-linear plastic deformations.
In light of the strong rate dependency of the transverse and shear properties, we decided to include this aspect and neglect the others. This decision also strongly depends on the modeled application. Since we aim to simulate a manufacturing process, the effect of damage under repetitive loading and plastic deformations, i.e., deformations exceeding save strain limits, can be neglected because those scenarios shall be avoided for manufacturing.
Friction properties were found to be anisotropic and were modeled accordingly. *FABRIC requires the use of ABAQUS/explicit and thus, a workaround by editing the input file has to be used for implementation. First, the use of the general contact option is mandatory. Then individual property assignment for surface pairs can be defined. Both static (slip rate 0) and dynamic (corresponding to 100 mm/min) friction coefficients for the respective surface pair are defined as Coulomb friction within the CAE interface. However, an additional surface property assignment can be added, which enables to assign an orientation for frictional preference in ABAQUS/explicit (Abaqus, 2021b). This option uses an elliptical friction distribution on the defined surfaces, capturing the two preferred directions. The detailed interactions between anisotropic friction pairs can further be adjusted with weighting and summation options (Abaqus, 2021c).
For experimental comparison, a generic double sine tool is used (245 × 245 × 90 mm, Figure 4A). For the single diaphragm forming station, a tenter frame concept was developed, enabling reproducible and exact positioning of the blanks. The concept consists of a frame (with a separate seal on the lower side and a sealing surface on the upper side), placed slightly beneath the membrane frame (Figures 4A,B). The experiments are performed with prepreg sheets of 260 × 220 mm. The 0° fiber direction is aligned with the direction of the movable struts, as shown in Figure 4A and the position is centered above the tool. A 25-µm PTFE separation film is used to prevent sticking of the prepeg blank to the membrane. In open condition, the blank and the separation film are held in place on adjustable (along fiber direction) metal strips by neodym magnetic strips. The position in cross-fiber direction is adjusted with two movable struts. The magnetic strips are placed in each corner of the blank, whereas each magnet applies a pressure of ∼0.06 MPa on 1 cm2 contact area (estimated according to the datasheet).
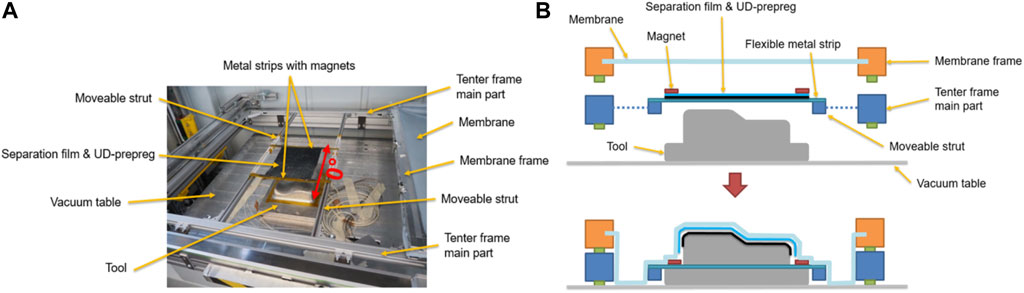
FIGURE 4. (A) Experimental setup at the diaphragm forming machine prior to the forming step, (B) schematic cross-section view prior and during the forming step.
To initiate forming, the membrane frame moves from its parking position lateral, until it is above the tooling. Then it moves down with the tenter frame until they reach the table and vacuum is applied (Figures 4B, 5A). During forming, the blank slips out of the magnetic clamps. Immediately after the preforming process, the separation film is removed and the preform geometry is scanned (Figures 5B,C) with a portable RS6 laser scanner system mounted on a Romer Absolute-Arm 85 (Hexagon). Additionally, sections of the tooling are scanned to allow for precise alignment of measured and reference geometry in the evaluation software.
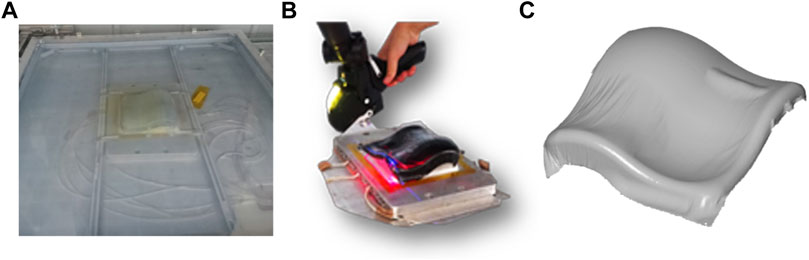
FIGURE 5. (A) Forming step with vacuum application at the diaphragm machine, (B) 3D scanning of the deformed double sine geometry immediately after the forming step, (C) 3D scan data.
A schematic view of the FE model is shown in Figure 6. The draping simulation of the UD prepreg was modeled in ABAQUS/explicit (CAE 2019) using the test-data-based *FABRIC material model and shell elements. The flexible parts of the fixation system (metal strips with magnets, c.f. Figure 4) and the separation film are modeled as linear elastic materials and the membrane with a second order hyperelastic Ogden model (Ogden, 1973). The material parameters, element types, and element size ranges are specified in Table 1. An element size of 5 mm for the prepreg showed a good compromise of resolution and computational cost and was considered sufficient (Chen et al., 2017). Reducing the size of the element to 2.5 mm resulted in a more detailed expression of wrinkles, but provided no additional information about the forming result beyond that, while increasing the simulation time four-fold.
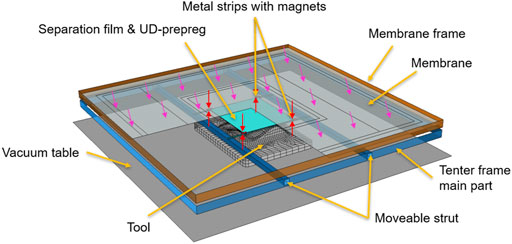
FIGURE 6. Schematic FE model of the single diaphragm forming process. A quadrant of the membrane is removed to have a better view onto the layup, the clamping system, and the tool. Magnetic clamping pressure is indicated with red darts. Vacuum pressure is indicated with pink darts.
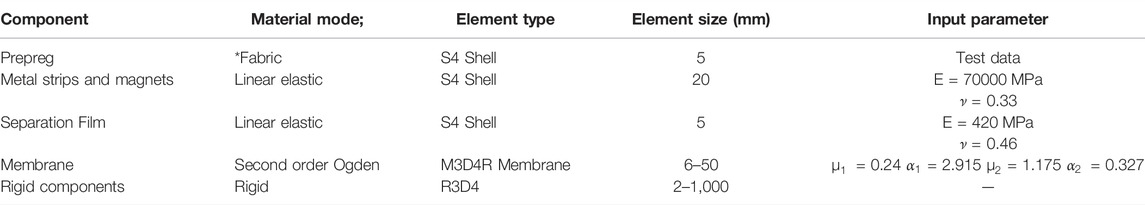
TABLE 1. Model specifications.
The flexible fixation system was modeled with aluminum properties, despite being steel, to increase the stable time increment and thus, significantly reduce computation time. This change results in neglectable deviations of the final part contour. The size of the membrane elements is adjusted locally, transitioning from a fine (6 mm) mesh in the proximity of the composite sheet and a coarse mesh (up to 50 mm) in the periphery. The remaining components are modeled as rigid bodies. The element size was adjusted depending on the required local level of detail, e.g., the radii of the tool are modeled with 2 mm elements, while the vacuum table is modeled with a single 1,000 mm element. The material and model specifications are summarized in Table 1. All computations are performed on a workstation with an Intel Xeon Gold 6146 CPU, with 96 GB DDR4 RAM, distributed over 12 cores with Abaqus. The simulation is executed with three steps, i.e., 1) initialization, 2) downward movement of the frame, and 3) vacuum application.
The interaction of the magnetic clamping system with the blank is modeled with cylindrical connector sections between the magnets and the metal strips. Clamping pressure (as defined in the experimental setup) is applied from the top of the magnets and from reverse direction on the metal stripes in order to clamp the UD-prepreg plies and the separation film in between (red arrows Figure 6). Gravity is applied throughout the simulation and a vacuum pressure of 0.096 MPa is applied during the vacuum step. Mass-scaling with up to 30% weight increase is used to reduce computation time.
To better understand the effect of the different modeling approaches for various aspects of the problem on the outcome of the draping simulation, a sensitivity analysis was performed. An overview of the investigated variations is given in Table 2. The setup that was considered to have the best outcome and thus, serve as a benchmark for comparison, is underlined.
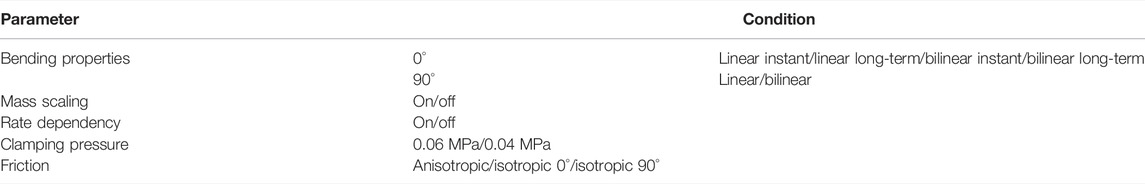
TABLE 2. Investigated modeling approaches. Benchmark setting is underlined.
To verify the accuracy of our simulation, we compare the shape of the virtually draped ply with scans of the experiments (cf., Figures 5B,C) and the designed tooling using Control X (V2020.1, Geomagic). Further, comparing the simulated shapes generated by altering the simulation parameters against the benchmark simulation allows us to quantify their effect on the outcome. The scanned point clouds of the draping experiments are meshed with triangular elements, i.e., an STL is created, within Control X. The simulation results are exported to STL from ABAQUS. The tooling coordinate system serves as a reference for the simulation, providing an ideal alignment for comparison. To align the scans of the experiments with the reference tooling geometry, only sections not covered by the ply are considered for the best-fit. To calculate the deviation of the different experiments and simulations, the function 3D Compare is used. This allows us to efficiently quantify the position and magnitude of bridging and wrinkles. Additionally, we extract the contour line of simulation and experiments and compare it using Curve deviation to visualize the agreement of the 3D edge indentation. A tolerance field of ± 0.5 mm is chosen as allowable deviation, i.e., colored green in the subsequent result plots, in order to compensate slight deviations from the alignment process and the discretization error from meshing the surfaces.
Due to slight inhomogeneities in the raw material, the longitudinal tensile strength varied between 800 and 1,090 MPa (895 ± 95 MPa, mean ± STD) at a fracture strain of 0.83 ± 0.16%. No significant rate dependency was observed and thus, all speeds were pooled (Figure 7A). The mean stress and strain serve as modeling input. The mechanical response transverse to fiber direction was both strongly non-linear and rate-dependent (Figure 7B). Peak stress values were three orders of magnitude smaller than in fiber direction. Fracture of the prepreg typically occurred at ∼60% strain and data are cut off accordingly. Each curve is represented by 20 points, distributed over the curve depending on the local slope, which serves as input for the *FABRIC model.
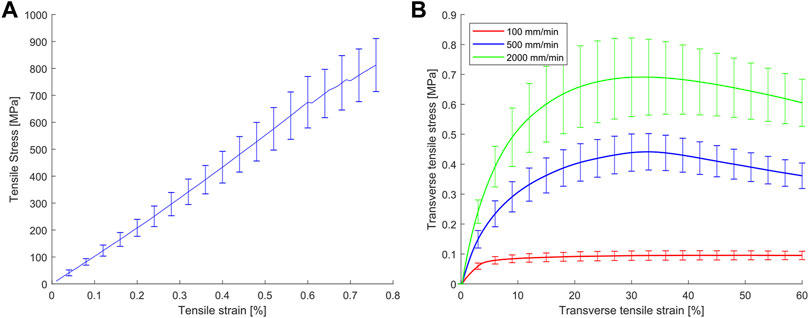
FIGURE 7. (A) Longitudinal and (B) transverse tensile stressF02Dstrain curves of uncured HexPly® M79/34%/UD300/CHS prepreg.
The average rate-dependent stressF02Dstrain response of the membrane is shown in Figure 8. Modelling with the coefficient-based hyperelastic odgen model of second order without viscoelastic properties in ABAQUS, unfortunately, does not allow for rate dependency. Therefore, the test data at 2000 mm/min, which is closest to the process speeds, is considered for the simulation and resulted in the fitting parameters µ1 = 0.24, α1 = 2.915, µ2 = 1.175, α2 = 0.327 (R2 = 0.998).
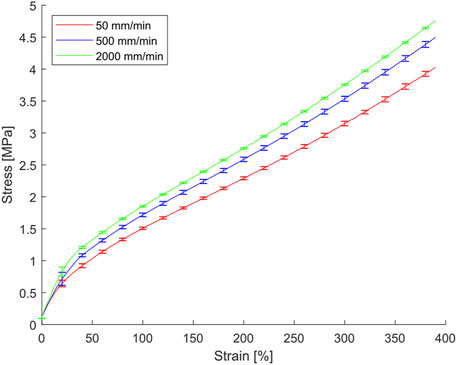
FIGURE 8. Rate-dependent stress F02D strain curves of the MS2-3 silicone membrane.
The average rate-dependent in-plane shear response is shown in Figure 9. Starting at approximately 10% shear strain, out-of-plane buckling of the specimen became dominant and as a consequence data are cut off, as it no longer represents the required deformation mode.
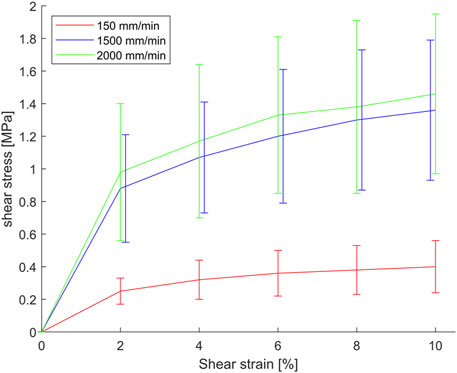
FIGURE 9. Rate-dependent shear stress F02D strain curves of uncured HexPly® M79/34%/UD300/CHS prepreg.
For the immediate response, an experimental bending length of 240 mm longitudinal and 10 mm transverse to fiber direction is measured. For the long-term response, the bending length was reduced to 140 mm in fiber direction and remained virtually unchanged at 8–10 mm in transverse direction. The input parameter to match the experimental results with the iterative calibration procedure is listed in Table 3. The compression behavior in the transverse direction is modeled analogous to the non-linear behavior in tension. Thus, point C12 represents the first value of the tension curve and 19 more points, to describe the non-linear behavior, follow.
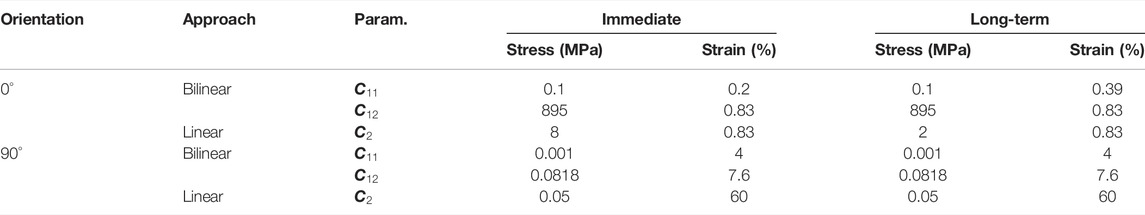
TABLE 3. Input values to describe the bending properties for the bilinear and linear modeling approach (cf., Figure 2). The immediate and long-term responses for the 90° orientation are identical.
The results for static and dynamic friction coefficients are shown in Figure 10. Friction testing between two plies of prepreg results in mean static friction coefficients above 20 and mean dynamic coefficients above 3. Thus, a tied connection between plies in a laminate stacks can be assumed during the diaphragm forming process. Hence, only friction at the interface to the tooling and the separation film are relevant for the forming simulation. In the dynamic stage of the friction test, the coefficients were typically much lower and a pronounced stick-slip-effect occurred for friction pairs with prepreg involved. This led to mechanical damage in some specimens, i.e., deviation of the fibers or accumulations of resin and those specimens were excluded from the analysis. In these cases, the specimen size was increased to ensure at least six valid experiments. All contact pairs not specified in Figure 10 are assumed to have a static and dynamic coefficient of friction of 0.3.
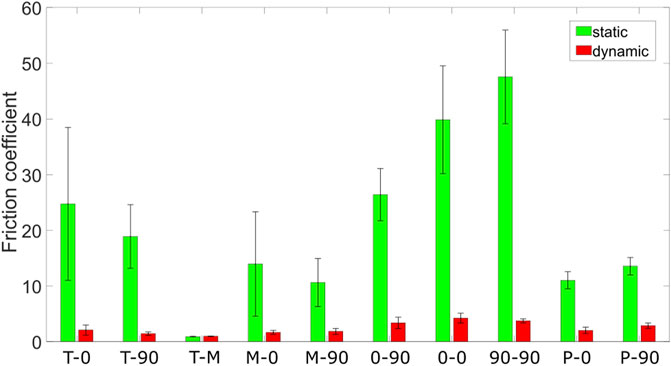
FIGURE 10. Static and dynamic friction coefficients for the individual contact pairs occurring in the single diaphragm process: Tool (T), Membrane (M), Ply-0° (0), Ply-90° (90), and PTFE film (P).
The procedure described in the experimental setup and the process model leads to a forming simulation (cf., underlined settings in Table 2), which is used as a benchmark to investigate the effect of modifications to critical simulation aspects. In all plots, the fiber direction (0°) is aligned with the X-coordinate, i.e., along the horizontal axis. The plots in Figures 11A,B show the deviation of the respective draping geometry obtained from the experiment and the benchmark simulation, compared with the tooling geometry. Areas, where the ply is directly in contact with the tool, are colored green, positive and negative deviations red and blue, respectively.
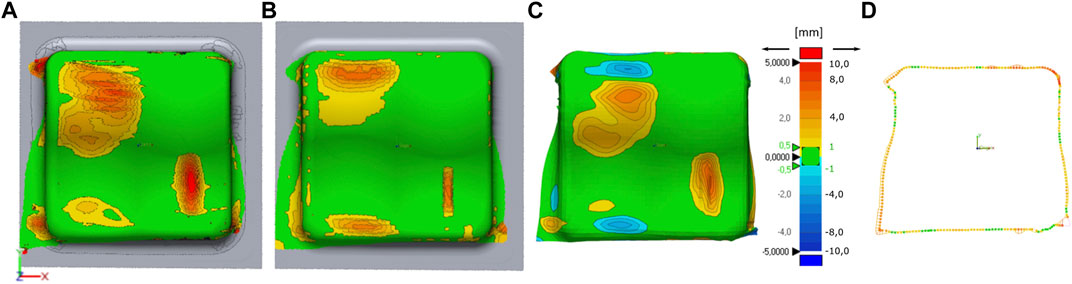
FIGURE 11. 3D comparison of forming results from (A) the experiment against the tool, (B) the benchmark simulation against the tool, (C) direct comparison of experiment and benchmark simulation and (D) the deviation between the contour of the experiment and the benchmark simulation. The distance between the experiment and simulation is color coded, where green areas are ±0.5 (1) mm, yellow to red areas are > + 0.5 (1) mm, and blue areas < −0.5 (1) mm apart for (A–C) and (D), respectively.
Similar phenomena are visible in both figures, i.e., bridging areas in the upper and lower left corners and a big vertical wrinkle in the lower right corner. Figure 11C provides a direct 3D comparison of the simulated and experimental ply geometries using the simulation geometry as reference. On the upper left side, the simulation underestimates the extent of the bridging (positive deviation, i.e., red area) and on the lower left side the extent is slightly overestimated (negative deviation, i.e., blue area). Magnitude and the extent of the wrinkles are both underestimated in the simulation (red area). The average deviation of the edge contour (cf., Figure 11D) is 1 mm with a standard deviation of 2 mm and localized maximum deviations of ±11 mm.
The following figures display a comparison of the experiment with simulations, where selected critical simulation aspects are adjusted to investigate their effect, respectively, and their importance for the simulation result. The 3D comparison in Figure 12 shows the deviations occurring for different investigated bending stiffness calibration methods. The bending stiffness of the benchmark simulation is modeled with a linear approach with reduced stiffness and the long-term bending response (short bending length), which leads to the softest configuration and represents a lower bound for the bending stiffness. As displayed in Figure 12A, the immediate response (increase in bending length) leads to a better mapping of the bridging extent in the upper left corner and a slight shift of the wrinkle position in the lower right corner. The disadvantage of the immediate response is depicted in the lower-left corner, where a slight increase of the edge indentation is visible, due to the stiffer bending behavior. Thus, bending stiffness calibration with reduced compression strength and the immediate response can be regarded as an upper bound. The two variants, which reinstate stiffness after a small step near zero (see Figures 12B,C), overestimate the extent of the bridging area by far. For these variants, the wrinkle in the lower right corner is shifted far-right and changes into a bridging area. Further, bridging occurs at the lower right edge, indicating that the bending stiffness is too high. Therefore, we cannot recommend to use the bending stiffness calibration method suggested by the ABAQUS documentation in fiber direction. As displayed in Figure 12D, a change of the calibration method to the bilinear approach in the transverse fiber direction has only minor impact on the forming result.
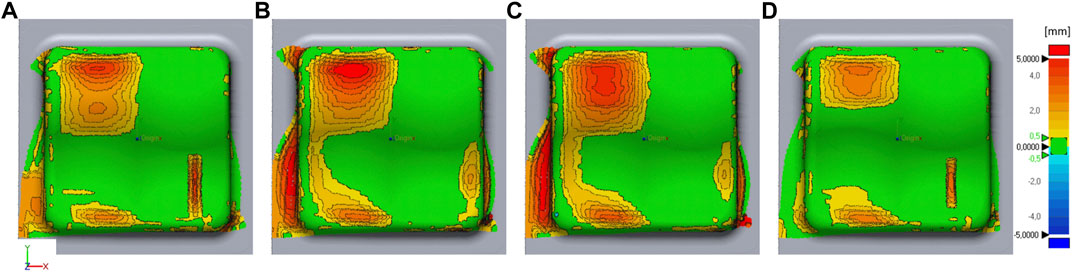
FIGURE 12. Effects of bending calibration methods plotted against the benchmark simulation; (A) linear immediate, (B) bilinear long-term, (C) bilinear immediate response in fiber direction with a linear approach for the transverse direction and (D) linear long-term in the fiber direction and bilinear step for the transverse direction. The distance between the benchmark simulation (reference) and modified simulation is color coded, where green areas are ±0.5 mm, yellow to red areas are > + 0.5 mm, and blue areas < −0.5 mm apart.
Figure 13A shows the impact on the simulation if rate-dependency is omitted and properties from the slowest test speeds are used. The extent of the bridging area in the upper left corner is depicted slightly better than in the benchmark simulation, but the magnitude is overestimated. However, the most important deviation for this variant appears along the upper edge contour and the upper right corner, where a continuous deviation of the edge with up to 8 mm appears due to the soft properties.
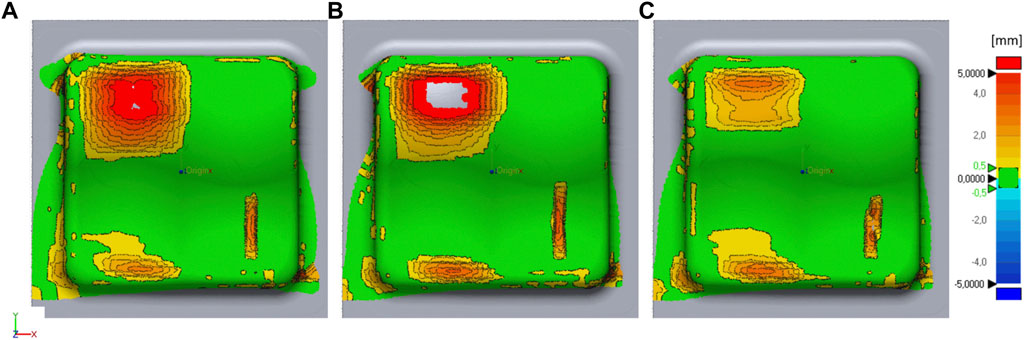
FIGURE 13. Effects of (A) omitted rate dependency, (B) omitted mass scaling, (C) lower clamping pressure at the fixation points plotted against the benchmark simulation. The distance between the benchmark simulation (reference) and modified simulation is color coded, where green areas are ±0.5 mm, yellow to red areas are > + 0.5 mm, and blue areas < −0.5 mm apart.
Figure 13B shows the forming result without mass-scaling. The big advantage of mass-scaling, up to 30%, is a reduction of the computation time by a factor of 7. The extent of the bridging area and the vertical wrinkle in the lower right corner are depicted slightly more accurately than in the benchmark simulation, however, the magnitude of the bridging is overestimated even more. The edge indentation is not affected by this change. Thus, the reduction of the computation time clearly outweighs the improvement of the depicted bridging area.
Figure 13C shows the impact of reduced magnetic clamping pressure on the blank from 0.06 to 0.04 MPa. This parameter is derived from the datasheet and dependent on the exact position of the magnets. Thus, a slight variation of the magnet positions is investigated. This change mainly leads to a reduction of the bridging magnitude in the upper left corner and to a slight shift of the wrinkle in the lower right corner, while the overall edge indentation is not affected.
The benchmark simulation uses anisotropic friction behavior, which affects the contacts between tool and prepreg and between the PTFE separation film and the prepreg. Figure 14 shows the discrepancy occurring if simple isotropic friction models are used instead with friction properties measured either in fiber direction or transverse to fiber direction.
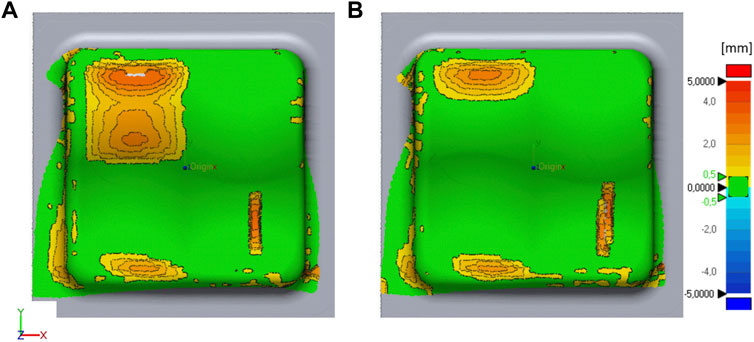
FIGURE 14. Effects of (A) isotropic friction based on properties in fiber direction, (B) isotropic friction based on properties transverse to fiber direction plotted against the benchmark simulation. The distance between the benchmark simulation (reference) and modified simulation is color coded, where green areas are ±0.5 mm, yellow to red areas are > + 0.5 mm, and blue areas < −0.5 mm apart.
Apparently, the position of the vertical wrinkle in the lower right corner is not affected if isotropic properties in fiber direction are considered but is shifted rightward if transverse friction properties are applied. This leads to the conclusion that the exact position of this vertical wrinkle depends not only on the bending behavior and the clamping situation but to a certain amount also on frictional properties transverse to the fiber direction. The frictional properties also play an important role in the magnitude and the extent of the big bridging area in the upper left corner, where high frictional properties in fiber direction enlarge the extent and the magnitude while lower transverse isotropic friction properties reduce it.
The presented work investigated the use of the built in *FABRIC material model in ABAQUS/explicit for application in draping simulations of a single diaphragm process with UD semi-finished prepreg. A roadmap for possible testing procedures to obtain the required material parameters was demonstrated. Additionally, different ways to approximate the bending behavior and other modeling aspects were quantitatively compared.
Several limitations of this material model are documented in the recent literature. For example, it cannot capture the interaction between tension and shear properties or non-orthogonal bending (Kärger et al., 2020). Further, it is not possible to consider the impact of large shear deformations on the anisotropic bending behavior due to the decoupling from tensile properties. This fact implies that only single-ply modeling with approximated bending properties is feasible (Dörr et al., 2017), increasing the modeling expense for multiply laminates. The used element size of 5 mm represents a compromise of computational time and resolution and limits the capability of predicting fine wrinkles and folds (ten Thije and Akkerman, 2009). Overall, the phenomenological nature of the model and the broad adjustability allow to compensate these shortcomings and accurate forming simulations could be performed for the investigated use case.
Comparing the quality of forming simulation results throughout the literature is quite challenging, on one side due to the lack of standardized quality metrics and on the other side due to the different materials, textile types, and layups in use. The increased availability of 3D scanning hardware, e.g., laser scanning or structured light systems, might help to improve the comparability, by means of the presented comparison against the tooling geometry to visualize bridging and folds. Other metrics such as the edge contour deviation are readily available after scanning the entire surface of the part. This allows a qualitative comparison to the benchmark study by Dörr et al. (2017) (Dörr et al., 2017) for forming simulations of a UD thermoplastic material, performed with various solvers. They reported a deviation of ±20 mm to the experiment. Other studies found similar results with the PAM-FORM solver, evaluated at a few individual points along the edge (Margossian, 2017). The edge contour presented in the result section is within the same range, thus underlining the potential of the *Fabric for UD materials. However, on one side more experimental work with different geometries and on the other side comparison against results from other simulation software have to be conducted to evaluate the performance conclusively. Another major quality criterion for forming simulations is the formation of wrinkles. A visual inspection procedure was described in Chen et al. (2017) (Chen et al., 2017), and applied to a non-orthogonal model for NCF (Chen et al., 2016), implemented as a subroutine in ABAQUS. Those aspects, i.e., the amount and position of macro-wrinkles can be accurately captured by our presented approach. An automated approach to analyze wrinkles based on analyzing the local curvatures, by Joppich (2019) (Joppich, 2019), provides even more details on small defects. Using a combination of membrane and shell elements allows them to accurately capture the local bending behavior. The *FABRIC approach is limited in this case due to the material model and the element types, affecting the depiction of the bending behavior. Even very fine mesh discretization cannot compensate this drawback. Thus, it depends on the required level of detail, if the presented approach is sufficient.
The diaphragm forming process was performed at ambient temperature. Thus, a characterization of the material properties at elevated temperatures was not necessary. However, many aspects of the material response, e.g., the shear response (Wang et al., 2020) or the frictional properties (Sun et al., 2012; Zhao et al., 2020), show a temperature dependency. Therefore, previous studies reported that the temperature dependency of the material has a critical impact on the forming results (Potter, 2002; Wang et al., 2020). This temperature dependency could be modeled with the *FABRIC material; however, it would significantly increase the testing effort. No detailed mechanical data, required for the forming simulation, of the HexPly® M79/34%/UD300/CHS is, to the authors’ best knowledge, available in the literature. Therefore, we tested a HexPly® 8,552/IM7 in the 10° off-axis setup, to validate the testing procedure and could successfully recreate published stress F02D strain curves (Wang et al., 2017; Wang et al., 2020). The mechanical properties in fiber direction are mainly driven by fiber properties and as such they are not expected to vary with strain rates. Furthermore, this value is often scaled to a certain extent in order to control the explicit time increment (Margossian, 2017). Concerning transverse tension, the properties of different carbon prepreg systems published in Leutz (2016) and Margossian et al. (2016) determined at temperatures of 65, 5, and 60°C, respectively, show a similar course of the stress strain curves on an expectable lower stress level due to higher temperatures and a slower pulling velocity of 50 mm/min. This comparative data also provides confidence for the determined data of HexPly® M79/34%/UD300/CHS at ambient temperature. Finally, comparative data for the tensile properties of the silicone membrane is reported in Chen et al. (2017) for a membrane with lower thickness and similar shore hardness, which supports the validity of our test data. The described modified cantilever beam bending test, i.e., the free-fall test, allows to test the tacky prepregs with a procedure that can be easily recreated in FEM to efficiently calibrate the model. Preliminary experiments led to the definition of the two thresholds for the immediate and long-term response and, as a consequence, provide and upper and lower bounds for the bending length in fiber direction. In the transverse direction, we found no dependency on the investigated time-scales. The soft material bent immediately with a much shorter bending length. To provide a reliable calibration, it is critical to use the same simulation parameters, e.g., mass scaling, element size, damping, as in the actual forming simulation. An additional factor, which can affect the bending behavior when using the *FABRIC material model with shell elements, is the transverse shear stiffness. As mentioned, this parameter is derived from experimental shear data by multiplying a shear correction factor. The non-linear behavior under shear and potentially different correction factors required for composite materials result in a range of potential values for the transverse shear stiffness. Therefore, we performed a sensitivity analysis and found no significant impact on the bending response for values between 1 and 100, i.e., varying the values by one order of magnitude. Thus, the influence of transverse shear stiffness was not considered for iteratively adjusting the bending stiffness in the presented model. This assumption might not be valid for other material types or for applications at a higher temperature. Typically, the influence of gravity is neglected in draping simulations (Haanappel, 2013; Chen et al., 2017). However, we include it to accurately simulate the slight sag of the semi-finished prepreg and the membrane, as this greatly impacts the point of first contact. Due to the high coefficients of friction at ambient temperature, this point of initial contact is crucial for accurately simulating bridging and the formation of wrinkles. This further implies that we cannot modify the densities freely to accelerate the simulation (Margossian, 2017) but rather use the mass scaling option up to 30%.
The most important finding in our study was the impact of the bending behavior and thus, the calibration method, on the presented case with an UD thermoset prepreg. Studies on UD prepregs with a thermoplastic matrix and a QI-layup (Joppich, 2019) (Haanappel, 2013) also found that the bending behavior is favored over in-plane properties predicting criteria for the general forming behavior and wrinkle formation, followed by the shear behavior and the frictional properties. For woven fabrics and non-QI-layups on the other side, shear has been shown to be equally important to bending for the accuracy of the forming simulation and the ratio of shear and bending properties determining the occurrence of wrinkles (Boisse et al., 2011).
For the simulated case, reinstating the compressive stiffness after a short step with little stiffness (bilinear approach) overestimated the bending stiffness at both test configurations. Of course, a bilinear modeling approach could be enforced by extending the step but appears like an unnecessary modeling effort in light of our results. Modelling the anisotropic friction, a feature not readily available in Abaqus CAE, was less critical to the outcome than the bending behavior but the effect on the final shape, i.e., the position of wrinkles and the height of birding areas, was not neglectable. Thus, we do recommend considering it, despite the additional modeling and experimental effort. The rate dependency, mainly affecting the transverse (resin dominated) direction, had a major impact on the final edge contour and should be considered. Variations of the clamping force in the investigated range and of the given magnetic clamping mechanism, designed to let the prepreg slip out, appear neglectable. This suggests that slight heterogeneities in the experimental setup do not reduce the repeatability of our forming experiments.
However, this cannot be generalized and it is critical to accurately simulate the clamping or fixation of the prepreg (Lee et al., 2007; Chen et al., 2015; Chen et al., 2018). Variations of this modeling aspect might have a greater impact on less flexible clamping systems.
To further investigate and confirm the applicability of the *FABRIC material model for forming simulations with UD prepregs a more detailed validation is required. On one side, the accuracy of the local fiber angle and on the other side, the performance for different layups should be investigated. In light of the phenomenological nature of the material characterization and modeling, especially for the bending and transverse shear properties, a detailed investigation to determine the limitations of this material model is required. The presented work covers several important simulation and modeling parameters (bending calibration, rate dependency, anisotropic friction, mass scaling, and clamping) provide an overview about the impact and the necessity of these parameters for draping simulations carried out with the *FABRIC material model.
The raw data supporting the conclusion of this article will be made available by the authors, without undue reservation.
JO and FM carried out the mechanical testing, data processing, and experimental work for validation of the simulation. JO built the process model. RH supervised the project. All authors discussed the results and contributed to the final manuscript.
We thank our funding source, the Austrian Research Promotion Agency (FFG), for supporting us in the project ProSim (866878).
The authors declare that the research was conducted in the absence of any commercial or financial relationships that could be construed as a potential conflict of interest.
All claims expressed in this article are solely those of the authors and do not necessarily represent those of their affiliated organizations, or those of the publisher, the editors and the reviewers. Any product that may be evaluated in this article, or claim that may be made by its manufacturer, is not guaranteed or endorsed by the publisher.
Abaqus 6.11-1 (2021). Abaqus 6.11-1 Analysis User’s Manual, 22.4.1 Fabric Material Behaviour. Available online: http://130.149.89.49:2080/v6.11/books/usb/default.htm?startat=pt05ch22s04abm34.html (accessed on Nov 22, 2021).
Abaqus (2021b). Abaqus Online Documentation (*SURFACE PROPERTY ASSIGNMENT). Available online: https://abaqus-docs.mit.edu/2017/English/SIMACAEITNRefMap/simaitn-c-surfacepropassign.htm (accessed on Nov 22, 2021).
Abaqus (2021c). Abaqus Online Documentation (Frictional Behavior). Available online: https://abaqus-docs.mit.edu/2017/English/SIMACAEITNRefMap/simaitn-c-friction.htm (accessed on Nov 22, 2021).
Abaqus (2021a). Abaqus Online Documentation (Shell Section Behavior). Available online: https://abaqus-docs.mit.edu/2017/English/SIMACAEELMRefMap/simaelm-c-shellsectionbehavior.htm.
Ahmad, S., Irons, B. M., and Zienkiewicz, O. C. (1970). Analysis of Thick and Thin Shell Structures by Curved Finite Elements. Int. J. Numer. Meth. Engng. 2, 419–451. doi:10.1002/nme.1620020310
Alshahrani, H., and Hojjati, M. (2017). Experimental and Numerical Investigations on Formability of Out-Of-Autoclave Thermoset Prepreg Using a Double Diaphragm Process. Composites A: Appl. Sci. Manufacturing 101, 199–214. doi:10.1016/j.compositesa.2017.06.021
Bersee, H. E. N., Lindstedt, S., Niño, G., and Beukers, A. (2007). “Diaphragm Forming of Thermoset Composites,” in Proceedings of the ICCM International Conferences on Composite Materials.
Bian, X. X., Gu, Y. Z., Sun, J., Li, M., Liu, W. P., and Zhang, Z. G. (2013). Effects of Processing Parameters on the Forming Quality of C-Shaped Thermosetting Composite Laminates in Hot Diaphragm Forming Process. Appl. Compos. Mater. 20, 927–945. doi:10.1007/s10443-012-9310-7
Boisse, P., Bai, R., Colmars, J., Hamila, N., Liang, B., and Madeo, A. (2018). The Need to Use Generalized Continuum Mechanics to Model 3D Textile Composite Forming. Appl. Compos. Mater. 25, 761–771. doi:10.1007/s10443-018-9719-8
Boisse, P., Colmars, J., Hamila, N., Naouar, N., and Steer, Q. (2018). Bending and Wrinkling of Composite Fiber Preforms and Prepregs. A Review and New Developments in the Draping Simulations. Composites B: Eng. 141, 234–249. doi:10.1016/j.compositesb.2017.12.061
Boisse, P., Hamila, N., Vidal-Sallé, E., and Dumont, F. (2011). Simulation of Wrinkling during Textile Composite Reinforcement Forming. Influence of Tensile, In-Plane Shear and Bending Stiffnesses. Composites Sci. Technology 71, 683–692. doi:10.1016/j.compscitech.2011.01.011
Chen, S., Harper, L. T., Endruweit, A., and Warrior, N. A. (2015). Formability Optimisation of Fabric Preforms by Controlling Material Draw-In through In-Plane Constraints. Composites Part A: Appl. Sci. Manufacturing 76, 10–19. doi:10.1016/j.compositesa.2015.05.006
Chen, S., McGregor, O. P. L., Endruweit, A., Elsmore, M. T., De Focatiis, D. S. A., Harper, L. T., et al. (2017). Double Diaphragm Forming Simulation for Complex Composite Structures. Composites Part A: Appl. Sci. Manufacturing 95, 346–358. doi:10.1016/j.compositesa.2017.01.017
Chen, S., McGregor, O. P. L., Harper, L. T., Endruweit, A., and Warrior, N. A. (2016). Defect Formation during Preforming of a Bi-axial Non-crimp Fabric with a Pillar Stitch Pattern. Composites Part A: Appl. Sci. Manufacturing 91, 156–167. doi:10.1016/j.compositesa.2016.09.016
Chen, S., McGregor, O. P. L., Harper, L. T., Endruweit, A., and Warrior, N. A. (2018). Optimisation of Local In-Plane Constraining Forces in Double Diaphragm Forming. Compos. Structures 201, 570–581. doi:10.1016/j.compstruct.2018.06.062
Dörr, D., Brymerski, W., Ropers, S., Leutz, D., Joppich, T., Kärger, L., et al. (2017). A Benchmark Study of Finite Element Codes for Forming Simulation of Thermoplastic UD-Tapes. Proced. CIRP 66, 101–106. doi:10.1016/j.procir.2017.03.223
Dörr, D., Henning, F., and Kärger, L. (2018). Nonlinear Hyperviscoelastic Modelling of Intra-ply Deformation Behaviour in Finite Element Forming Simulation of Continuously Fibre-Reinforced Thermoplastics. Composites Part A: Appl. Sci. Manufacturing 109, 585–596. doi:10.1016/j.compositesa.2018.03.037
Haanappel, S. (2013). Forming of UD Fibre Reinforced Thermoplastics : A Critical Evaluation of Intra-ply Shear. Netherlands: University of Twente.
Haanappel, S. P., Ten Thije, R. H. W., Sachs, U., Rietman, B., and Akkerman, R. (2014). Formability Analyses of Uni-Directional and Textile Reinforced Thermoplastics. Composites Part A: Appl. Sci. Manufacturing 56, 80–92. doi:10.1016/j.compositesa.2013.09.009
Hamila, N., Boisse, P., and Chatel, S. (2009). Semi-discrete Shell Finite Elements for Textile Composite Forming Simulation. Int. J. Mater. Form. 2, 169–172. doi:10.1007/s12289-009-0518-5
Henning, F., Kärger, L., Dörr, D., Schirmaier, F. J., Seuffert, J., and Bernath, A. (2019). Fast Processing and Continuous Simulation of Automotive Structural Composite Components. Composites Sci. Technology 171, 261–279. doi:10.1016/j.compscitech.2018.12.007
Joppich, T. D. (2019). Beitrag zum Umformverhalten von PA6/CF Gelegelaminaten im nicht-isothermen Stempelumformprozess. Karlsruher Institut für Technologie.
Kärger, L., Galkin, S., Dörr, D., and Poppe, C. (2020). Capabilities of Macroscopic Forming Simulation for Large-Scale Forming Processes of Dry and Impregnated Textiles. Proced. Manufacturing 47, 140–147. doi:10.1016/j.promfg.2020.04.155
Lee, J. S., Hong, S. J., Yu, W.-R., and Kang, T. J. (2007). The Effect of Blank Holder Force on the Stamp Forming Behavior of Non-crimp Fabric with a Chain Stitch. Composites Sci. Technology 67, 357–366. doi:10.1016/j.compscitech.2006.09.009
Leutz, D. M. (2016). Forming Simulation of AFP Material Layups: Material Characterization, Simulation and Validation. Technische Universität München.
Liang, B., Colmars, J., and Boisse, P. (2017). A Shell Formulation for Fibrous Reinforcement Forming Simulations. Composites Part A: Appl. Sci. Manufacturing 100, 81–96. doi:10.1016/j.compositesa.2017.04.024
Margossian, A., Bel, S., and Hinterhoelzl, R. (2016). On the Characterisation of Transverse Tensile Properties of Molten Unidirectional Thermoplastic Composite tapes for Thermoforming Simulations. Composites Part A: Appl. Sci. Manufacturing 88, 48–58. doi:10.1016/j.compositesa.2016.05.019
Margossian, A. (2017). Forming of Tailored Thermoplastic Composite Blanks: Material Characterisation, Simulation and Validation. Technische Universität München.
Ogden, R. W. (1973). Large Deformation Isotropic Elasticity-On the Correlation of Theory and Experiment for Incompressible Rubberlike Solids. Rubber Chem. Technol. 46, 398–416. doi:10.5254/1.3542910
Pickett, A. K., Creech, G., and De Luca, P. (2005). Simplified and Advanced Simulation Methods for Prediction of Fabric Draping. Revue Européenne des Éléments Finis 14, 677–691. doi:10.3166/reef.14.677-691
Potter, K. (2002). In-plane and Out-Of-Plane Deformation Properties of Unidirectional Preimpregnated Reinforcement. Composites Part A: Appl. Sci. Manufacturing 33, 1469–1477. doi:10.1016/S1359-835X(02)00138-0
Schirmaier, F. J., Dörr, D., Henning, F., and Kärger, L. (2017). A Macroscopic Approach to Simulate the Forming Behaviour of Stitched Unidirectional Non-crimp Fabrics (UD-NCF). Composites Part A: Appl. Sci. Manufacturing 102, 322–335. doi:10.1016/j.compositesa.2017.08.009
Sun, J., Gu, Y., Li, M., Ma, X., and Zhang, Z. (2012). Effect of Forming Temperature on the Quality of Hot Diaphragm Formed C-Shaped Thermosetting Composite Laminates. J. Reinforced Plastics Composites 31, 1074–1087. doi:10.1177/0731684412453778
ten Thije, R. H. W., and Akkerman, R. (2009). A Multi-Layer Triangular Membrane Finite Element for the Forming Simulation of Laminated Composites. Composites Part A: Appl. Sci. Manufacturing 40, 739–753. doi:10.1016/j.compositesa.2009.03.004
Wang, Y., Chea, M. K., Belnoue, J. P.-H., Kratz, J., Ivanov, D. S., and Hallett, S. R. (2020). Experimental Characterisation of the In-Plane Shear Behaviour of UD Thermoset Prepregs under Processing Conditions. Composites Part A: Appl. Sci. Manufacturing 133, 105865. doi:10.1016/j.compositesa.2020.105865
Wang, Yi., Ivanov, Dmitry., Jonathan, P., Belnoue, H., James Kratz, B. C. K., and Hallett, S. R. (2017). “Experimental Characterisation of In-Plane Shear Behaviour of Uncured Thermoset Prepregs,” in Proceedings of the ECCM18 - 18th European Conference on Composite Materials (Athen), 7.
Yu, F., Chen, S., Viisainen, J. V., Sutcliffe, M. P. F., Harper, L. T., and Warrior, N. A. (2020). A Macroscale Finite Element Approach for Simulating the Bending Behaviour of Biaxial Fabrics. Composites Sci. Technology 191, 108078. doi:10.1016/j.compscitech.2020.108078
Yu, X., Cartwright, B., McGuckin, D., Ye, L., and Mai, Y.-W. (2006). Intra-ply Shear Locking in Finite Element Analyses of Woven Fabric Forming Processes. Composites Part A: Appl. Sci. Manufacturing 37, 790–803. doi:10.1016/j.compositesa.2005.04.024
Keywords: draping simulation, uncured prepreg, mechanical testing, diaphragm forming, fabric
Citation: Osterberger J, Maier F and Hinterhölzl RM (2022) Application of the Abaqus *Fabric Model to Approximate the Draping Behavior of UD Prepregs Based on Suited Mechanical Characterization. Front. Mater. 9:865477. doi: 10.3389/fmats.2022.865477
Received: 29 January 2022; Accepted: 23 March 2022;
Published: 20 May 2022.
Edited by:
Dmitry S. Ivanov, University of Bristol, United KingdomReviewed by:
Luise Kärger, Karlsruhe Institute of Technology (KIT), GermanyCopyright © 2022 Osterberger, Maier and Hinterhölzl. This is an open-access article distributed under the terms of the Creative Commons Attribution License (CC BY). The use, distribution or reproduction in other forums is permitted, provided the original author(s) and the copyright owner(s) are credited and that the original publication in this journal is cited, in accordance with accepted academic practice. No use, distribution or reproduction is permitted which does not comply with these terms.
*Correspondence: Franz Maier, ZnJhbnoubWFpZXJAZmgtd2Vscy5hdA==
Disclaimer: All claims expressed in this article are solely those of the authors and do not necessarily represent those of their affiliated organizations, or those of the publisher, the editors and the reviewers. Any product that may be evaluated in this article or claim that may be made by its manufacturer is not guaranteed or endorsed by the publisher.
Research integrity at Frontiers
Learn more about the work of our research integrity team to safeguard the quality of each article we publish.