 Peiyun She
 Jiajie Wang
 Zhiming Pang
 Cong Lu
- School of Civil Engineering, Southeast University, Nanjing, China
Strain Hardening Cementitious Composites (SHCC) are materials exhibiting high tensile ductility with the formation of multiple cracks. Since the mechanical properties of SHCC members are governed by the interfacial characteristics between fibers and matrix, understanding the mechanism of single fiber pullout behavior is crucial for SHCC material design. Existing model was set up based on Polyvinyl Alcohol (PVA) fibers, making it inapplicable to other kinds of synthetic fibers those exhibit divergent pullout behaviors. As a result, the simulated curves cannot agree well with the tested results of SHCC made with other fibers or hybrid fibers. In this study, a unified single fiber pullout model was proposed to take divergent kinds of fiber pullout behavior into account. Five parameters were defined to describe the single fiber pullout behavior, where the frictional strength during the pullout stage and the blocking length of fiber under pulley force were for the first time introduced. For verification purpose, fiber-pullout samples with Polyethylene terephthalate (PET) and PVA fibers were tested and the results agree well with the simulated curves from proposed model. The stochasticity of each parameters were then analyzed and described by normal distribution, through which fibers with various random pullout behaviors can be incorporated into a larger scale modelling. Therefore, the fiber-bridging constitutive law for a single crack was calculated and compared with the single crack test results, which confirmed again the validity of the proposed model.
Introduction
Due to the quasi-brittle nature, traditional cementitious materials are vulnerable to cracking (Li et al., 2003; Jun et al., 2006; Zhigang, 2020a). Hence, fibers are added to control the cracks and improve toughness (Graybeal, 2006). With moderate fiber content added, Strain Hardening Cementitious Composites (SHCC) was developed in the 1990s (Li and Leung, 1992; Li and Wu, 1992; Victor and Forii, 1993; Leung, 1996; Li et al., 2001; Li, 2011; Victor and Li, 2012; Zhigang, 2021), which exhibits strain hardening behavior accompanied by the formation of multiple cracks and ensures the high ductility and durability of the structure.
In order to explain the strain hardening behavior in SHCC, the design criterion for SHCC including fiber, matrix and interface parameters have been proposed by Li first (Victor and Li, 2012). The most fundamental property of SHCC is the fiber bridging constitutive law which can be derived from modeling a single fiber pullout behavior against the surrounding matrix. Since the initial fiber bridging constitutive law only considered the friction between fiber and matrix (Kanda and Li, 1998), new mechanisms of fiber/matrix interactions including slip hardening (Ochi et al., 2007), fiber rupture (Lin and Li, 1997), chemical bonding (Maalej et al., 1995) and two-way fiber debonding (Yang et al., 2008) were taken into account to improve the accuracy of crack opening prediction.
Above studies were mainly based on PVA fibers which exhibit high tenacity and good adhesion with cement. Flashbacking to the invention of SHCC in the 1990s, high-modulus polyethylene (PE) fibers were firstly used as the bridging fibers by Li et al. (Li, 1998), which are greatly more expensive than the other fibers. To reduce the high cost of fibers, SHCC with polyvinyl alcohol (PVA) fibers were introduced by Kanda and Li (Kanda and Li, 1998). However, its application in construction is limited because the price is still relatively high for large-scale construction use (Pan et al., 2015). Therefore, cheaper substitute for PVA fibers is strongly in demand. By far, there have been many studies with other inexpensive synthetic fibers such as Polypropylene (PP) fibers, Polyacrylonitrile (PAN) fibers and polyethylene terephthalate (PET) fibers (Pereira et al., 2012; Pakravan et al., 2016; Lu et al., 2018; Zhigang, 2020b). The properties of different fibers vary widely, and even the same kind of fibers show completely different properties due to the different surface treatment processes (Foti, 2016), which directly results in differentiated performance of fibers when they are pulled out from the matrix. For example, PE and PVA fibers exhibit strong slip hardening characteristic (Li, 1998; Pan et al., 2015), while PAN and PET fibers show clear slip softening trend (Pereira et al., 2012; Lu et al., 2018). Therefore, it is not enough to establish a single fiber pullout model exclusively for PVA fibers. A unified model needs to be developed to describe the single fiber pullout behavior of different fibers.
This paper aims at establishing a unified fiber bridging model of SHCC, applying to different kinds of fibers which may show different surface bonding properties. PVA fibers and PET fibers are taken as typical examples which show slip hardening and slip softening behavior, respectively. Modeling a single fiber pullout behavior against the surrounding matrix will be firstly conducted. Two new parameters including frictional strength during the pullout stage and the blocking length of fiber under pulley force are introduced to simulate the single fiber pullout behavior. In the following part, the stress-crack opening relation for a bridged crack is simulated based on the stochastic parameters derived from the single fiber pullout model. The revised fiber bridging model is then compared with the curve acquired from the experiment to confirm the validity.
Modeling of Single Fiber Pullout
Existing Theory
The pullout behavior of single fiber has been modelled in the literature (Lin and Li, 1997; Kanda and Li, 1999). In these existing models, when the fiber is subjected to a pullout force P, three stages are considered including elastic, debonding and pullout stage with different range of the slip S as shown in Figure 1. When the load is small, the local shear stress τ appears linear correlation with slip S and κ is the slope of the τ-S curve in elastic stage. When the shear stress exceeds the maximum shear strength
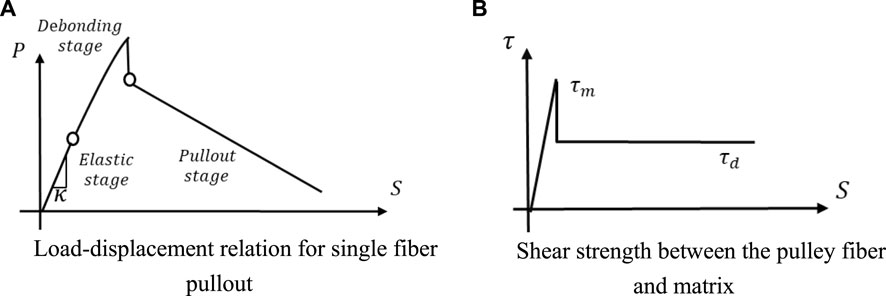
FIGURE 1. Load-displacement relation for single fiber pullout and shear strength diagram. (A) Load-displacement relation for single fiber pullout. (B) Shear strength between the pulley fiber and matrix.
The model is established based on the static equilibrium requirement (Naaman et al., 1991; Li et al., 2003), and the tensile force in the fiber F is transferred to the matrix M through the interface. This relationship expressed in the differential form is
where
When the fiber and matrix are fully bonded as shown in Figure 2A, the relationship between slip
where
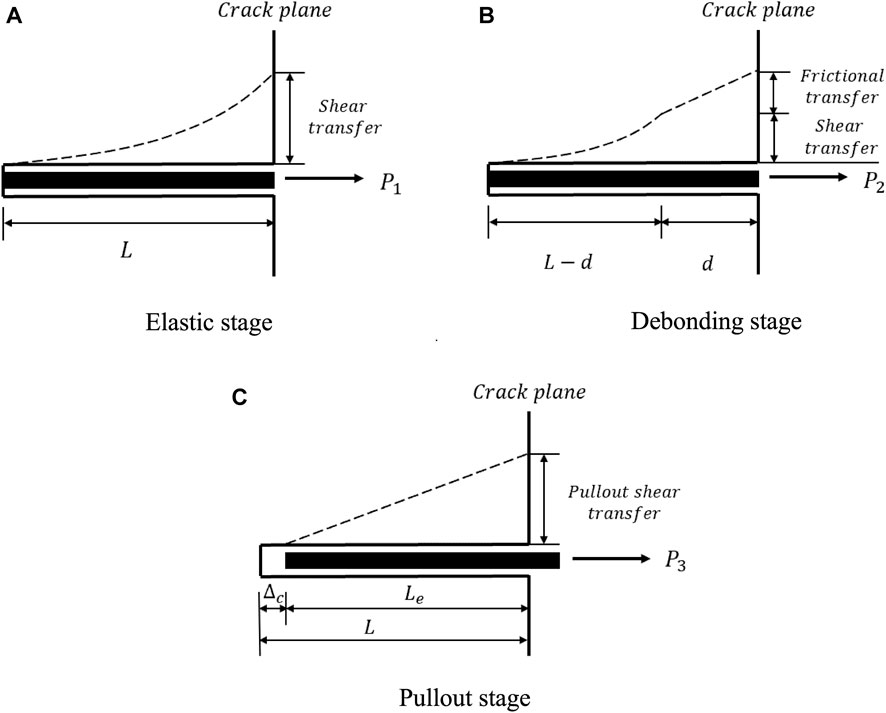
FIGURE 2. Schematic force distribution at fiber-matrix interface in different single fiber pullout stages. (A) Elastic stage. (B) Debonding stage. (C) Pullout stage.
When the shear stress exceeds the maximum shear strength
It is assumed that at the time the fiber is completely debonded, the shear resistance still remains
New Considerations in Single Fiber Pullout Stage
The above section illustrates the stress transfer via interface between the fiber and matrix when the fiber is being pulled out. However, due to the great divergency in the interface properties between various fibers, the previous model mentioned above cannot apply to different types of fibers. The limitations will be explained in detail in this section.
Limitation 1: Inconsistency of Frictional Strength During Different Fiber Pullout Stages
According to the above assumption, the frictional strength used in the debonding and pullout stages is the same parameter
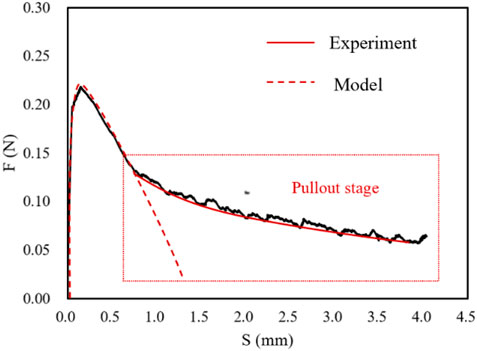
FIGURE 3. Comparison between the experiment and existing model in the fiber pullout stage.
Limitation 2: Varying Slipping Behaviors for Different Fibers
In the actual experimental observation, slipping behaviors for different fibers vary widely due to the completely different interfacial properties between the matrix and the fibers. The possible slipping phenomena in the fiber pullout stage are compared between the PVA and PET fiber. When the PVA fibers slide along the interface tunnel between fiber and matrix, the pullout force suddenly increases due to abrasion and jamming. By scanning electron microscope (SEM), it can be seen that the surface of PVA fiber (Figure 4A) has serious abrasion, while the surface of PET fiber (Figure 4B) is relatively smooth after pullout from the matrix. Hence, the various pullout performance of PET and PVA due to the different surface properties of fibers should be considered.
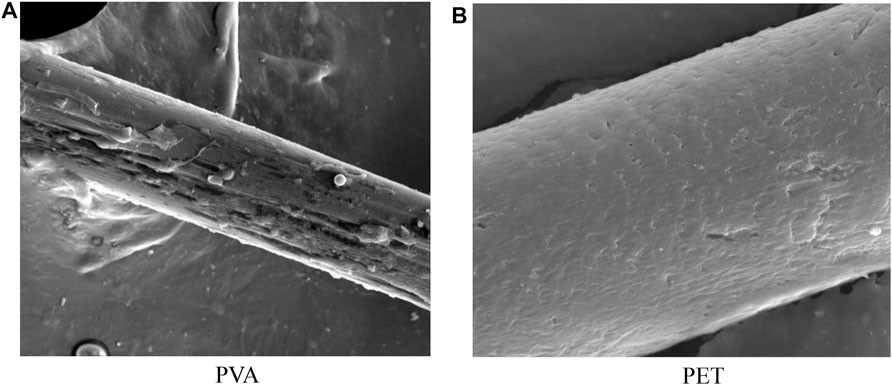
FIGURE 4. The surface of PVA and PET fibers after pullout under SEM observation. (A) PVA. (B) PET.
Limitation 3: Partial Abrasion Surface of Single Fiber After Pullout
Moreover, by Scanning Electron Microscope (SEM) shown in Figure 5, the PVA fiber showed both severe abrasion and relatively smooth segments after pullout, indicating that only part of the fiber was worn during pullout stage. Therefore, the partial blocking segment should be introduced to simulate the actual pullout process compared with the sliding hardening coefficient applied to the whole pullout process in the previous study (Yang et al., 2008).
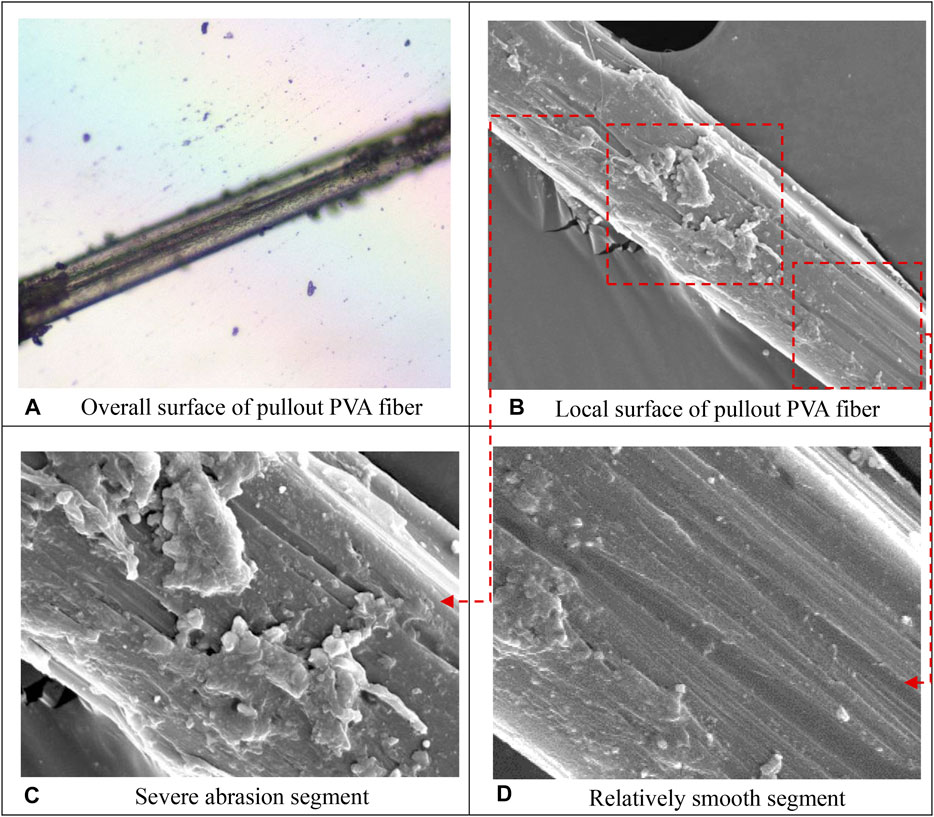
FIGURE 5. Various segments of the pullout PVA fiber surface under observation. (A) Overall surface of pullout PVA fiber. (B) Local surface of pullout PVA fiber. (C) Severe abrasion segment. (D) Relatively smooth segment.
Refined Single Fiber Pullout Model With New Considerations
To address the mentioned limitations of current model, a refined model for single fiber pullout is proposed in this section.
As mentioned before, the frictional strength varies in different fiber pullout stages, especially in the debonding and pullout stages. To account for this variation, a new parameter pullout frictional strength
Moreover, considering the surface of some fibers bonded with the matrix is partly worn under pulley force which results in obvious slip hardening phenomenon, the new parameter blocking segment
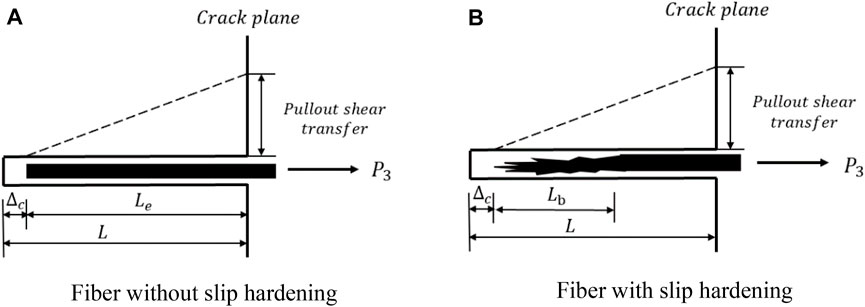
FIGURE 6. Schematic diagram of introducing parameter blocking segment
The pulley force of fiber with slip hardening in the pullout stage can be expressed as
where,
By adding these new parameters, the fiber like PVA fiber which has obvious slip hardening phenomenon can be simulated more accurately, and the pullout phenomena of fibers with different properties can be unified through the processing of the pullout stage formula as shown in Figure 7.
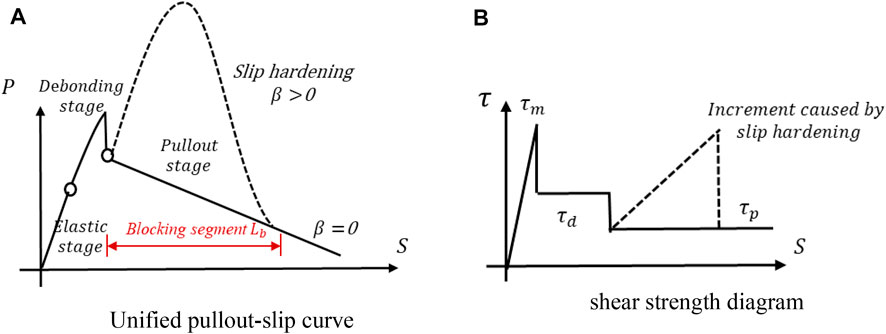
FIGURE 7. Unified pullout-slip curve and shear strength diagram. (A) Unified pullout-slip curve. (B) Shear strength diagram.
Based on the analytical model established above, the curves obtained from the experiment can be simulated. The specific calculation process is summarized as follows in Figure 8.
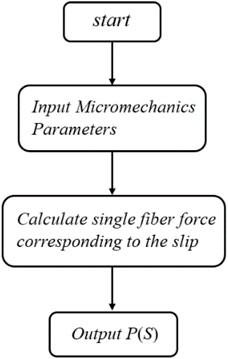
FIGURE 8. Procedure of pullout model calculation. To verify the accuracy of the modified single fiber pullout model, experimental tests are conducted.
Experimental Validation
In this section, the preparation and setup of single fiber pullout tests are introduced in detail. Moreover, parameters are fitted based on different experimental curves to obtain more accurate fiber bridging curve.
Setup of Single Fiber Pullout Test
The main components of SHCC matrix materials used in the test are ordinary silicate 42.5 cement, F class I level fly ash, 80–100 mesh quartz sand and polycarboxylic acid water-reducing agent (PCA).
The fibers selected in the test are PET fiber and domestic PVA fiber. According to the actual measurement, the basic mechanical parameters are shown in Table 1.
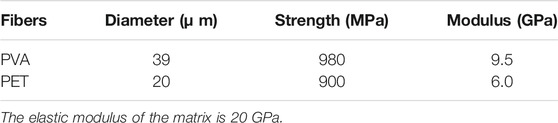
TABLE 1. Properties of fibers.
Single fiber pullout test was performed to evaluate the interfacial bond between the PVA/PET fiber and the matrix. Then the experimental curve was fitted, respectively, to obtain the fitting parameters. In this test, the testing setup is shown in Figure 9. More details of the test can be found in Katz and Li (1996). As shown in Figure 9A, the fiber pullout specimen was placed on an inverted T slot. At the same time, the free end of PVA/PET fiber was glued to a piece of white paper, which was fixed with the lower fixture. The single fiber was pulled out under displacement control at the rate of 0.5 mm/min.
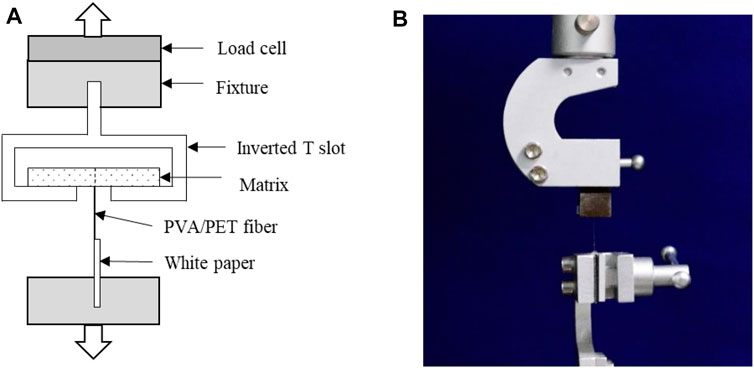
FIGURE 9. Setup of single fiber pullout test. (A) Single fiber pullout specimen placement. (B) Single fiber pullout test instrument.
Results and Discussion on the Single Fiber Pullout Test
Simulation of single fiber pullout based on the new model is conducted on each individual tested specimen. The parameters including
where
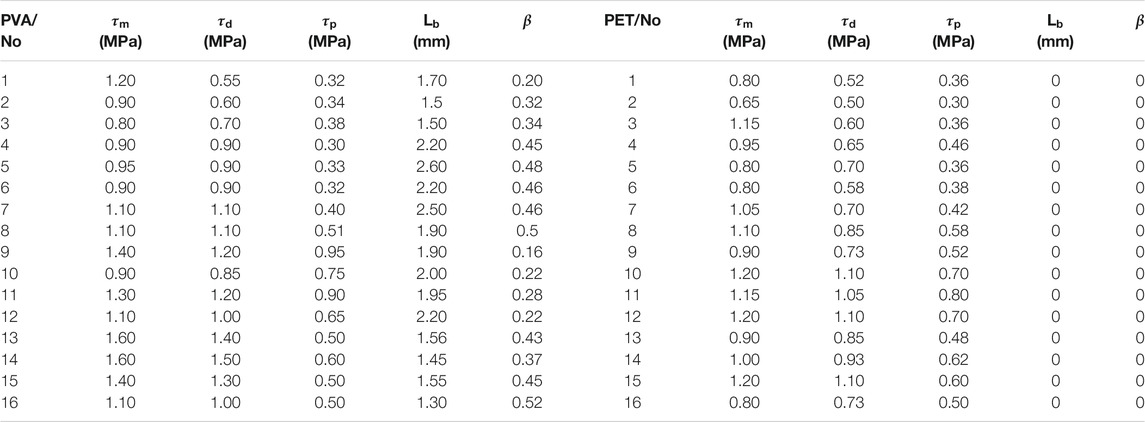
TABLE 2. interfacial parameters for PVA and PET fiber pullout simulation.
It can be seen that in the PVA fiber pullout stage, the blocking segment for each fiber in Figure 10 vary from each other, while the modified model can simulate well regardless of the length of the blocking segment. The modified model is consistent with the test results which show various lengths of blocking segment Lb. This proves that the introduction of new parameters can simulate the real situation more properly.
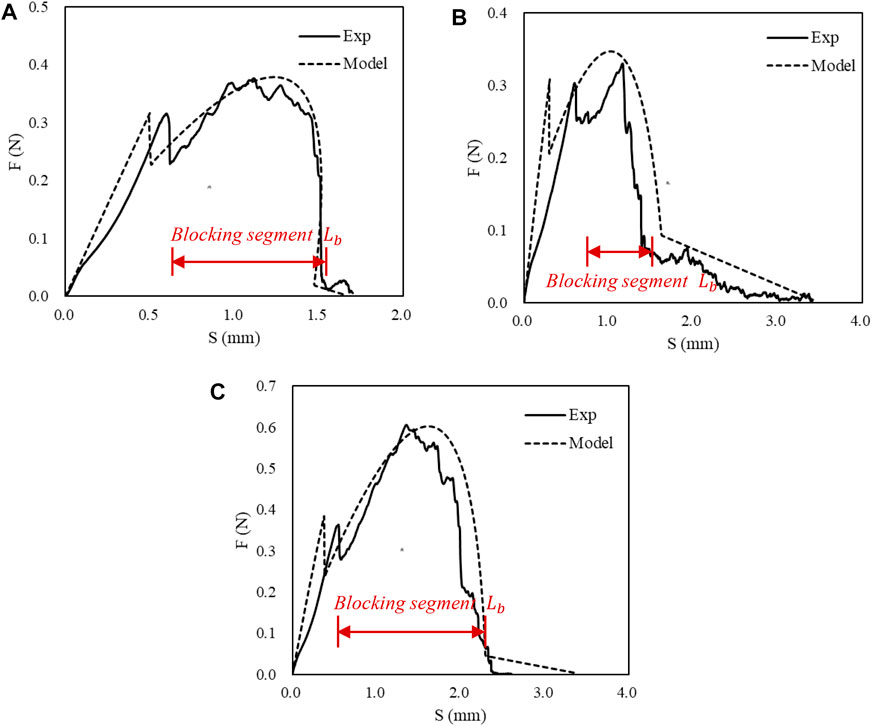
FIGURE 10. Comparison of experiments and modified PVA fiber pullout simulation results.
The previous model and the modified model both can fit well with the experimental curve when the entire surface of the fiber was worn under pulley force as shown in Figure 11A. However, when the surface of the fiber was partially worn, the previous model could not fit well with the experimental curve in the pullout stage. With the introduced parameter
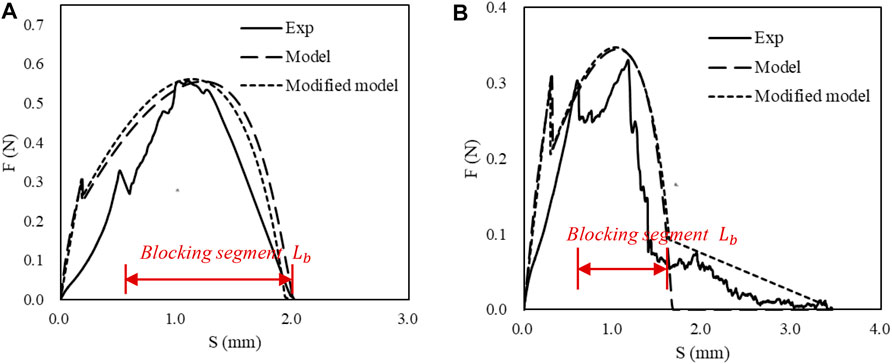
FIGURE 11. Comparison of PVA fiber pullout model and modified PVA fiber pullout model with introduced parameter Lb. (A) The entire surface of the fiber was worn. (B) The partial surface of the fiber was worn.
Compared with PVA fibers which have obvious blocking segment, PET fibers show negligible slip-hardening in Figure 12. This difference is expected since the surface of PET fiber is smoother than that of the PVA fiber.
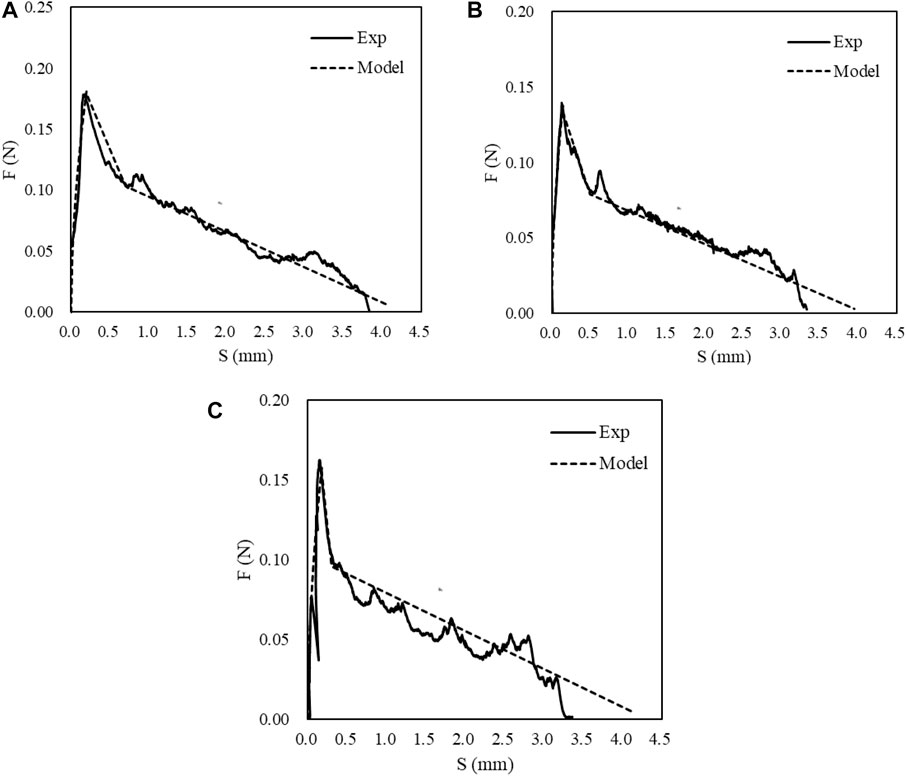
FIGURE 12. Comparison of experiments and modified PET fiber pullout simulation results.
Overall, the proposed single fiber pullout model can fit well with the experimental results for both the PVA and PET fibers. It can be seen that different parameters derived from the pullout tests vary widely between different fibers in Table 2. Therefore, normal distribution is conducted based on the obtained parameters to better describe the stochasticity of fiber pullout characteristic.
Modeling of Fiber-Bridging Constitutive Law σ(δ)
Description of the Stochasticity in the Fiber Pullout Behaviors
According to the parameter results obtained from single fiber pullout simulation above, even the same kind of fibers vary a lot in discreteness. Considering such difference, average values were used in the previous study to apply these parameters to a larger scale like simulation of fiber bridging curve. However, the randomness of interface parameters cannot be expressed completely by using the average values, so the parameters used in fiber bridging curve are obtained from normal distribution in this paper.
As illustrated in Figure 13, all parameters were randomized for PVA and PET fibers, respectively. Then a modified single crack model will be established based on the parameters selected randomly from the probability distribution of these parameters.
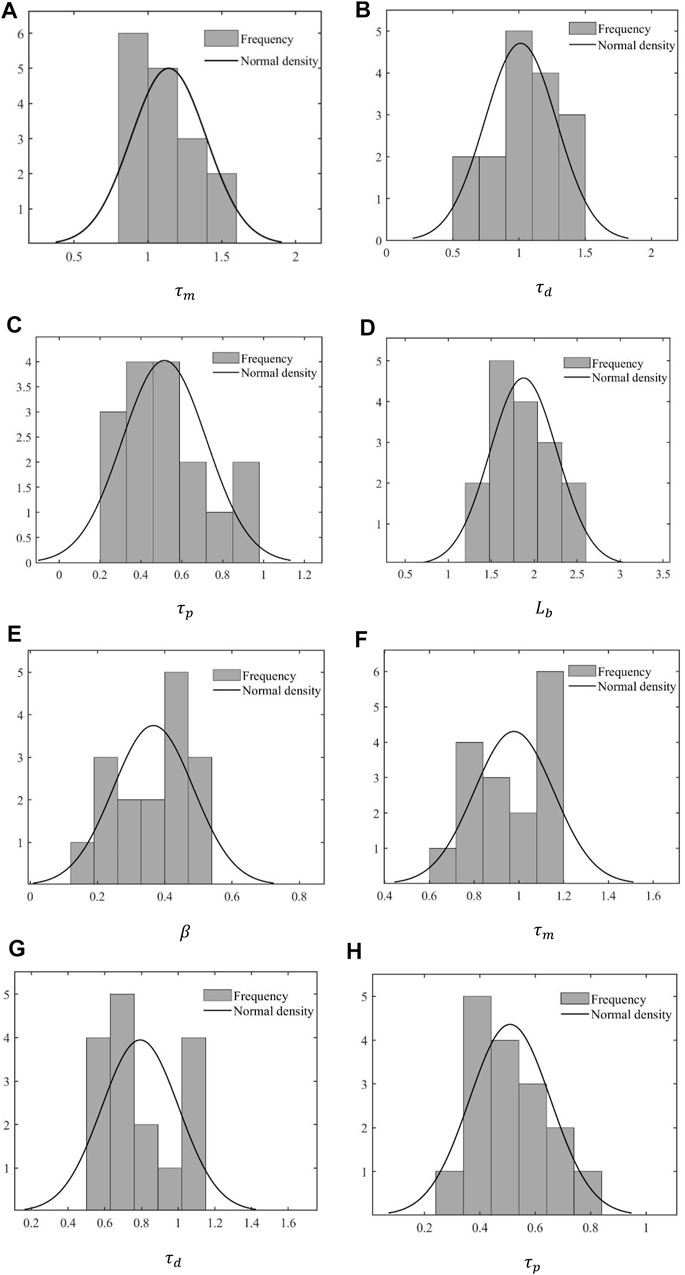
FIGURE 13. Histogram of normal distribution: (A–E) in PVA fiber, (F–H) in PET fiber.
Modeling Strategy of the σ(δ) Relation for Single Crack
Fiber-bridging constitutive law σ(δ) describes the relationship between the bridging stress σ transferred across a crack and the opening of this crack δ. On the one hand, this curve is related to the material microstructure. On the other hand, tensile strain-hardening behavior of composites is governed by this law. Therefore, to successfully design SHCC material properties, it is necessary to understand and simulate the σ(δ) curve with good accuracy.
For a fiber perpendicular to the interface between fiber and matrix, the parameters are selected randomly from the probability distribution of these parameters above in Figure 13. Therefore, a single fiber pullout force can be calculated when the orientation angle
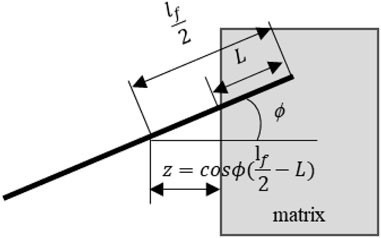
FIGURE 14. The position relation of a single fiber and matrix.
Equation 9 shows the formulation of fiber-bridging σ(δ) relation.
The probability density functions of distance z and orientation angle ϕ are independent of each other. So
A discrete method was adopted to deal with such complex analytic expressions in previous studies (Lu and Leung, 2016), which divides the fibers according to the combination of their inclination and embedding length. Assuming that the fibers are randomly distributed, fibers with different embedment length are uniformly divided into 100 groups from 0 to L/2, and those at different inclination angles are divided into 100 groups from 0 to
Through this way, the stress-crack opening curves are simulated and compared with the experimental results. The specific calculation process is summarized in Figure 15.
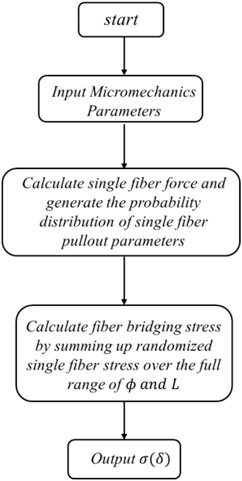
FIGURE 15. Flow chart of procedure for computing
Verification With Experimental Results
Single crack tensile test was conducted to compare with the simulation results. Dog-bone specimen is used according to the SHCC mechanical test specification, and the specific size is shown in Figure 16.
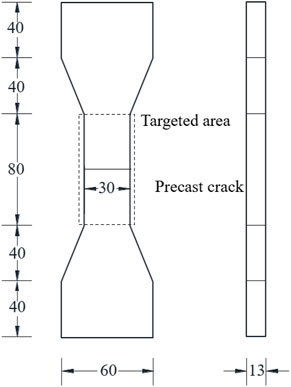
FIGURE 16. Dimensions of single crack tensile specimen (mm).
The test preparation is shown in Figure 17. The preparation of specimens mainly includes weighing, mixing, pouring, demolding and curing of raw materials. After curing, the middle section of the specimen was notched by a cutting machine to prevent the phenomenon of multi-crack cracking during tensile test and the dimension of the cross section of PVA and PET fiber specimens are shown in Figure 18. For the test setup, the edge of electronic extensometer was glued on the side of the specimen, and the force arm of the extensometer was finally clamped and fixed on the tool edge.
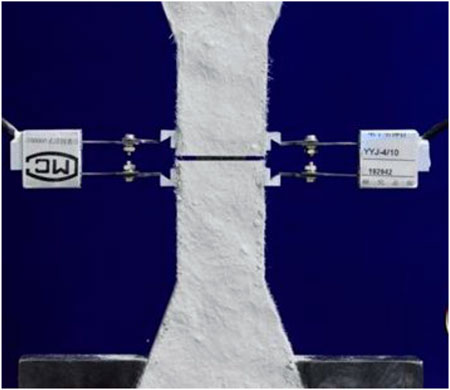
FIGURE 17. Setup of single crack test.
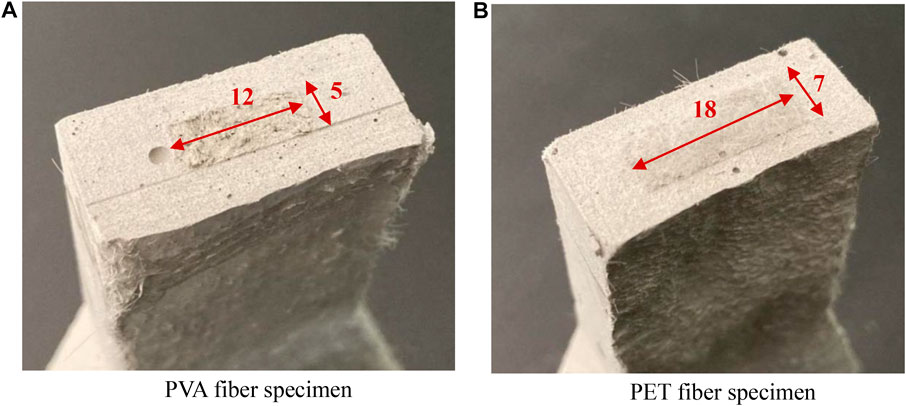
FIGURE 18. The dimension of the cross section of PVA and PET fiber specimens. (A) PVA fiber specimen. (B) PET fiber specimen.
It can be seen in Figure 19 that the bridging stress reaches the peak stress at roughly 5 MPa in PVA fibers while PET fibers can only reach 3 MPa peak stress. Besides the peak bridging stress, the corresponding crack opening displacement δ for PVA fiber specimen is wider than that for PET fiber specimen, which means that PVA fibers may have better ductility. Meanwhile, due to the larger crack width, the durability of PVA fiber specimen may be not as good. Compared with the PVA fiber specimen, PET fibers can continue to bridge the matrix under a larger crack opening displacement more than 2 mm. It is likely due to the interfacial bond between PVA fiber and the matrix is stronger than that between PET fiber and the matrix. Due to the weaker bond with the matrix, PET fiber shows higher tendency to pull out, which accounts for the flatter decline trend of PET fiber in the pullout stage as shown in Figure 19B.
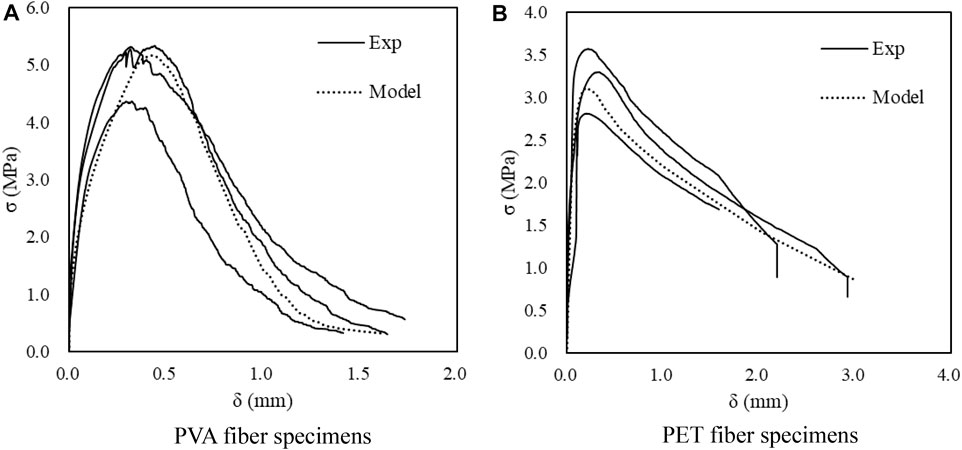
FIGURE 19. Comparison of experiments and modified σ(δ) curve simulation results for PVA and PET fiber specimens.(A) PVA fiber specimens. (B) PET fiber specimens.
Overall, the single crack model which is built based on the proposed single fiber pullout model fits well with the test results so the validity is confirmed again.
Conclusion
In this study, a unified model for single fiber pullout was successfully developed with introduced parameters, which is suitable for fibers with different interfacial properties, including PET and PVA fibers investigated in this paper. Single crack model based on the new single fiber pullout model was then developed, which takes into account the stochasticity of various pullout behaviors between different fibers. Experimental verification on single fiber pullout and single crack opening were conducted to show that the proposed model can agree well with the test results.
To conclude, this model is suitable not only for one specific fiber, but can apply to different kinds of fibers by one united form, which was verified by experiments in PVA and PET fiber systems. This revised fiber-bridging model can be utilized to predict the composite tensile ductility of SHCC with different fibers effectively, which will help the understanding and micro-mechanics-based design of SHCC materials.
Data Availability Statement
The original contributions presented in the study are included in the article/Supplementary Material, further inquiries can be directed to the corresponding author.
Author Contributions
PS was responsible for most experimental testing and model simulation work, CL put forward constructive suggestions for the revision of this paper, JW assisted in the simulation of single crack model and ZP offered help to scan the specimen by SEM.
Conflict of Interest
The authors declare that the research was conducted in the absence of any commercial or financial relationships that could be construed as a potential conflict of interest.
Publisher’s Note
All claims expressed in this article are solely those of the authors and do not necessarily represent those of their affiliated organizations or those of the publisher, the editors and the reviewers. Any product that may be evaluated in this article, or claim that may be made by its manufacturer, is not guaranteed or endorsed by the publisher.
References
Foti, D. (2016). Innovative Techniques for concrete Reinforcement with Polymers. Construction Building Mater. 112, 202–209. doi:10.1016/j.conbuildmat.2016.02.111
Graybeal, B. A. (2006). Material Property Characterization of Ultra-high Performance concrete Creep.
Jun, Z., Leung, C. K. Y., and Yin Nee, C. (2006). Flexural Performance of Layered ECC-concrete Composite Beam. Composites Sci. Technol. 66 (11-12), 1501. doi:10.1016/j.compscitech.2005.11.024
Kanda, T., and Li, V. C. (1999). Effect of Fiber Strength and Fiber-Matrix Interface on Crack Bridging in Cement Composites. J. Eng. Mech. 125 (3), 290–299. doi:10.1061/(asce)0733-9399(1999)125:3(290)
Kanda, T., and Li, V. C. (1998). Interface Property and Apparent Strength of High-Strength Hydrophilic Fiber in Cement Matrix. J. Mater. civil Eng. 10 (1), 5–13. doi:10.1061/(asce)0899-1561(1998)10:1(5)
Katz, A., and Li, V. C. (1996). A Special Technique for Determining the Bond Strength of Micro-fibres in Cement Matrix by Pullout Test. J. Mater. Sci. Lett. 15 (20), 1821–1823. doi:10.1007/bf00275353
Leung, C. K. Y. (1996). Design Criteria for Pseudoductile Fiber-Reinforced Composites. J. Eng. Mech. 122 (1), 10–18. doi:10.1061/(asce)0733-9399(1996)122:1(10)
Li, V. C. (1998). Engineered Cementitious Composites - Tailored Composites through Micromechanical Modeling. J. Adv. Concrete Techn. 1(3).
Li, V. C. (2011). Engineered Cementitious Composites (ECC) – Material, Structural, and Durability Performance.
Li, V. C., Mishra, D. K., Naaman, A. E., Wight, J. K., and Inada, Y. (2003). On the Shear Behavior of Engineered Cementitious Composites. Adv. Cement Based Mater. 1 (3), 142. doi:10.1016/1065-7355(94)90045-0
Li, V. C. (2012). On Engineered Cementitious Composites (ECC) A Review of the Material and its Applications. Fiber reinforced Concrete Engineering Materials 2012 Summit Forum of China Association of Concrete and Cement Products, 2164, 1-810.
Li, V. C., Wang, S., and Wu, C. (2001). Tensile Strain-Hardening Behavior of Polyvinyl Alcohol Engineered Cementitious composite(PVA-ECC). Aci Mater. J. 98(6), 483.
Li, V. C., and Leung, C. K. Y. (1992). Steady‐State and Multiple Cracking of Short Random Fiber Composites. J. Eng. Mech. 118 (11), 2246–2264. doi:10.1061/(asce)0733-9399(1992)118:11(2246)
Li, V. C., and Wu, H.-C. (1992). Conditions for Pseudo Strain-Hardening in Fiber Reinforced Brittle Matrix Composites. Appl. Mech. Rev. 45 (8), 390–398. doi:10.1115/1.3119767
Lin, Z., and Li, V. C. (1997). Crack Bridging in Fiber Reinforced Cementitious Composites with Slip-Hardening Interfaces. J. Mech. Phys. Sol. 45 (5), 763–787. doi:10.1016/s0022-5096(96)00095-6
Lu, C., and Leung, C. K. Y. (2016). A New Model for the Cracking Process and Tensile Ductility of Strain Hardening Cementitious Composites (SHCC). Cement Concrete Res. 79, 353–365. doi:10.1016/j.cemconres.2015.10.009
Lu, C., Yu, J., and Leung, C. K. Y. (2018). Tensile Performance and Impact Resistance of Strain Hardening Cementitious Composites (SHCC) with Recycled Fibers. Construction Building Mater. 171, 566–576. doi:10.1016/j.conbuildmat.2018.03.108
Maalej, M., Li, V. C., and Hashida, T. (1995). Effect of Fiber Rupture on Tensile Properties of Short Fiber Composites. J. Eng. Mech. 121 (8), 903–913. doi:10.1061/(asce)0733-9399(1995)121:8(903)
Naaman, A. E., Namur, G. G., Alwan, J. M., and Najm, H. S. (1991). Fiber Pullout and Bond Slip. I: Analytical Study. J. Struct. Eng. 117.
Ochi, T., Okubo, S., and Fukui, K. (2007). Development of Recycled PET Fiber and its Application as concrete-reinforcing Fiber. Cement and Concrete Composites 29 (6), 448–455. doi:10.1016/j.cemconcomp.2007.02.002
Pakravan, H. R., Latifi, M., and Jamshidi, M. (2016). Ductility Improvement of Cementitious Composites Reinforced with Polyvinyl Alcohol-Polypropylene Hybrid Fibers. J. Ind. Textiles 45 (5), 637–651. doi:10.1177/1528083714534712
Pan, Z., Wu, C., Liu, J., Wang, W., and Liu, J. (2015). Study on Mechanical Properties of Cost-Effective Polyvinyl Alcohol Engineered Cementitious Composites (PVA-ECC). Construction Building Mater. 78, 397–404. doi:10.1016/j.conbuildmat.2014.12.071
Pereira, E. B., Fischer, G., and Barros, J. A. O. (2012). Effect of Hybrid Fiber Reinforcement on the Cracking Process in Fiber Reinforced Cementitious Composites. Cement and Concrete Composites 34 (10), 1114–1123. doi:10.1016/j.cemconcomp.2012.08.004
Sueki, S., Soranakom, C., Mobasher, B., and Peled, A. (2007). Pullout-slip Response of Fabrics Embedded in a Cement Paste Matrix. J. Mater. Civ. Eng. 19 (9), 718–727. doi:10.1061/(asce)0899-1561(2007)19:9(718)
Victor, C. L., and Forii, H. (1993). From Micromechanics to Structural Engineering the Design of Cementitious Composites for Civil Engineering Applications. Doboku Gakkai Ronbunshu 1993 (471), 1.
Yang, E. H., Wang, S., Yang, Y., and Li, V. C. (2008). "Fiber-bridging Constitutive Law of Engineered Cementitious Composites". (Japan: Japan Concrete Institute).
Zhigang, Z. (2020a). Effect of Sub-elevated Temperature on Mechanical Properties of ECC with Different Fly Ash Contents. Construction Building Mater. 262, 120096. doi:10.1016/j.conbuildmat.2020.120096
Zhigang, Z. (2020b). SPEco-Friendly High Strength, High Ductility Engineered Cementitious Composites (ECC) with Substitution of Fly Ash by rice Husk Ash. Cement Concrete Res. 137, 106200. doi:10.1016/j.cemconres.2020.106200
Keywords: physical model, SHCC, fiber pullout, PET fiber, PVA fiber
Citation: She P, Wang J, Pang Z and Lu C (2022) A Unified Model for Fibers With Divergent Pullout Behaviors in Strain Hardening Cementitious Composites (SHCC). Front. Mater. 9:860113. doi: 10.3389/fmats.2022.860113
Received: 22 January 2022; Accepted: 15 February 2022;
Published: 08 March 2022.
Edited by:
Zhigang Zhang, Chongqing University, ChinaReviewed by:
Junxia Li, Institute of Materials Research and Engineering (A*STAR), SingaporeYao Ding, Chongqing University, China
Copyright © 2022 She, Wang, Pang and Lu. This is an open-access article distributed under the terms of the Creative Commons Attribution License (CC BY). The use, distribution or reproduction in other forums is permitted, provided the original author(s) and the copyright owner(s) are credited and that the original publication in this journal is cited, in accordance with accepted academic practice. No use, distribution or reproduction is permitted which does not comply with these terms.
*Correspondence: Cong Lu, Y29uZ2x1QHNldS5lZHUuY24=