 Jun Yang
 Jieyun Wang1*
94% of researchers rate our articles as excellent or good
Learn more about the work of our research integrity team to safeguard the quality of each article we publish.
Find out more
ORIGINAL RESEARCH article
Front. Mater., 28 April 2022
Sec. Structural Materials
Volume 9 - 2022 | https://doi.org/10.3389/fmats.2022.859701
This article is part of the Research TopicAdvanced Concretes and Their Structural ApplicationsView all 23 articles
For large arch bridges, the sealing hinge layer at the arch footing is critical to the long-term performance and durability of the structure. This study investigated the temperature distribution of the sealing hinge layer inside a large UHPC arch seat during the hydration process in a natural environment, based on a design of a 600-m-span reinforced concrete rigid skeleton arch bridge. A certain suggestion for the design of a large-volume UHPC layer was proposed through the consideration of temperature and age effects of the thermal field solid finite element analysis of early-age UHPC hydration heat. The results show that UHPC has a hydration induction period of 10 h and reaches the peak temperature of 69°C in 20 h. Then, the hydration heat is gradually released in 70 h after pouring. The maximum temperature difference between the core and surface reaches 40°C. The results also show that the early temperature field and heat release rate of UHPC are affected by initial temperature. The actual heat release of some materials of UHPC components at 75 h is equivalent to that at 300 h, and the minimum effective age was found close to 100 h, where the heat release reaches 0.25 of the total heat release. A simplified algorithm for the spatially time-varying non-linear temperature field of the UHPC sealing hinge layer under the influence of temperature and age is proposed, which provides a simple calculation method for the temperature control of the UHPC arch seat during the hydration process in real projects.
For large-span arch bridges, the arch seats are subjected to excessive internal force and local stress concentration, which leads to concrete cracks and spalling at the junction of the main arch and seat. As a result, it can cause corrosion of reinforcement in the arch seat and other diseases, which seriously affect the structural safety of large-span arch bridges (Teng, 2016). As UHPC has excellent characteristics of ultrahigh strength, good durability, and high tensile strength, it can be used in the hinge sealing at the foot of the arch to enhance the mechanical properties and durability of the arch foot hinge sealing, thus reducing the disease and improving the overall safety and durability of large-span arch bridges. However, the use of UHPC as the arch footing base for arch bridges has not yet been fully investigated (Bourchy et al., 2019).
Currently, the possibility of using UHPC for the key part of the bridge has been investigated in beams (Fan et al., 2021; Feng et al., 2021), columns (Wang et al., 2021; Xue et al., 2021), joints (Nasrin and Ibrahim, 2021), and shear walls (Preinstorfer et al., 2021). The structural size of UHPC is small, and many conventional tests have been carried out for small-size UHPC specimens, including UHPC-steel thin layer (Jiang et al., 2021), UHPC-NC layer (Yang et al., 2021), and thin wall arch rib (Yang et al., 2021). Meanwhile, there are few articles on the hydration heat of UHPC, and most of the existing articles are aimed at the hydration heat release of mass concrete (Hu et al., 2017; Chen et al., 2021). In terms of cement hydration heat release, there were effects of superplasticizer on the early hydration heat of cement (Jia et al., 2021; Zhu et al., 2022) and the effects of admixture (Zhang T. et al., 2021) and construction technology (Mandal et al., 2021) on the hydration heat of cement. In terms of the finite element calculation model, it included the early thermodynamic model of concrete segmental box girder (Do et al., 2021), thermodynamic coupling model of early thermal cracking of concrete (Dong et al., 2021), and thermodynamic model of steel-concrete composite beam in the hydration process (Zhang Z. et al., 2021). The UHPC material has a large proportion of cementitious materials and a violent heat of hydration reaction (Shi et al., 2015; Zheng and Wu, 2021) and, when used in a large-volume structure, may cause early cracking of the structure. At the same time, the non-uniform thermal resistance of the plain concrete–UHPC interface leads to a complex temperature conduction process (Koenders et al., 2014; Schackow et al., 2016), so it is necessary to carry out experimental studies on the heat of hydration temperature field to obtain the form of temperature field distribution of the existing thick slab of UHPC to ensure the casting effect (Humad et al., 2019; Jia et al., 2021).
Therefore, in this research, carried out an experimental study and finite element analysis of the hydration heat field of a large-volume UHPC-sealed hinge layer based on a 600-m-span reinforced concrete stiff skeleton arch. Based on the equivalent age theory of concrete (FREIESLEBEN, 1997), the cement composite index exothermic model (Zhu, 2012) and ABAQUS transient thermal analysis finite element method (Gui, 2012) improve the traditional concrete hydration heat calculation (Teixeira de Freitas et al., 2013), through HEVAL, FILM/DISP subroutines to impose the hydration heat source considering the effect of UHPC own temperature and the heat transfer boundary under the influence of ambient temperature (Kim et al., 2010; Zhou et al., 2014), to establish a solid analysis model of the spatial time-varying thermal field of UHPC arch seal hinge layer components under the action of temperature + hydration heat coupling. Comparing the results of experimental research and finite element analysis, this study introduces the concept of equivalent age maturity of the temperature field finite element calculation method to consider the influence of temperature and age on the development of the exothermic rate of the cementitious material, which can be better applied to the early exothermic intense UHPC components (Yang et al., 2022a; Yang et al., 2022b; Tang et al., 2022).
The heat release process of early-age UHPC materials is complex, assuming that the concrete is homogeneous and isotropic after casting, that is, cement mortar, aggregates, etc. show a uniform distribution, and the release of its heat of hydration is irrelevant to spatial location, but is only a function of time. Therefore, the accumulated heat of hydration at each age should be calculated in order to derive the exothermic rate of hydration and substitute it as an internal heat source in the subsequent calculation of the transient temperature field. The cumulative heat of hydration of cement is age-dependent, and three common calculation models are exponential (Eq. 1), hyperbolic (Eq. 2), and compound exponential (Eq. 3) heat of hydration expressions (Zhu, 2012).
In formulas (1) to (3), Q(t)is the cumulative heat of hydration of cement at age t; Q0 is the final heat of hydration of cement when t→∞; t is the age; m is a constant; n is a constant, which is the age when the heat of hydration reaches half, unit: days d; and a and b are constants.
In this study, the composite exponential equation is used; for P.O 525r cement, each parameter is taken as the value Q0 = 350 kJ/kg, a = 0.36, b = 0.74. The exothermic rate is given as follows:
The equivalent age function has the following form (FREIESLEBEN, 1997; Hansen and Pedersen, 1977):
Discrete as
where Ea is the concrete activation energy, J/mol; R is the gas constant, J/(molK), R = 8.3144 J/(molK); Tr is the reference temperature, °C, generally taken as 20; T is the average temperature of the concrete during the time period Δt, °C; and te is the equivalent age maturity of the concrete relative to the reference temperature, d. The equivalent age te includes both time and temperature concepts, which can fully reflect the growth of mechanical parameters in concrete. For the finite element simulations, the corresponding equivalent age values are calculated in the form of a cumulative superposition of time steps. Considering the high active content of UHPC, a constant value of 4000 K is used for the calculation of Ea/R in this study.
From this, the time in the transient analysis of the temperature field can be replaced by the equivalent time of the concrete to obtain a modified model of the cement exotherm taking into account the effect of temperature as follows (Gui, 2012):
where η is the ratio of the actual heat release from UHPC to the total heat release.
The theoretical model considers the influence of cement hydration temperature on its hydration heat release rate and can be better suited for UHPC materials with a less water binder ratio and intense early heat release.
A bridge adopts a top-loaded rigid skeleton concrete arch bridge, the main arch axis adopts a catenary, and the calculated span is 600 m (Figure 1). The arch seat adopts an open-cut expansion foundation, and the arch seat is poured with 16,800 cubic meters of C30 concrete. The hinge layer at the arch foot is poured with 1600 square meters and a thickness of 2.4 m UHPC, which is completed in one pour. UHPC has a less water-to-binder ratio and a large amount of unilateral cement. The violent hydration process leads to rapid changes in its spatial time-varying temperature field, which in turn causes complex temperature effects.
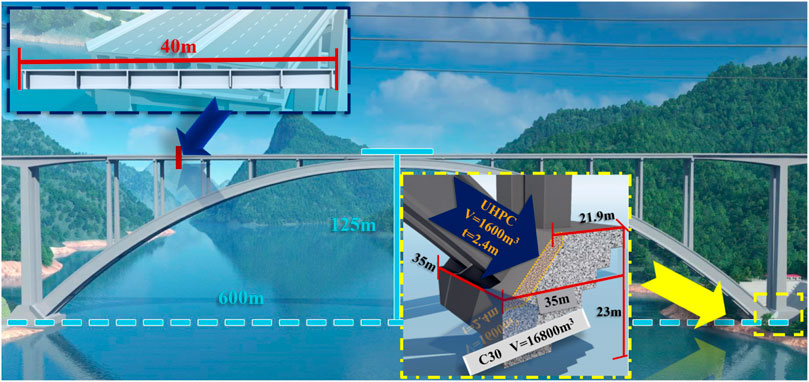
FIGURE 1. General arrangement of a bridge (unit: m).
In order to simulate the actual temperature boundary of the sealing-hinged concrete of the arch foot, the UHPC components were surrounded by film-coated wood framework with a thickness of 15 mm, and the framework was covered with 20 mm plastic foam to simulate the thermal insulation layer of the conventional concrete–UHPC interface; the pouring was completed at 6 p.m. on 2021/11/17, and the measured ambient temperature of the laboratory was 12.5°C, with a daily temperature variation amplitude of 10°C, according to the sinusoidal distribution (Figure 2). The initial temperature of UHPC was 25°C; UHPC was made of P.O 525r cement, and the thermal parameters of UHPC are given in Table 1. The material matching ratio was given as follows:
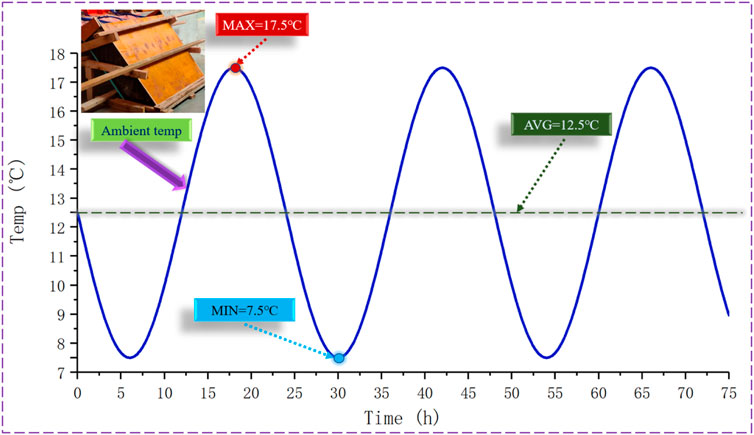
FIGURE 2. Ambient temperature history curve after completion of pouring.
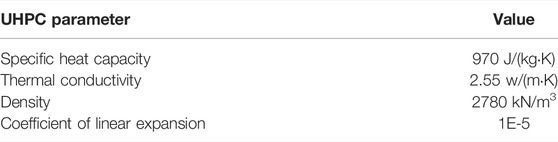
TABLE 1. Thermal parameters of UHPC materials.
Cement:fly ash:silica fume:sand:water:steel fiber:admixture = 1:0.2:0.17:1.1:0.24:0.17:0.0275.
To test the shrinkage characteristics of UHPC, experiments related to self-shrinkage and constrained shrinkage of UHPC were carried out (Figures 3, 4). The self-shrinkage test was carried out by pre-bedding a vibrating string transducer in the prismatic specimen, and the UHPC constrained shrinkage was performed using a circular specimen with circular dimensions according to ASTM C 1581-04. The strain gauges were attached to the four corners of the inner steel ring to output a strain value through the full-bridge wiring.
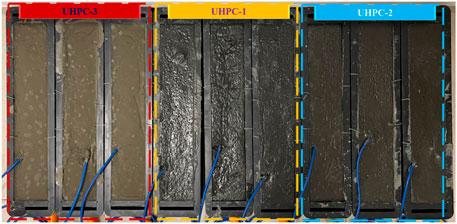
FIGURE 3. Self-shrinking specimens.
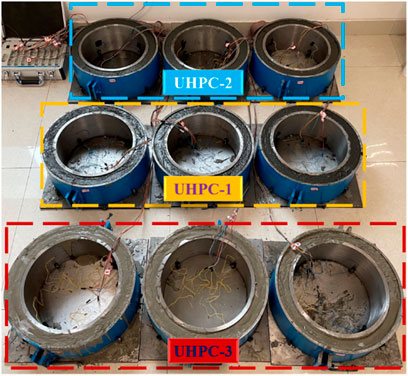
FIGURE 4. Constrained shrinkage specimens.
Among them, UHPC-1 was a universal UHPC, UHPC-2 was a low-shrinkage UHPC, and UHPC-3 was an early strength UHPC developed by the author’s team. In this work, we studied the hydration heat of UHPC-3.
The early self-shrinkage of UHPC specimens develops rapidly, reaching 200 με in 1 d, 350 με in 3 days, and 400 με in 28 days; the development trend of constrained shrinkage was smoother, with little change after reaching 150 με in 20 days (Figure 5).
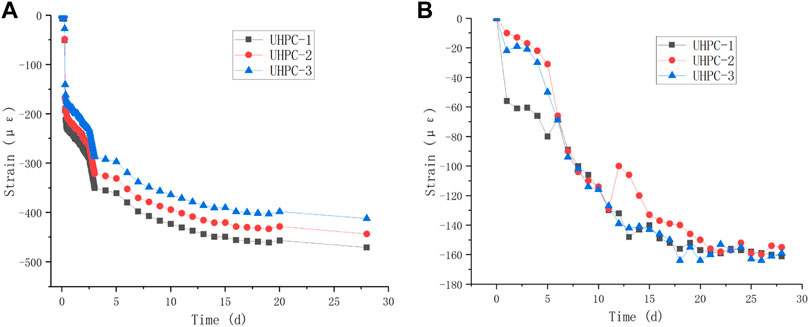
FIGURE 5. Shrinkage characteristic test of UHPC. (A) Self-shrinkage results. (B) Constrained shrinkage results.
It should be pointed out that the content of the early shrinkage test of UHPC is not discussed in this study and is not directly related to the temperature field research involved in this study. However, the early shrinkage performance of UHPC is very important for the calculation of temperature stress, so this part is listed here in order to support further research work.
The specimen size was 1000 mm long, 900 mm wide, and 300 mm thick, with a volume of 0.27 square, and was completed in one pour. Three layers of reinforcement mesh were arranged inside the structure, with a reinforcement size of 10 mm (Figure 6). In total, 29 string sensors with temperature (SZZX-A150D) were arranged for data acquisition using the SZZDQ-ZH intelligent reading instrument (Figure 7).
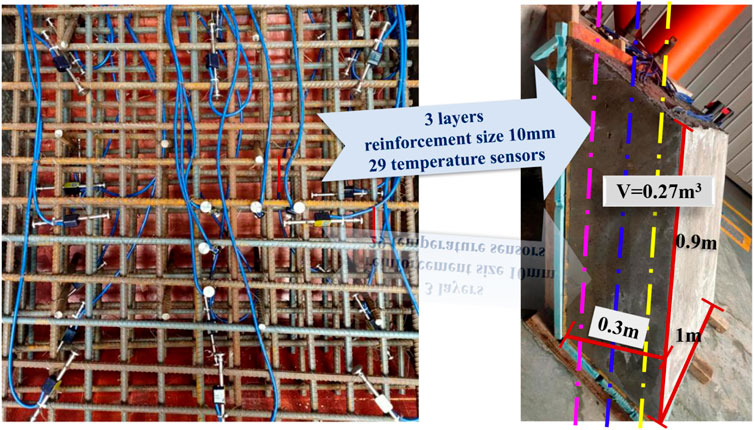
FIGURE 6. Test components.

FIGURE 7. Arrangement of the measurement points.
Figure 8 shows the heat of the hydration temperature curve at each measurement point, with the vertical axis showing the measured temperature values at each measurement point and the horizontal axis showing the time since the end of pouring of the UHPC component.
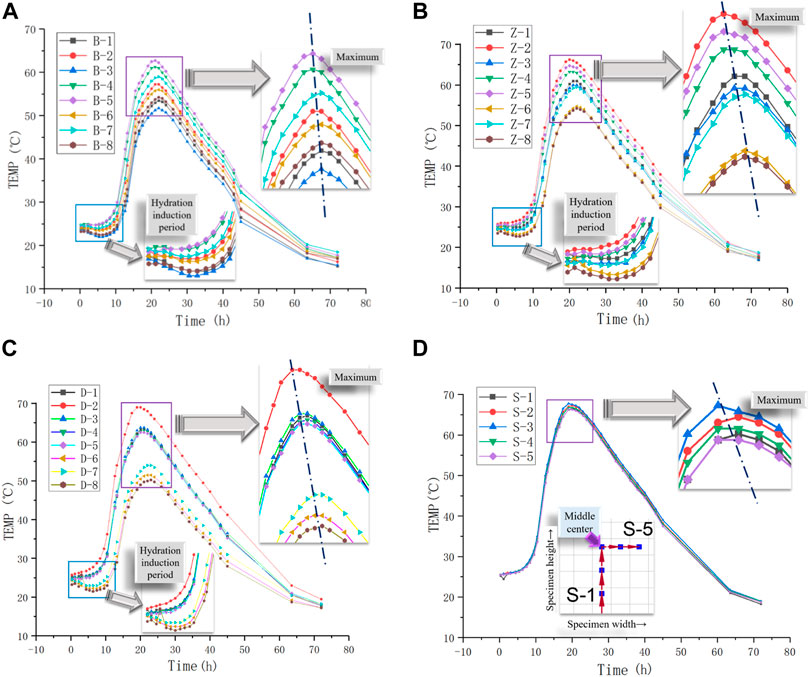
FIGURE 8. Temperature of concrete measurement point in each test section. (A) Surface layer temperature evolution. (B) Mid-layer temperature evolution. (C) Bottom layer temperature evolution. (D) Vertical temperature measurement.
From Figure 8, it can be seen that the initial hydration induction period of UHPC components is about 10 h, and the heat release of UHPC during the hydration induction period is slow, and this phenomenon is more consistent with the literature (Yang et al., 2019). The temperature change caused by convective heat dissipation of formwork–air during the hydration induction period is obvious, and the temperature change of UHPC during this period is not significant; the bottom test section surface measurement point is more obvious; the UHPC material reaches about 25°C and starts to react, and the initial temperature of UHPC greatly influences the UHPC temperature field; 10 h after the temperature rises rapidly, the peak temperature of hydration heat is 69°C and appears in 20 h. The peak temperature is located at the measuring point D-2 and at the center of the bottom of the UHPC specimen, after which the temperature of heat of hydration gradually decreases, 70 h after pouring, the heat of hydration is released, and the rate of temperature change in the rising section of the heat of hydration curve is greater than that in the falling section; because the temperature accelerates the process of the heat of hydration of UHPC, the greater the peak temperature of the measurement point, the shorter the time to reach the peak. This phenomenon is more obvious in the middle and bottom sections, where the temperature is higher; the temperature field of UHPC at the formwork–air interface is coupled by the external environment and the heat of hydration as the test chamber is in a relatively stable windless environment with room temperature, the environmental influence is small, and the temperature field of UHPC is mainly affected by the heat of hydration.
Figure 9 shows the difference in the heat of hydration temperature of each measurement point in the test section, which provides further insights into the temperature transfer path in the thickness direction. As shown in Figure 7, "Z1-D1″ indicates the temperature of the measurement point in the middle test section minus the temperature of the measurement point in the bottom test section.
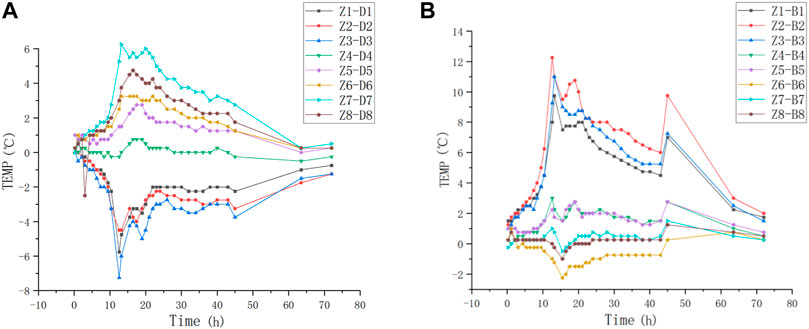
FIGURE 9. Temperature difference distribution in the test section. (A) Mid-bottom test section. (B) Mid-surface test section.
It can be seen from Figure 9 that after 10-h hydration induction period of UHPC members, the section temperature difference develops rapidly, and the section temperature difference starts to decrease 20 h after the completion of pouring. According to the temperature difference, the temperature transfer path in the thickness direction is obtained as follows: the bottom temperature of the bottom section transfers to the center of the bottom section and the bottom of the middle section; the middle section transfers to the center of the bottom, the top, and the surface section; and the section temperature transfer is from the center to the outside (Figure 10). The maximum temperature difference of 12.5°C in the section occurs at 12 h, which is located in the middle layer–bottom of the surface layer region.
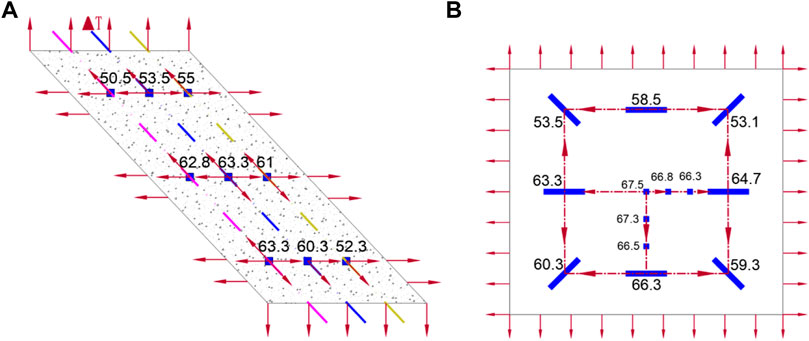
FIGURE 10. Temperature transfer path (unit: °C). (A) Thickness direction transfer path. (B) Transfer path of the middle section at 20 h.
The model is discretized into 48000 DC3D8R heat transfer units, and the initial temperature fields of thermal convection, thermal radiation, and actual incoming temperature are imposed for transient heat transfer analysis with an analysis duration of 75 h. The specific settings are as follows: according to the relevant provisions of the Standard for the Construction of Massive Concrete (GB 50496-2018) and the production of the members, the convective heat transfer coefficient of each surface of the members is set as mentioned in Table 2:
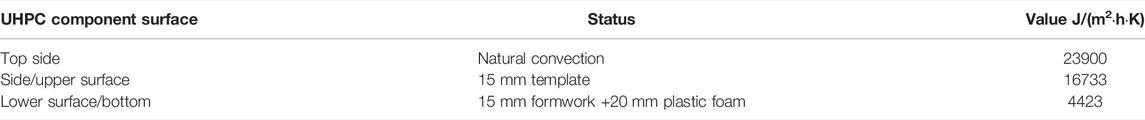
TABLE 2. Heat transfer coefficients of UHPC components.
The surface of the UHPC component radiates heat to the outside world, and the emissivity of the UHPC surface is taken to be 0.9; the measured entry temperature of the UHPC unit at the measurement point is input in the Python batch for steady-state temperature field analysis, and the steady-state non-uniform temperature field is obtained to simulate the actual entry temperature.
Figure 11 shows the comparison between the hydration heat temperature curves and the simulation curves at measurement points 1, 2, 4, 6, and 7 in the surface test section, and those with ' in the figure indicate the simulation data.
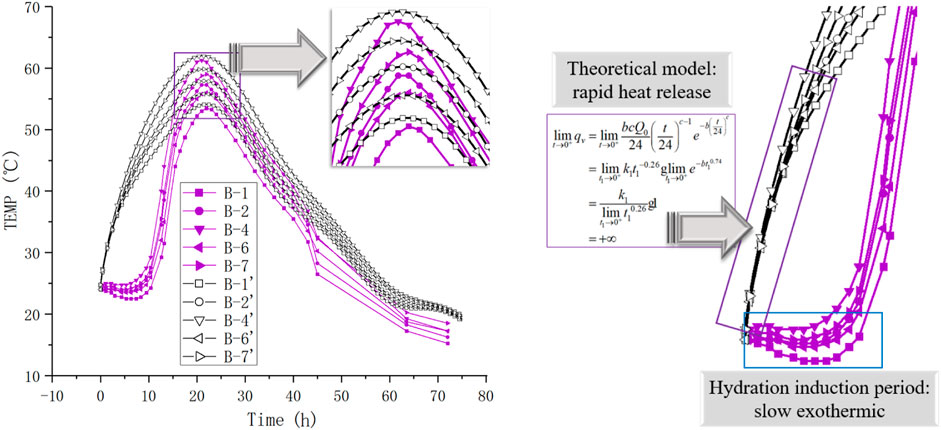
FIGURE 11. Comparison of measured point temperatures in surface test sections.
The sensitivity analysis shows that Q0 in formula (4) has a significant impact on the peak hydration temperature of UHPC. The greater the Q0, the higher the peak hydration temperature of UHPC. The accuracy of Q0 must be ensured in the calculation, which can be determined by using the cement adiabatic heating test; Ea/R in Eq. 5 has a significant impact on the peak time of UHPC hydration. The greater the Ea/R, the shorter the peak time of UHPC hydration. In this study, Ea/R = 4000 K is finally determined by adjusting EA and calibrating the calculation model.
It can be seen that there is a big difference between the test curve and simulation curve in the temperature rise stage, especially in the early stage of hydration heat, and this difference is because the simulation model is based on the composite exponential theory model, the exothermic rate in t → 0 for +∞, which fails to take into account the slow exotherm caused by the complex process of hydration induction period; in the fall stage, the test data and simulation data fluctuate and decrease, reflecting the change in the actual convective heat transfer velocity between the specimen and the air caused by the sinusoidal variation of the external temperature. The experimental data are slightly smaller than the simulation data. Considering that the actual convection heat transfer velocity between the specimen and the outside world is larger than that in the model setting; the simulation curve is more consistent in the region near the peak and the temperature fall stage and can better calculate the peak and the time of occurrence, indicating that the total amount of heat generation and heat dissipation parameters of the model are set accurately and can simulate the test situation better.
In summary, the experimental results and the calculated results of the temperature field distribution and the evolution law are consistent due to the thermal analysis algorithm, the heat of hydration model, convective heat transfer model, and radiation heat transfer model have a certain empirical approximation, so that the calculated results and the real results of the test in some nodes of the value show a certain deviation and this deviation can meet the engineering accuracy requirements. The transient thermal analysis model established in this study to consider the influence of temperature can be used for predicting the temperature distribution law of the hinge layer of a large-volume UHPC arch base.
Figure 12 shows the distribution of the temperature field at each time point. In order to observe the core temperature variation, the clouds are shown dissected from the center, and to save space, only the temperature clouds for 25, 40, 55, and 75 h are shown in Figure 12.
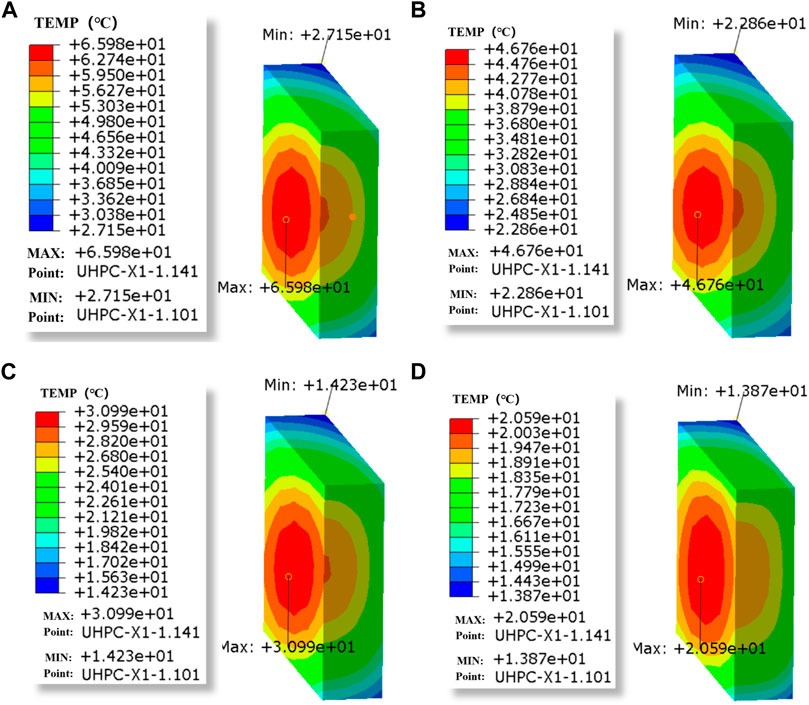
FIGURE 12. Spatial distribution of UHPC hydration heat temperature field at different times. (A) Temperature field at 25 h. (B) Temperature field at 40 h. (C) Temperature field at 55 h. (D) Temperature field at 75 h.
It can be seen that the core temperature of the component is the highest, and after 25 h, the heat dissipation in all parts of the component is uniform. The heat dissipation rate slows down with time, and the core temperature drops 35°C in the first 25–55 h and 10°C between 55 and 75 h. The lowest surface temperature appears in the corner position of the top surface of the UHPC and drops 13°C in the first 25–55 h, and the temperature is unchanged between 55 and 75 h, which is close to room temperature. Different moments of the component profile cloud chart section are nearly elliptical, with obvious temperature changes along the short side and a large temperature gradient.
Figure 13 shows the distribution of isothermal surface and temperature field. It can be seen that the temperature decreases from the center to the surrounding area, which is in line with the general law of heat of hydration.
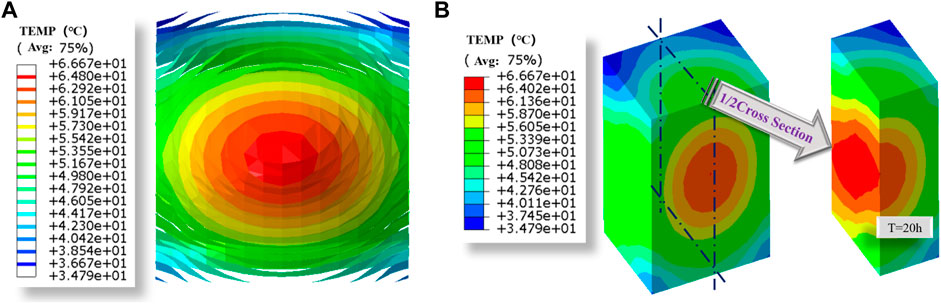
FIGURE 13. Spatial distribution of the heat of hydration temperature field of UHPC at 20 h. (A) Isothermal surface at 20 h. (B) Temperature distribution at 20 h.
The central isothermal surface is a spherical surface, due to the width > height > thickness of the component. The isothermal surface near the boundary gradually becomes an ellipsoidal ball, with three directions in a decreasing order, and the outer isothermal surface cannot be wrapped together due to the size limitation of the thickness direction. The temperature gradient is larger along the short side and smaller along the long side because the short side can conduct the temperature to the outside world more quickly. From the temperature distribution diagram, it can be seen that the maximum temperature is located in the center of the middle section and the bottom of the bottom section, while the temperature at the top of the UHPC member is smaller, which is consistent with the test situation.
Figure 14 shows the history curves of the maximum and minimum values of temperature at the nodes of each frame, and the temperature values of the top center node and surface corner points of the member and the maximum and minimum point temperature difference of the member read using Python. Figure 15 shows the history curves for the maximum and minimum values of the equivalent age and the ratio of the unit heat release to the total heat release at each node of each frame.
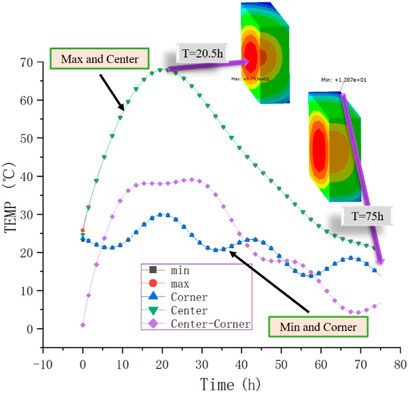
FIGURE 14. Temperature and temperature extremes history curve.
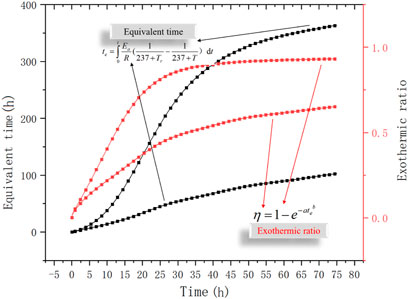
FIGURE 15. Age and exothermic ratio history curve.
From the temperature and temperature difference curve, it can be seen that the maximum and minimum temperature values at the nodes and the top center nodes and surface corners of the members overlap, indicating that the maximum and minimum temperatures of the member locate at the top center nodes and surface corners of the member and do not change with time; the temperature difference curve shows that the temperature difference between the inside and outside of the members reaches 40°C, which far exceeds the temperature difference limit of 25°C specified in the Standard for the Construction of Massive Concrete (GB 50496-2018). Special attention should be paid to the temperature control of the sealing hinge layer of the large-volume UHPC arch seat.
From the age and exothermic ratio course curve, it can be seen that the maximum effective age rises to 300 h within 75 h of the actual hydration reaction, indicating that under the influence of temperature, the actual exothermic amount of UHPC component materials at 75 h reaches the exothermic amount at the age of 300 h, and the exothermic percentage is close to 1, which has fully reacted to exothermic amount; the minimum effective age is close to 100 h and the exothermic amount reaches 0.25 of the total exothermic amount.
Combining the temperature field distribution and the isothermal surface diagram shows that the isothermal surface is ellipsoidal and approximately equidistant along the space, and the ellipsoidal equation is as follows:
At this point, a set of parameters a, b, and c of an ellipsoidal surface determines a temperature value T. Assuming that the ellipsoidal surface increases in the same proportion in the component space, we have T = T (abc), for a UHPC plate of length LX, width LY, and thickness LZ.
The temperature T0 at the center of the plate and the temperature TZmin at the surface of the thickness, then the temperature change along the thickness direction can be expressed as follows:
Figure 16 shows the simulation temperatures, engineering approaches, and simplified formulas for calculating the temperature of the model extracted along the thickness direction at 20 h, with the node selected as the center of the thickness surface.
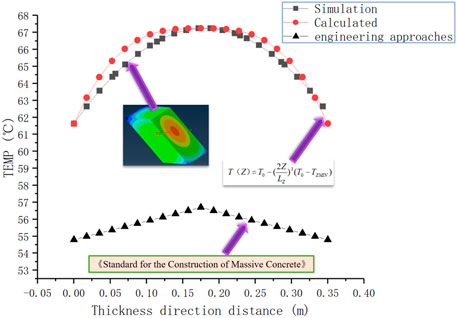
FIGURE 16. Temperature in the direction of plate thickness.
The comparison between the “simulation” and the “calculated” curves shows that the calculation assumes a cubic parabolic distribution of temperature along the thickness direction, which is more than reasonable and has sufficient accuracy for structural calculation. The test results are in good agreement with the calculation results, but they are quite different from the engineering calculation results.
It is found that the temperature result of the engineering approaches is small because the commonly used engineering approaches are suitable for conventional concrete, and the hydration heat release of UHPC at an early age is intense, which leads to the advancement of the hydration peak, which is different from conventional concrete. It can be seen that the commonly used engineering calculation approaches are not accurate enough for the calculation of the hydration heat of UHPC, and the simplified calculation method proposed in this study can be better applicable.
At present, due to its excellent performance, UHPC has broad application prospects in key parts of buildings and bridge structures, especially large-volume UHPC components. The early exothermic intensity of large-volume UHPC may cause early temperature cracks, which may affect the long-term performance of the structure. At the same time, at present, there are many studies on the hydration heat temperature field of ordinary concrete, and there are relatively few studies on the hydration heat of large-volume UHPC. The hydration heat release mechanism of large-volume UHPC needs to be further clarified. This study carries out the experimental and simulation research on the early temperature field of large-volume UHPC components and puts forward a simplified algorithm of time-varying non-linear temperature field in UHPC closed hinge space under the influence of temperature and age, which can be better applied to practical engineering. However, this study focuses on the temperature field of large-volume UHPC. Temperature stress and temperature crack are not expanded within the scope of this study, which will be reflected in the author’s follow-up research works. The main conclusions of this study are as follows:
1) The test results show that the hydration reaction of UHPC has a hydration induction period of 10 h, and then the hydration exothermic reaction becomes intense. In the calculation process, the influence of temperature and hydration exothermic rate needs to be considered in order to carry out accurate simulation. The test and simulation results show that the maximum temperature of the component under UHPC mass pouring is 69°C, and the temperature difference between the core and surface reaches 40°C. Special attention should be paid to temperature control.
2) The initial temperature of UHPC has a great influence on its early hydration heat temperature field. The higher temperature of UHPC has a shorter time to leave the induction period of hydration, and the hydration reaction occurs earlier than that of UHPC at lower temperatures, resulting in drastic changes in the spatial distribution of the temperature field of UHPC at early ages. The cooling path after the temperature peak is as follows: temperature transfer from the bottom of the bottom section to the center of the bottom section and the bottom of the middle section, transfer from the middle section to the center of the bottom section, the top and the surface section, and temperature transfer from the center to the outside of the section.
3) Under the influence of temperature, the actual heat release of some materials of UHPC components at 75 h reaches that at 300 h, and the heat release percentage is close to 1, which fully reflects the heat release; the minimum effective age is close to 100 h, and the heat release reaches 0.25 of the total heat release. The isothermal surface of UHPC after the temperature peak is ellipsoidal from the center to the surface diffusion, this study is based on the test and simulation results of the theoretical derivation, the existing UHPC plate temperature along the thickness direction of the simplified calculation formula, for engineering structures have sufficient calculation accuracy.
4) It is recommended that the construction of UHPC components should be well insulated, and cold water pipes can be used to reduce the heat of hydration at an early age for large UHPC components.
The original contributions presented in the study are included in the article/Supplementary Material, further inquiries can be directed to the corresponding author.
JY organized the database and wrote the first draft of the manuscript. JW revision read, revised the first draft of the manuscript, and approved the submitted version. CL did the experiment and simulation analysis. YD and YF processed the data. All authors contributed to the choice of the review topic, to the general outline of the manuscript, and to the revision and approval the manuscript to be submitted.
The support by the National Natural Science Foundation of China (51908093), the Natural Science Foundation of Chongqing (cstc2020jcyj-msxmX0088), Chongqing Natural Science Foundation Innovation Group Science Foundation (cstc2019jcyj-cxttX0004), the Science Foundation of Hubei Provincial Department of Transportation (2020-186-1-6, 2020-2-1-1), and the Scientific and Technological Research Project of Chongqing Education Commission (KJQN201900733) is greatly acknowledged.
JY and JW were employed by Guangxi Communications Investment Group Corporation Ltd.
The remaining authors declare that the research was conducted in the absence of any commercial or financial relationships that could be construed as a potential conflict of interest.
All claims expressed in this article are solely those of the authors and do not necessarily represent those of their affiliated organizations, or those of the publisher, the editors, and the reviewers. Any product that may be evaluated in this article, or claim that may be made by its manufacturer, is not guaranteed or endorsed by the publisher.
Bourchy, A., Barnes, L., Bessette, L., Chalencon, F., Joron, A., and Torrenti, J. M. (2019). Optimization of Concrete Mix Design to Account for Strength and Hydration Heat in Massive concrete Structures. Cement and Concrete Composites. 103, 233–241. doi:10.1016/j.cemconcomp.2019.05.005
Chen, H.-L., Mardmomen, S., and Leon, G. (2021). On-site Measurement of Heat of Hydration of Delivered Mass Concrete. Construction Building Mater. 269, 121246. doi:10.1016/j.conbuildmat.2020.121246
Do, T. A., Verdugo, D., Tia, M., and Hoang, T. T. (2021). Effect of Volume-To-Surface Area Ratio and Heat of Hydration on Early-Age thermal Behavior of Precast concrete Segmental Box Girders. Case Stud. Therm. Eng. 28, 101448. doi:10.1016/j.csite.2021.101448
Dong, S., Wang, X., Xu, H., Wang, J., and Han, B. (2021). Incorporating Super-Fine Stainless Wires to Control thermal Cracking of concrete Structures Caused by Heat of Hydration. Construction Building Mater. 271, 121896. doi:10.1016/j.conbuildmat.2020.121896
Fan, L., Teng, L., Tang, F., Khayat, K. H., Chen, G., and Meng, W. (2021). Corrosion of Steel Rebar Embedded in UHPC Beams with Cracked Matrix. Construction Building Mater. 313, 125589. doi:10.1016/j.conbuildmat.2021.125589
Feng, Z., Li, C., Yoo, D.-Y., Pan, R., He, J., and Ke, L. (2021). Flexural and Cracking Behaviors of Reinforced UHPC Beams with Various Reinforcement Ratios and Fiber Contents. Eng. Structures. 248, 113266. doi:10.1016/j.engstruct.2021.113266
Gui, Y. (2012). Study on Hydration Characteristics and Maturity of Sulphoaluminate Cement-Based Material. Wuhan Univ. Sci. Technol. doi:10.27380/d.cnki.gwkju.2020.000528
Hansen, P. F., and Pedersen, E. J. (1977). Maturity Computer for Controlling Curing and Hardening of concrete. Nordisk Betong. 19, 21–25.
Hu, X., Shi, C., Shi, Z., Tong, B., and Wang, D. (2017). Early Age Shrinkage and Heat of Hydration of Cement-Fly Ash-Slag Ternary Blends. Construction Building Mater. 153, 857–865. doi:10.1016/j.conbuildmat.2017.07.138
Humad, A. M., Provis, J. L., and Cwirzen, A. (2019). Effects of Curing Conditions on Shrinkage of Alkali-Activated High-MgO Swedish Slag Concrete. Front. Mater. 6, 287. doi:10.3389/fmats.2019.00287
Jia, F., Yao, Y., and Wang, J. (2021). Influence and Mechanism Research of Hydration Heat Inhibitor on Low-Heat Portland Cement. Front. Mater. 8, 697380. doi:10.3389/fmats.2021.697380
Jiang, J., Zou, Y., Yang, J., Zhou, J., Zhang, Z., Huang, Z., et al. (2021). Study on Bending Performance of Epoxy Adhesive Prefabricated UHPC-Steel Composite Bridge Deck. Adv. Civil Eng. 2021, 1–16. doi:10.1155/2021/6658451
Kim, G., Lee, E., Kim, Y., and Khil, B. (2010). Hydration Heat and Autogenous Shrinkage of High-Strength Mass Concrete Containing Phase Change Material. J. Asian Architecture Building Eng. 9, 455–462. doi:10.3130/jaabe.9.455
Koenders, E. A. B., Pepe, M., and Martinelli, E. (2014). Compressive Strength and Hydration Processes of concrete with Recycled Aggregates. Cement Concrete Res. 56, 203–212. doi:10.1016/j.cemconres.2013.11.012
Mandal, R., Panda, S. K., and Chakraborty, S. (2021). Effect of Electrolyzed Water (EW) in Accelerating the Cement Setting and Hydration as Demonstrated by the Analytical Techniques. Construction Building Mater. 311, 125367. doi:10.1016/j.conbuildmat.2021.125367
Nasrin, S., and Ibrahim, A. (2021). Flexural Response of Ultra-High-performance Concrete (UHPC) Hybrid Bridge Deck Connections Made with Local Materials. Construction Building Mater. 270, 121451. doi:10.1016/j.conbuildmat.2020.121451
Preinstorfer, P., Huber, P., Huber, T., Kromoser, B., and Kollegger, J. (2021). Experimental Investigation and Analytical Modelling of Shear Strength of Thin Walled Textile-Reinforced UHPC Beams. Eng. Structures. 231, 111735. doi:10.1016/j.engstruct.2020.111735
Schackow, A., Effting, C., Gomes, I. R., Patruni, I. Z., Vicenzi, F., and Kramel, C. (2016). Temperature Variation in Concrete Samples Due to Cement Hydration. Appl. Therm. Eng. 103, 1362–1369. doi:10.1016/j.applthermaleng.2016.05.048
Shi, C., Wang, D., Wu, L., and Wu, Z. (2015). The Hydration and Microstructure of Ultra High-Strength concrete with Cement-Silica Fume-Slag Binder. Cement and Concrete Composites. 61, 44–52. doi:10.1016/j.cemconcomp.2015.04.013
Tang, Q., Xin, J., Jiang, Y., Zhou, J., Li, S., and Chen, Z. (2022). Novel Identification Technique of Moving Loads Using the Random Response Power Spectral Density and Deep Transfer Learning. Measurement 195, 111120. doi:10.1016/j.measurement.2022.111120
Teixeira de Freitas, J. A., Cuong, P. T., Faria, R., and Azenha, M. (2013). Modelling of Cement Hydration in concrete Structures with Hybrid Finite Elements. Finite Elem. Anal. Des. 77, 16–30. doi:10.1016/j.finel.2013.07.008
Teng, Y. (2016). Research on Inspection and Assessment and Strengthening Technology of Steel Pipe and concrete Arch Bridge. China; Chang'an University.
Wang, Z.-C., Duan, D.-Y., Wang, S.-H., Mo, Y., and Yin, Y.-G. (2021). Mechanical Behavior of the Novel Gradient Concrete Tower of a Cable-Stayed Bridge. Front. Mater. 8, 15. doi:10.3389/fmats.2021.676440
Xue, W., Hu, X., and Song, J. (2021). Experimental Study on Seismic Behavior of Precast concrete Beam-Column Joints Using UHPC-Based Connections. Structures. 34, 4867–4881. doi:10.1016/j.istruc.2021.10.067
Yang, J., Xia, J., Cheng, C., Wang, J., Zhang, J., and Wang, G. (2022a). Research on the Bonding Performance of UHPC–NC Interfaces With Different Sizes of Grooves. Frontiers in Materials 9. doi:10.3389/fmats.2022.859717
Yang, J., Xia, J., Zhang, Z., Zou, Y., Wang, Z., and Zhou, J. (2022b). Experimental and Numerical Investigations on the Mechanical Behavior of Reinforced Concrete Arches strengthened With UHPC Subjected to Asymmetric Load. Structures 39, 1158–1175. doi:10.1016/j.istruc.2022.03.087
Yang, J., Zhou, J, T., Zhang, Z, Y., Wang, Z, S., and Wang, J, Y. (2021). Shear Performance of Keyway Interface between UHPC and Normal Concrete. Chin. J. Highw. 34 (8), 13. doi:10.19721/j.cnki.1001-7372.2021.08.011
Yang, J., Zhou, J., Wang, Z., Zhou, Y., and Zhang, H. (2019). Structural Behavior of Ultrahigh-Performance Fiber-Reinforced Concrete Thin-Walled Arch Subjected to Asymmetric Load. Adv. Civil Eng. 2019, 1–12. doi:10.1155/2019/9276839
Zhang, T., Ma, B., Jiang, D., Jiang, Q., and Jin, Z. (2021). Comparative Research on the Effect of Various mineral Admixtures on the Early Hydration Process of Cement. Construction Building Mater. 301, 124372. doi:10.1016/j.conbuildmat.2021.124372
Zhang, Z., Liu, Y., Liu, J., and Zhang, N. (2021). Thermo-mechanical Behavior Simulation and Cracking Risk Evaluation on Steel-Concrete Composite Girders during Hydration Process. Structures. 33, 3912–3928. doi:10.1016/j.istruc.2021.06.101
Zheng, X., and Wu, J. (2021). Early Strength Development of Soft Clay Stabilized by One-Part Ground Granulated Blast Furnace Slag and Fly Ash-Based Geopolymer. Front. Mater. 8, 616430. doi:10.3389/fmats.2021.616430
Zhou, Y., Meng, D., and Wang, Y. (2014). Finite-Element Simulation of Hydration and Creep of Early-Age Concrete Materials. J. Mater. Civ. Eng. 26, 05014006. doi:10.1061/(ASCE)MT.1943-5533.0001105
Zhu, B. F. (2012). Temperature Stress and Temperature Control of Mass concrete. Beijing, China: China water resources and Hydropower Press.
Keywords: arch seat, UHPC layer, temperature field, temperature difference, simplified algorithm
Citation: Yang J, Wang J, Luo C, Ding Y and Fan Y (2022) Study of the Hydration Temperature Field in the Hinge Seal Layer for a Large-Volume UHPC Arch Base. Front. Mater. 9:859701. doi: 10.3389/fmats.2022.859701
Received: 21 January 2022; Accepted: 21 March 2022;
Published: 28 April 2022.
Edited by:
Qian Zhang, Florida Agricultural and Mechanical University, United StatesReviewed by:
Qing-feng Liu, Shanghai Jiao Tong University, ChinaCopyright © 2022 Yang, Wang, Luo, Ding and Fan. This is an open-access article distributed under the terms of the Creative Commons Attribution License (CC BY). The use, distribution or reproduction in other forums is permitted, provided the original author(s) and the copyright owner(s) are credited and that the original publication in this journal is cited, in accordance with accepted academic practice. No use, distribution or reproduction is permitted which does not comply with these terms.
*Correspondence: Jieyun Wang, d2FuZ2p5Z3hAMTI2LmNvbQ==
Disclaimer: All claims expressed in this article are solely those of the authors and do not necessarily represent those of their affiliated organizations, or those of the publisher, the editors and the reviewers. Any product that may be evaluated in this article or claim that may be made by its manufacturer is not guaranteed or endorsed by the publisher.
Research integrity at Frontiers
Learn more about the work of our research integrity team to safeguard the quality of each article we publish.