 Jun Chen1,2
 Zongshan Wang
 Jianting Zhou
94% of researchers rate our articles as excellent or good
Learn more about the work of our research integrity team to safeguard the quality of each article we publish.
Find out more
ORIGINAL RESEARCH article
Front. Mater., 31 March 2022
Sec. Structural Materials
Volume 9 - 2022 | https://doi.org/10.3389/fmats.2022.859620
This article is part of the Research TopicAdvanced Concretes and Their Structural ApplicationsView all 23 articles
This paper performed compressive tests on corroded reinforced concrete (RC) columns with externally confined ultra-high performance concrete (UHPC) jacket. The studied parameters in this testing program was the corrosion ratio of specimens. The influences of this parameter on the compressive behavior of concrete columns confined by UHPC jacket was reported and discussed. The test results revealed that when the rust rate was less than 20%, axial cracking was the typical failure mode of unreinforced specimens, and the cracks in the rusted area gradually increased with the increase of the rust rate. When the corrosion rate reached 30%, the concrete of the protective layer fell off significantly, and the longitudinal reinforcement also yielded. The ultimate load and peak displacement of the specimens reinforced with UHPC were significantly improved, and the improvement rates of the two were more than 80% and 30%, respectively. The failure mode of the specimen with a corrosion rate of 30% also changed to longitudinal cracking of the UHPC layer. An analytical model was proposed to predict the ultimate load of RC columns with externally strengthening UHPC jacket. The validations of the predictions against the reported test results confirmed the accuracy of the analytical model.
Reinforced concrete (RC) columns are widely used in engineering structures, and their performance is inevitably degraded by factors such as dry-wet cycles, freeze-thaw cycles, and steel corrosion. Among these factors, the corrosion of steel bars is recognized as the main reason for the deterioration of the mechanical properties of reinforced concrete columns (Jiang et al., 2018; Hu et al., 2019; Zhou et al., 2020), because it will cause the degradation of the mechanical properties of the corroded steel bars, the corrosion-induced cracking of concrete and the deterioration of the interface bonding properties.
The rehabilitation of deteriorated RC column is becoming increasingly important due to the maintenance purpose. Several rehabilitation systems have been applied in RC columns. Steel plate is one of the traditional retrofit methods and used widely for strengthening RC columns (Wang et al., 2017; Hwang et al., 2020). However, steel plate suffers from low corrosion resistance, which raises another durability problem. Many research efforts have been focused on investigating the behavior of RC columns strengthened with fiber-reinforced polymer (FRP) (Estevan et al., 2020; Fallah Pour et al., 2020; Karimipour and Edalati, 2020). The strength and ductility of RC columns can be increased by FRP jackets, and the confinement efficiency increases with the lateral pressure. In order to be fully effective, the deteriorated RC column surface need to be appropriately prepared. Moreover, the confinement efficiency decreases when the column is subjected to an eccentric axial load (Hadi and Li, 2004; Hadi, 2009) and the diameter of the cylindrical concrete column increases (Lam and Teng, 2003). From a different perspective, an increasing number of FRP layers not only incurs additional cost but also causes bond failure (Wu et al., 2006).
In fact, concrete jacketing is the first method to strengthen damaged concrete columns with a new layer of reinforced concrete (Ma et al., 2017). It is reported that the bonding performance between damaged concrete and jacket is good if roughening and cleaning of concrete surface are adopted to ensure good compatibility between the jacket and column surface (Ma et al., 2017). The jacket can provide protection for the core concrete, and the bearing capacity of the reinforced columns can also be increased. However, the poor durability of reinforced concrete limits its application. In the past 10 years, many researchers have worked to develop a type of high-performance fiber-reinforced cementitious composites (also known as engineered cementitious composite, ECC), which are best known for their ultra-ductility and ultra-toughness. ECC has gained increasing popularity in the retrofitting of walls and beams for its excellent tensile properties (Qin et al., 2020; Zhang et al., 2020; Zhang et al., 2021), but it cannot exert its advantages for retrofitting RC columns mainly under compression. The applications of ultra-high performance concrete (UHPC) provides a new choice for this approach. UHPC is a fiber-reinforced material that disperses a certain volume of steel fibers in high strength mortar. It has excellent mechanical properties and durability (Song et al., 2020; Du et al., 2021) as well as good bonding ability (Feng et al., 2020; Guan et al., 2021; Hu et al., 2021), showing great prospects in the field of repair and reinforcement.
Dadvar et al. (Ali Dadvar et al., 2020) investigated the axial behavior of circular RC columns strengthened with 15-mm UHPC jackets. Surface preparation using the four techniques of longitudinal and horizontal grooving, sandblasting, and abrasion were discussed. The results showed that the novel longitudinal grooving surface treatment exhibited better than the common sand blasting technique in load-carrying capacity and energy absorption. Hadi et al. (Hadi et al., 2018) studied the behavior of 16 RC columns strengthened with UHPC under uniaxial compressive and eccentric compressive loads. Their results showed that the thin RPC jacket was able to produce significant increases in both axial and flexural load capacities of their circular columns. Moreover, confining the specimens with UHPC jackets was observed to increase both their ductility and energy absorption when compared with the reference columns.
Xie et al. (Xie et al., 20192019) subjected square and circular concrete columns strengthened with UHPC jackets to uniaxial compression loading. They found that increasing the thickness of confining UHPC jacket significantly improved the compressive behaviors of concrete stub columns for cylindrical shaped column. However, this influence on that of square shaped stub columns was less significant. Moreover, Shan et al. (Shan et al., 2020) conducted an experimental study to investigate the axial behavior of concrete-filled UHPC tubes, which is composed of a prefabricated UHPC thin-wall hollow tube with FRP hoops and concrete. Researchers also focused on the establishment of theoretical models. Models to predict the stress-strain relation of RC columns strengthened with UHPC jackets have been proposed (Algburi et al., 2019; Xie et al., 20192019; Ali Dadvar et al., 2020). The validations of the predictions against the reported test results confirmed the accuracy of the analytical models.
Despite the numerous studies in recent years conducted on RC columns strengthened with UHPC jackets, the reinforced objects are mainly intact RC columns rather than corroded ones. The present studies the axial behavior of corroded RC columns strengthened with 2 mm UHPC jacket and discusses the effect of corrosion rate on the bearing capacity, failure mode and deformation. An analytical model is proposed to predict the bearing capacity of corroded RC columns with externally strengthening. The model is finally verified against results reported.
A total of eight RC columns with different corrosion rates, including four corrosion rates of 0%, 10%, 20%, and 30%, were designed to explore the effect of UHPC jacket on the compressive behavior of corroded RC columns. Specimen were divided into two groups according to whether they were reinforced. All specimens were designed with square cross section and measured 150 and 900 mm in side length and height, respectively. Four steel bars with a diameter of 12 mm were arranged longitudinally. The diameter of the stirrups was 6mm, and one stirrup was set at an interval of 150 mm. Both ends of the specimen were welded with 10 mm thick steel plates as a leveling layer to avoid end damage. 400 mm central area of the specimen was selected as the study area, and electrical corrosion test was used to achieve different corrosion rates. The design of the specimens is shown in Figure 1, and the details of specimens is shown in Table 1.
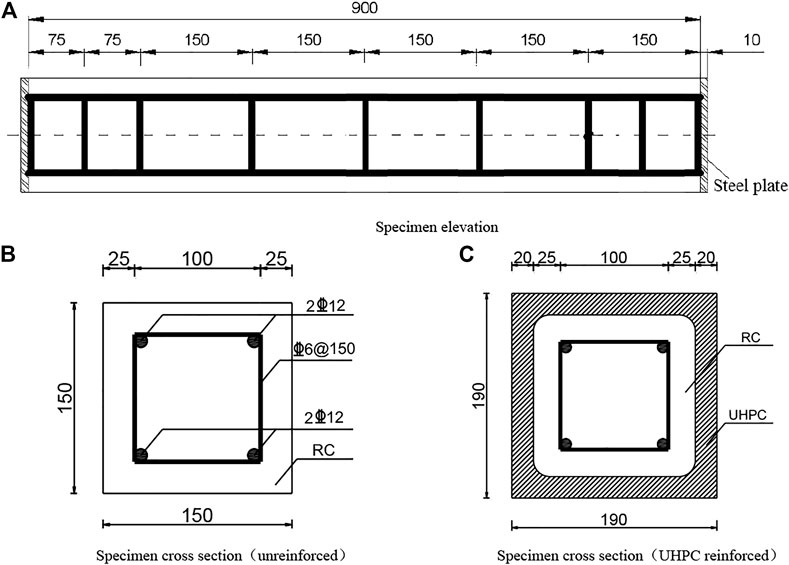
FIGURE 1. Cross-section size and reinforcement layout of the specimen (Unit: mm). (A) Specimen elevation. (B) Specimen cross section (unreinforced). (C) Specimen cross section(UHPC reinforced).
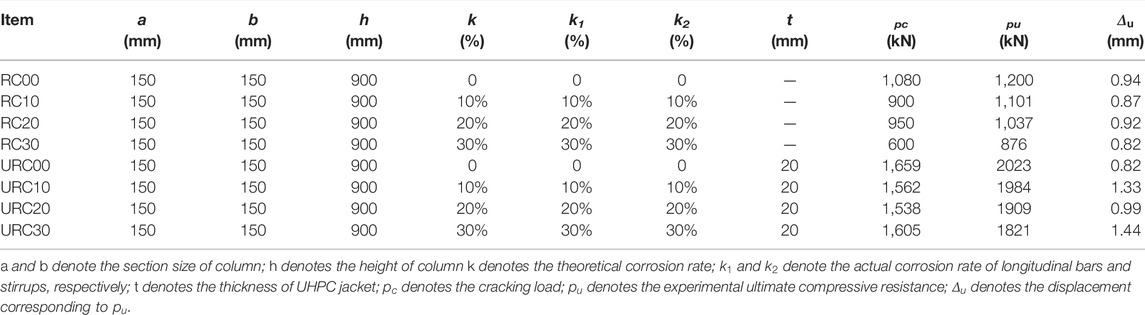
TABLE 1. Results and details of corroded RC columns confined by UHPC jacket.
The fabrication of the specimens was divided into three stages. The first stage was the production of the RC column. After the steel cage was bound, it was placed in a wooden mold and poured into a mold. The poured specimens were placed on a flat place and left for 48 h. After 2 days, the wooden formwork was removed, and then watered and cured for 28 days. Then electrical corrosion test was used to corrode the 400 mm long section in the middle of the RC columns. The RC group specimens were waiting for the test under natural curing conditions, while the URC group was chamfered and then reinforced by UHPC jacket. After the strengthening was completed, they were cured at room temperature for 28 days, and the axial compression test was carried out. Figure 2 shows the main process of specimen fabrication.
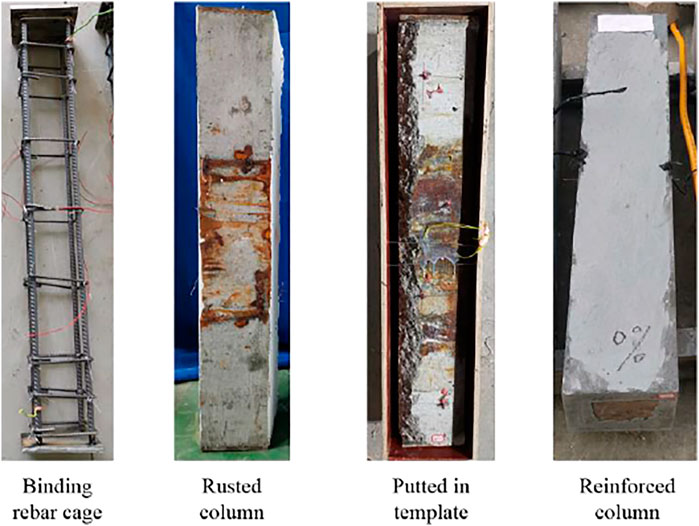
FIGURE 2. Main process of specimen fabrication.
It is time consuming to achieve the corrosion and deterioration of the RC columns in the real situation, the corrosion of the steel bars in the RC columns was achieved by electrical corrosion test. While there might be a certain gap between the accelerated corrosion by electrification and the actual natural corrosion, especially the corrosion induced crack patterns and rust distributions (Meng et al., 2022), it could greatly shorten the test time and was widely used in research (Xia et al., 2021). In the electrification accelerated corrosion test, the most commonly used theory was Faraday’s law, through which the current size and electrification time required to achieve the theoretical corrosion rate can be determined, and the relationship between the corrosion quality and them is as follows:
Where,
Since the stirrups and the longitudinal bars were bound together, the stirrups would also corrode during the electrification process. Therefore, the following formula was used when calculating the total corrosion mass of the steel bars:
From the Eqs 1, 2, the energization time required for the steel bar under a specific corrosion rate could be calculated, and it was corroded according to the theoretical corrosion rate in the table. First, configure a 5% NaCl solution, completely soak the rag to wrap the test section of the specimen that needs to be corroded. In addition, it was necessary to use a catheter to set up a liquid guiding device to ensure that the rag was always in a wet state, so that the concrete in the corroded steel bar area fully moistened. In order to prevent the end of the specimen from being damaged, the outer rag was only set in the target rust range of 400 mm in the middle of the test piece. As shown in Figure 3, connect the positive pole of the power supply to the copper wire, and wrap the negative carbon rod in a wet rag to close to the surface of the test piece and check whether the connection is normal.
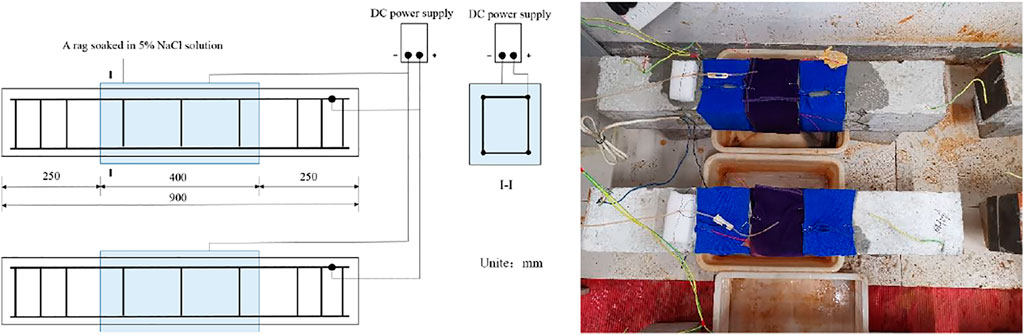
FIGURE 3. The rust condition of the specimen when electrified.
An external direct current was adopted during the accelerated corrosion test of steel bars. A power supply with adjustable current and voltage was used, the voltage adjustment range was between 0 and 30 V, and the current adjustment range was between 0 and 3A. During the corrosion, the current was stabilized at 2.1 A, which can be chosen according to experimental conditions. After turning on the power supply, the current should be slowly adjusted to the corresponding current value after the corrosion section was fully infiltrated. During the corrosion process, the current and energization time were observed in real time to ensure that the 5% NaCl solution kept the concrete in the corrosion section fully wet.
Grade C50 normal weight concrete was selected for all of the stub concrete columns. Ordinary Portland cement PO 42.5, natural sand and crushed granite coarse aggregate with a maximum diameter of 20 mm were used. Table 2 lists the mixture proportions. The water-cement ratio of this NWC was 0.48. Concrete cube with 150 mm length were tested for the compressive strength, and the average 28-days compressive strength was 41.3 MPa. The UHPC dry mix is produced by Hunan Guli Engineering New Materials Co., Ltd., and the material mass ratio is cement: silica fume: quartz sand: quartz powder: water reducer: water = 1:0.25:1.1:0.3:0.019:0.225. In addition, flat steel fibers with a length of 8 mm and a diameter of 0.12 mm were mixed with a volume of 2%. According to the specification (China Building Materials, 2018), the material property test of UHPC was carried out. The average cubic compressive strength of UHPC was 135 MPa, and the average flexural strength was 38.4 MPa. Its elastic modulus was 4.45 × 10⁴ N/mm2.
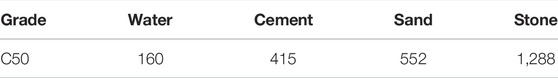
TABLE 2. Mix proportion of C50 (kg/m3).
The test was carried out through the YAW-10000F electro-hydraulic servo pressure testing machine specimen to carry out the static axial compression performance test. The test was divided into two stages: preloading and formal loading. First, the tiny gap between the bearing plate and the specimen was eliminated by preloading, and the preload was 20% of the ultimate bearing capacity. In the formal loading, displacement control was used first, and the load was loaded to 50kN at a speed of 3 mm/min, and then the load was transferred to the force-controlled loading method, and the load was loaded at a speed of 50 kN/min. When the load on the component cannot continue to increase, it was considered that the component was damaged.
Figure 4 shows the layout of strain gauges and displacement gauges on the surface of the specimen. In this test, two strain gauges were arranged in the middle of the adjacent surfaces of the corroded RC column, one for measuring the horizontal strain and one for measuring the vertical strain. For the corroded column reinforced by UHPC, the same strain arrangement is adopted on the surface of UHPC. In addition, since the test section is only 400 mm in the middle of the rusted column, L-shaped steel sheets are pasted at both ends of the test section, and displacement gauges D1 and D2 with a range of 30 mm are installed at both ends of the steel sheet, and the bases of the two displacement gauges are placed on the backing plate, the vertical displacement of the test section can be obtained by subtracting the readings of the two displacement meters during the loading process. At the same time, two displacement gauges D3 and D4 are arranged on the other two sides to measure the lateral deformation of the corroded RC column.
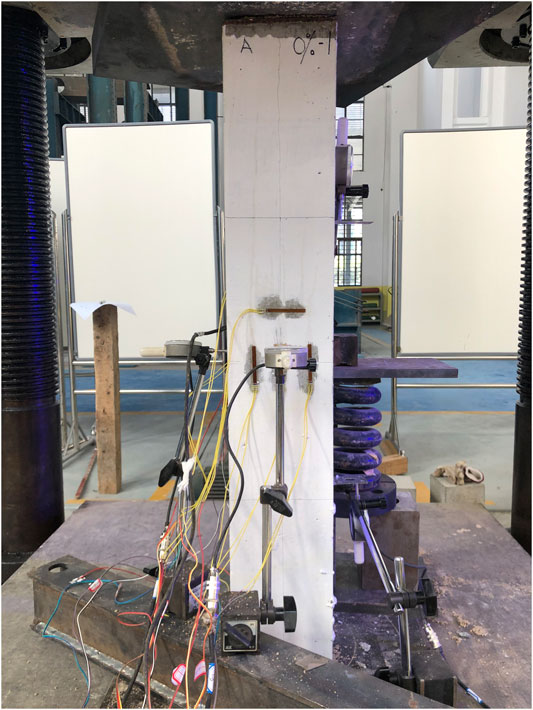
FIGURE 4. Loading set-up of the axial compression test.
The failure morphology of the unreinforced specimen is shown in Figure 5. The cracks of the specimen RC00 are concentrated in the end area, and this area presents a V-shaped main crack when the specimen is damaged. The failure patterns of the specimens RC10 and RC20 are significantly different from those of the RC00 specimen, mainly because the two specimens are mainly vertical cracks when they are damaged. with the increase of the corrosion rate, the vertical cracks in the corroded area gradually increase, but the spalling of the surface concrete is not significant. The RC30 specimen is not the same. Large areas of concrete spalling occurred in the corroded area, the longitudinal bars of the column are buckled by compression, and the concrete in the uncorroded area remains intact. Obviously, with the increase of the corrosion rate, the bonding force between the steel bar and the concrete, and the restraint ability of the stirrup to the longitudinal bar are greatly reduced.
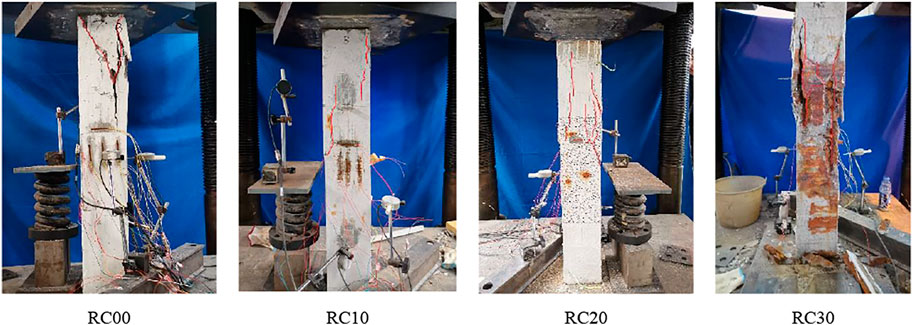
FIGURE 5. Failure mode of the unreinforced specimen.
The failure patterns of the specimens reinforced with UHPC are basically similar shown in Figure 6, and have nothing to do with the degree of corrosion. The typical failure pattern is a longitudinal crack that does not penetrate the specimen. There are some small cracks on both sides of the main crack, and UHPC debris falls during the loading process. But no UHPC peeling occurred. Obviously, UHPC greatly constrains the corrosion column and changes the failure morphology of the specimen.
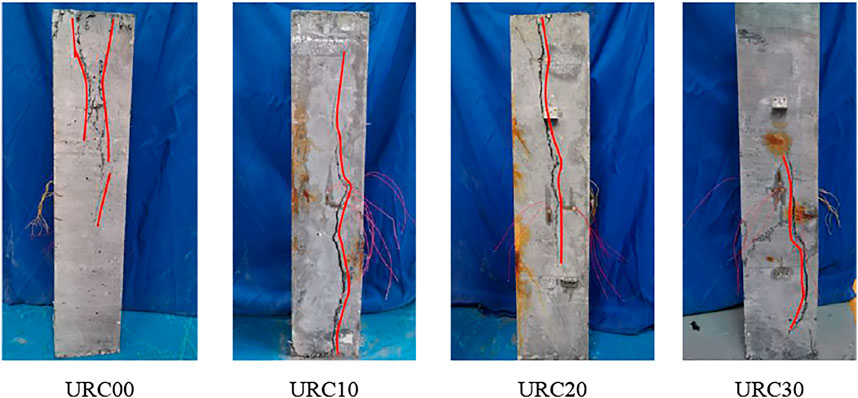
FIGURE 6. Failure mode of the strengthened specimen.
Figure 7 is the load-displacement curve of the test column. It can be seen from the figure that the load-displacement curve can be roughly divided into two stages, one is the elastic stage, where the load and displacement show a linear relationship, and the other is the plastic stage, where the displacement increases faster than the load. The bearing capacity of the specimen decreased with the increase of the corrosion rate. RC00 and URC00 were not affected by corrosion, and their bearing capacity was the largest among similar specimens. RC30 and URC30 were most affected by corrosion and had the smallest bearing capacity. In the RC group, the slopes of the curves of the specimens with corrosion rates of 0%, 10%, and 20% are all close, indicating that the difference in the stiffness of the structure is small, but when the corrosion rate of the components reaches 30%, the stiffness of the structure decreases significantly. When the corrosion rate of the steel bar is high, the surface of the original specimen will have rust expansion cracks, and the adhesion between the steel bar and the original structure will become poor, which may be the main reason for this phenomenon. Compared with the RC group, the average peak load of the specimen in the URC group increased from 1000 to 1900 kN, and the average peak displacement increased from 0.85 to 1.2 mm, which indicates that the bearing capacity and ductility of corroded columns have been significantly improved after UHPC retrofitting. In addition, the slope of URC30 is close to that of other specimens in this group, and there is no significant decrease in stiffness, indicating that UHPC has a good retrofitting effect on RC columns with high corrosion rates.
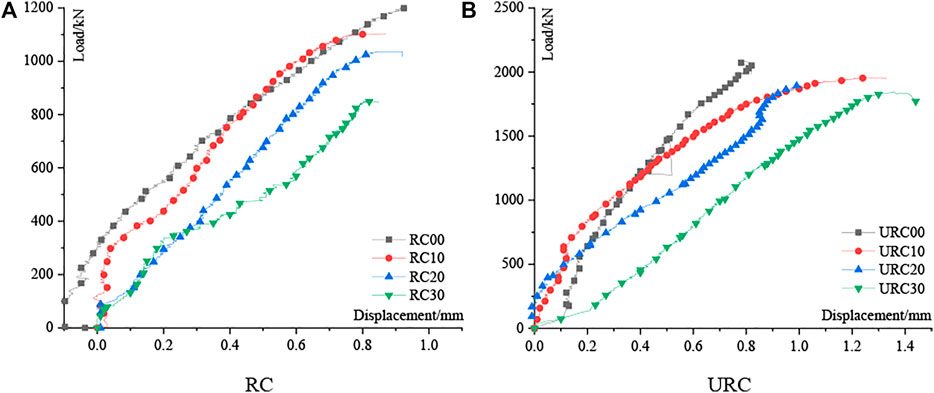
FIGURE 7. Load-displacement of the specimen. (A) RC. (B) URC.
Figure 8 shows the load-strain curve of the unreinforced column. “A” and “B” denote adjacent two sides, and “V” and “H” represent vertical and horizontal strain, respectively. It can be seen that the difference between the same strains on the adjacent two sides is very small, indicating that the test column basically maintains a good axial compression state under the vertical load. Similar to the load-displacement curve, the load-strain curve can be roughly divided into two stages. The first stage is the linear elastic stage. The load and strain increase in equal proportions, and the integrity of the structure is good. The second stage is the plastic stage. The growth rate slows down, the strain increases more significantly. The surface begins to produce micro-cracks and begins to develop, and the overall stiffness of the structure gradually decreases. Cracks appears on the surface of the structure, indicating that the specimens entered the second stage. The cracking loads of the four specimens are 1,080, 900, 950, and 600 kN in turn. Obviously, when the corrosion rate increases significantly, the cracking load of the structure is smaller. In addition, the longitudinal strain is significantly larger than the transverse strain during the loading process, and the Poisson coefficient of the test columns with the design corrosion rate of 0%, 10%, and 20% is about 0.25, but the test column with the design corrosion rate of 30% increases to 0.65.
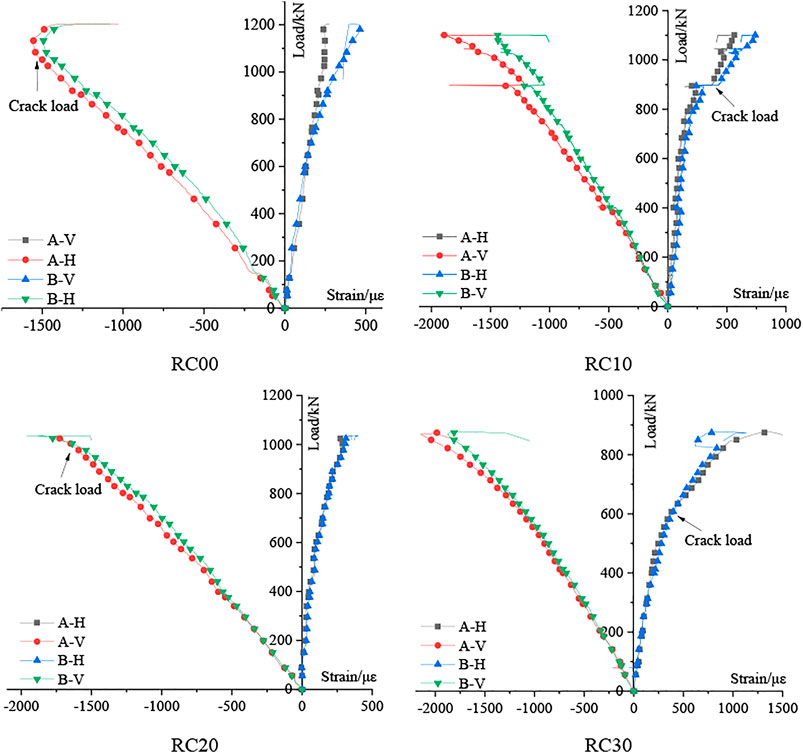
FIGURE 8. Load-strain curve of unreinforced columns.
Figure 9 is a comparison diagram of the four specimens, from which it can be seen that the slope of the load-strain curve decreases with the increase of the corrosion rate. The transverse strain and longitudinal strain of the test columns with the corrosion rate of 0%, 10%, and 20% are relatively close, indicating that when the corrosion rate is not high, the stiffness of the structure does not decrease significantly, but when the corrosion rate reaches 30%, the stiffness of the specimen is significantly weakened. This is because with the increase of the corrosion rate, the restraint of the stirrups on the core concrete and the supporting effect of the longitudinal bars are greatly reduced, and even the stirrups are rusted, which leads to the buckling of the longitudinal bars. Under the vertical action, the specimen has a large deformation in the horizontal direction.
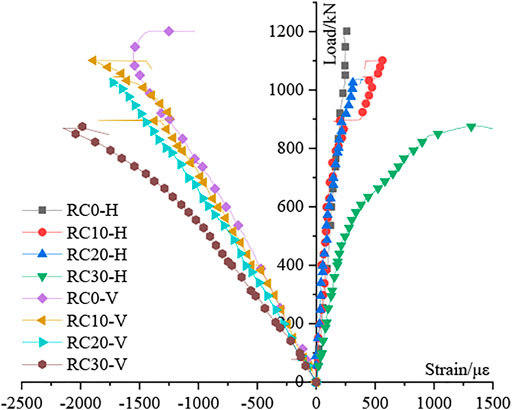
FIGURE 9. Load-strain curve comparison of unreinforced columns.
Figure 10 is the load-strain curve of the reinforced column. It can be seen that with the increase of the load, the mechanical performance of the reinforced column shows two stages: in the first stage, whether the reinforced column is the core concrete or the retrofitting layer, it is in the completely linear elastic stage, the longitudinal and transverse strains are small and basically synchronous, and the restraint effect of the retrofitting layer is not yet obvious; in the second stage, the specimen enters the elastic-plastic working stage, the UHPC surface strain and the core concrete strain development are no longer synchronized, the UHPC surface begins to generate micro-cracks and begins to develop, the steel fibers in the UHPC material begin to provide tensile strength, and the retrofitting layer begins to core concrete provides restraint.
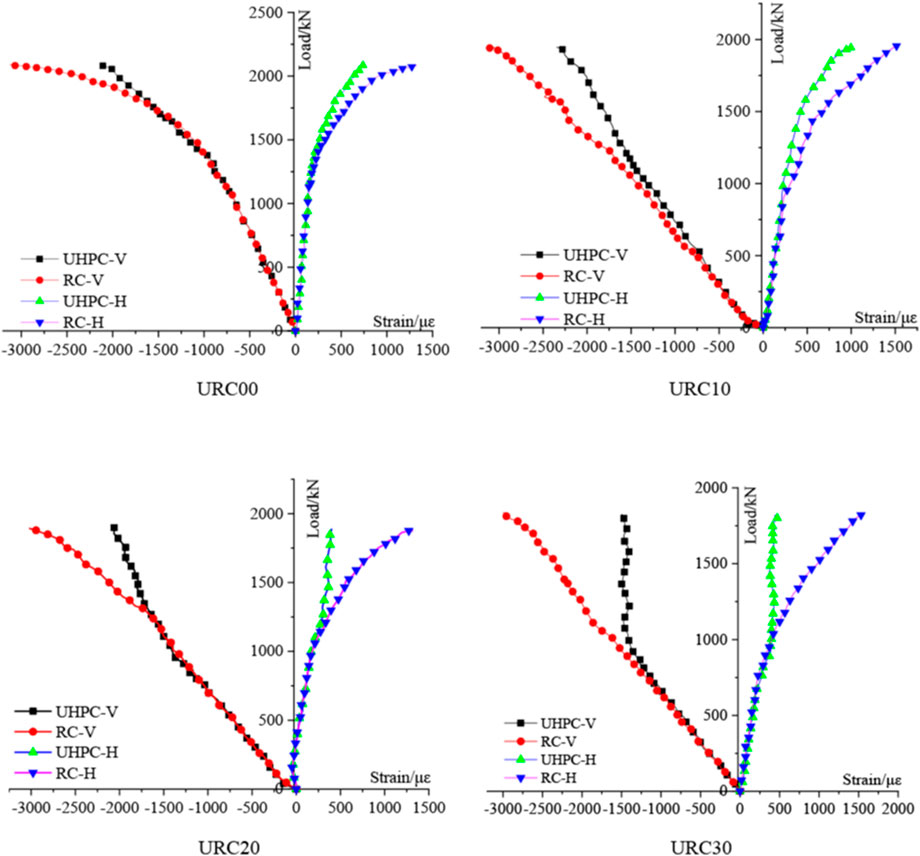
FIGURE 10. Load-strain curve of reinforced column.
In addition, it can be seen that when the corrosion rate is low, the strain of the UHPC reinforced layer is not completely consistent with the original structure, and the strain growth will be lower than that of the original structure, but it can basically work together until failure. With the increase of the corrosion rate, the retrofitting layer is more prone to relative slippage with the original structure, which leads to the phenomenon of peeling and failure of the retrofitting layer, so that the longitudinal and transverse strains of the reinforcement layer are small. However, in general, compared with the corroded column, the ultimate load, peak strain and ductility of the reinforced column have been significantly improved, indicating that the UHPC retrofitting layer can effectively share a certain axial load of the original structure. Compared with the corroded column, the strain of the core concrete increases significantly, indicating that the retrofitting layer has a certain lateral restraint effect on the original structure. Further analysis of the curve shows that the ratio of the strain when the strain of the retrofitting layer begins to lag behind the original structure and the ultimate strain of the original structure is in the range of 0.46–0.61, which is also consistent with the theoretically derived strength utilization coefficient of the retrofitting layer in the range of 0.4–0.7. It can also be seen that the strength utilization coefficient of the UHPC retrofitting layer tends to be lower in practical applications, which can also ensure a greater safety reserve.
When the RC column is subjected to the axial load, the longitudinal bars and stirrups have different constraints on the concrete at different positions, resulting in different stress states of the concrete at different positions. According to the study of Sheikh et al.(Sheikh and Uzumeri, 1982), in the direction of the axis and the cross section of the column, the concrete at the intersection of the longitudinal bars and stirrups is the most constrained and its confinement decays outward in a parabolic fashion, as shown in Figure 11. For the convenience of calculation, it is considered that the intersection angle between the parabola and the stirrup is 45°, the ultimate bearing capacity of the corroded RC column can be expressed with Eq. 3.
Where N is the ultimate bearing capacity of the corroded RC columns, fcc, fca are the strength of the concrete in the strong restraint area and weak restraint area respectively. fc is the strength of the protective layer concrete,
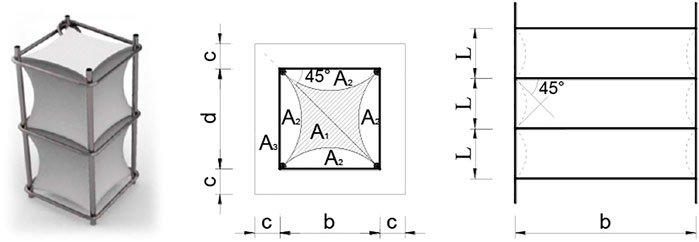
FIGURE 11. Schematic diagram of restraint partition of RC column.
Since the concrete in the strong restraint area is under triaxial compression, the dual effects of the section where the stirrup is located and the vertical section of the stirrup needs to be comprehensively considered. The strong restraint area of the square RC column (A1) can be expressed with Eq. 4. Acor represents the concrete area of the core area.
The damage coefficient
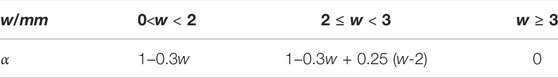
TABLE 3. The damage coefficient of the RC column subjected to axial compression corrosion.
In order to calculate the constraining effect of corroded steel bars on the core concrete, the constrained concrete strength model established in reference (Qian et al., 2002) is used to obtain the concrete strength expression in the strongly constrained area.
where
Since the improvement of the strength of the concrete in the weakly constrained area is limited, for the convenience of calculation, the increase of the strength of the concrete in the weakly constrained area is not considered, its strength can be expressed as Eq. 7.
Electrical corrosion test was adopted to achieve different corrosion rates, the relationship between the yield strength of the steel bar and the corrosion rate can be expressed as Eq. 8 (Xia et al., 2021). The cross-sectional area of the steel bar after corrosion is calculated according to the maximum damaged cross-section, and the steel bar is considered to be uniformly corroded based on the maximum corrosion rate. The cross-sectional relationship before and after corrosion is shown in Eq. 7.
where,
Based on the axial compressive performance of the corroded RC column, considering the retrofitting methods and theoretical researches such as normal concrete enlarged section method, steel hoop retrofitting and FRP retrofitting, the model of the corroded RC column reinforced around the plain UHPC is preliminarily drawn up.
where
The restraint effect of the retrofitting layers on the original structure is actually a passive restraint caused by the original structure’s deformation, and the restraint effect depends on the deformation of the original structure concrete and retrofitting layers’ hoop stiffness. Due to the improvement factor of the concrete strength of the original member, combined with the stirrup constraint model and the FRP constraint model (China Building Materials Association, 2010), the calculation formula of the Mander’s model (Mander et al., 1988) is defined as follows:
where
The original structure was chamfered and chiseled in the retrofitting process, and the constraint model of the plain UHPC retrofitting layer to the concrete in the core area is shown in Figure 12. According to the literature (China Building Materials Association, 2013), the constraint coefficient is defined in Eq. 12.
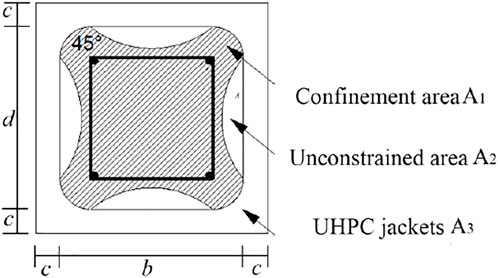
FIGURE 12. Schematic diagram of the constraint model of the UHPC retrofitting layer.
The central concrete is in biaxial compression in the plane, and the transverse force diagram for a square section is shown in Figure 13. The relationship between the stress level
where
FIGURE 13. Lateral force diagram of rectangular UHPC retrofitting layer.
The deformation of the old and new structures is considered to be consistent for the corroded RC column reinforced by UHPC, and the deformation of the reinforced structure conforms to the assumption of plane section. For normal concrete, Sargin’s model (Mander et al., 1988) gives the stress-strain relationship Eq. 15 of the structure before the bearing capacity reaches the ultimate state. The material properties of UHPC reinforced layer are between concrete and steel, so its compression state is similar to the ideal elastic-plastic. Its constitutive relation can be obtained with Eq. 16.
where
There is an initial stress
Normal concrete’s peak strain (
Combined Eq. 18 with Eq. 15, the material utilization degree coefficient of UHPC(
Obviously,
The calculation of RC columns strengthened with UHPC jacket is similar to that with RC jacket. When normal concrete is used to strengthen, the strength utilization factor is suggested to be 0.8 (Mander et al., 1988). However, it can be seen that the strength of UHPC material is much greater than that of normal concrete, when
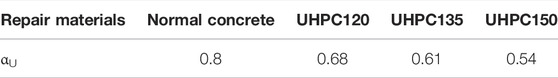
TABLE 4. strength utilization factor of UHPC without initial stress.
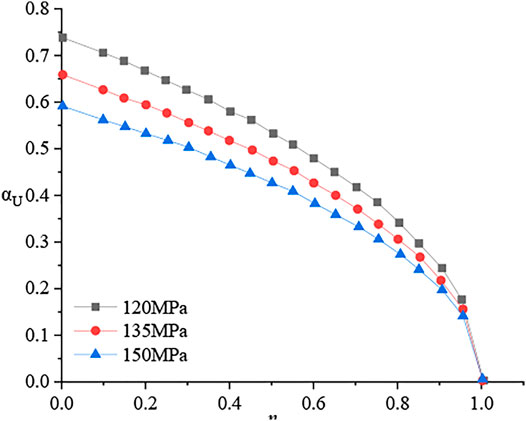
FIGURE 14. Influence of
When calculating the axial compressive bearing capacity of corroded RC columns, several important parameters need to be determined experimentally. The standard value of concrete cube strength (
It is also necessary to obtain the damage coefficient of the protective layer section by measuring the width of the rust expansion crack on the surface of the rusted column before loading, so as to characterize the reduction of the compression section of the member due to the corrosion of the steel bar. The damage coefficients of RC10, RC20 and RC30 are 0.97, 0.91, and 0.79, respectively.
n addition, the influence of corrosion on the axial compressive bearing capacity of steel bars is considered, which is mainly reflected in the two aspects of cross-sectional area and yield strength. After taking out the steel bar, the cross section at the maximum pit corrosion is used as the calculation index to obtain the control cross-sectional area of the steel bar under different corrosion rates, and then the yield strength of the longitudinal bar after corrosion is calculated.
When calculating the axial compressive bearing capacity of corroded RC columns reinforced with UHPC, calculating the ultimate bearing capacity of corroded RC columns is necessary. Then, the concrete strength improvement coefficient is needed to be determined. Combined with the theoretical model calculation and the actual test situation, the concrete strength improvement coefficient
Figure 15 compares the results of theoretical calculations and experiments. It can be seen that the error between the experimental results and the theoretical calculation values is within 8%, indicating that the theoretical calculation values are in good agreement with the experimental values. It shows that the reliability of the theoretical calculation model of the axial compressive bearing capacity of corroded RC column reinforced with UHPC.
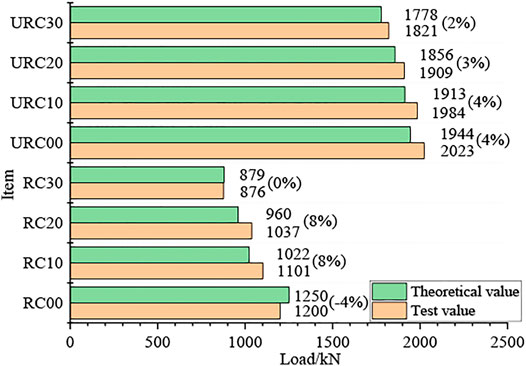
FIGURE 15. Comparison of theoretical calculation results and experimental values.
1) The ultimate compressive resistance and failure mode of the RC corroded column were affected by the corrosion rate. Compared with the uncorroded column, the ultimate compressive resistance of the specimen with the corrosion rate of 10%, 20%, and 30% decreased by 8.3%, 13.5%, and 27% respectively. Axial cracking was the typical mode when the rust rate was less than 20%, and the cracks in the rusted area gradually increased with the increase of the rust rate. However, the concrete of the protective layer fell off significantly, and the longitudinal reinforcement also yielded obviously when the corrosion rate reached 30%.
2) The ultimate compressive resistance and corresponding displacement of the specimens reinforced with UHPC were significantly improved, and the improvement rates of the two were more than 60 and 30%, respectively. The failure mode of the specimen with a corrosion rate of 30% also changed to longitudinal cracking of the UHPC layer. It shows that UHPC jacketing is a fair choice for retrofitting corroded RC columns.
3) On the basis of considering the influence of bar corrosion, the concrete strength improvement coefficient and the UHPC strength utilization coefficient were introduced, and the calculation formula of the bearing capacity of the corroded RC column before and after retrofitting was established. The error between the experimental value and the theoretical calculation value was within 8%.
The original contributions presented in the study are included in the article/Supplementary Material, further inquiries can be directed to the corresponding author.
JC: program formulation; ZW: Thesis writing; AX: Test implementation. JZ: Technical support.
The authors highly appreciate the financial support from the National Natural Science Foundation of China (Grant No. U20A20314, 51908093, and 52008066), the Natural Science Foundation of Chongqing, China (Grant No. cstc2019jcyj-cxttX0004, cstc2020jcyj-bshX0007, and cstc2020jcyj-msxmX0088), China Postdoctoral Science Foundation (2021M693919), the Science and Technology Project of Huibei Provincial Transportation Department (Grant No. 2020-2-1-1), and the Chongqing Jiaotong University Graduate Research and Innovation Fund (Grant No. 2020B0004).
Author JC was employed by the company Chongqing City Transportation Development & investment Group Co., Ltd. Author ZW was employed by the company Chongqing Railway Group Co., Ltd. Author AQ was employed by the company Second Harbor Engineering Company Ltd.
The remaining author declares that the research was conducted in the absence of any commercial or financial relationships that could be construed as a potential conflict of interest.
All claims expressed in this article are solely those of the authors and do not necessarily represent those of their affiliated organizations, or those of the publisher, the editors and the reviewers. Any product that may be evaluated in this article, or claim that may be made by its manufacturer, is not guaranteed or endorsed by the publisher.
Algburi, A. H. M., Sheikh, M. N., and Hadi, M. N. S. (2019). Analytical Investigation on the Behavior of Circular and Square RC Columns Strengthened with RPC and Wrapped with FRP under Uniaxial Compression. J. Building Eng. 25, 100833. doi:10.1016/j.jobe.2019.100833
Ali Dadvar, S., Mostofinejad, D., and Bahmani, H. (2020). Strengthening of RC Columns by Ultra-high Performance Fiber Reinforced concrete (UHPFRC) Jacketing. Construction Building Mater. 235, 117485. doi:10.1016/j.conbuildmat.2019.117485
China Building Materials Association (2018). Fundamental Characteristics and Test Methods of Ultra-high Performance concrete[S].
China Building Materials Association (2013). Code for Design of Strengthening concrete structure[S].
Du, J., Meng, W., Khayat, K. H., Bao, Y., Guo, P., Lyu, Z., et al. (2021). New Development of Ultra-highperformance concrete (UHPC). Composites B: Eng. 224, 109220. doi:10.1016/j.compositesb.2021.109220
Estevan, L., Baeza, F. J., Bru, D., and Ivorra, S. (2020). Stone Masonry Confinement with FRP and FRCM Composites. Construction Building Mater. 237, 117612. doi:10.1016/j.conbuildmat.2019.117612
Fallah Pour, A., Nguyen, G. D., Vincent, T., and Ozbakkaloglu, T. (2020). Investigation of the Compressive Behavior and Failure Modes of Unconfined and FRP-Confined concrete Using Digital Image Correlation. Compos. Structures 252, 112642. doi:10.1016/j.compstruct.2020.112642
Feng, S., Xiao, H., and Li, H. (2020). Comparative Studies of the Effect of Ultrahigh-Performance concrete and normal concrete as Repair Materials on Interfacial Bond Properties and Microstructure. Eng. Structures 222, 111122. doi:10.1016/j.engstruct.2020.111122
Guan, D., Liu, J., Jiang, C., Chen, Z., and Guo, Z. (2021). Shear Behaviour of the UHPC-NSC Interface with Castellated Keys: Effects of Castellated Key Dimension and Dowel Rebar. Structures 31, 172–181. doi:10.1016/j.istruc.2021.01.088
Hadi, M. N. S., and Li, J. (2004). External Reinforcement of High Strength concrete Columns[J]. Compos. Structures 65 (3), 279–287. doi:10.1016/j.compstruct.2003.11.003
Hadi, M. N. S., Algburi, A. H. M., Sheikh, M. N., and Carrigan, A. T. (2018). Axial and Flexural Behaviour of Circular Reinforced concrete Columns Strengthened with Reactive Powder concrete Jacket and Fibre Reinforced Polymer Wrapping. Construction Building Mater. 172, 717–727. doi:10.1016/j.conbuildmat.2018.03.196
Hadi, M. N. S. (2009). Behaviour of Eccentric Loading of FRP Confined Fibre Steel Reinforced concrete Columns. Construction Building Mater. 23 (2), 1102–1108. doi:10.1016/j.conbuildmat.2008.05.024
Hu, B., Zhou, Y., Xing, F., Sui, L., and Luo, M. (2019). Experimental and Theoretical Investigation on the Hybrid CFRP-ECC Flexural Strengthening of RC Beams with Corroded Longitudinal Reinforcement. Eng. Structures 200, 109717. doi:10.1016/j.engstruct.2019.109717
Hu, M., Han, Q., Wu, S., et al. (2021). Shear Capacity of Precast Concrete Shear Keys with Ultrahigh-Performance Concrete for Connections[J]. J. Bridge Eng. 26 (7), 4021036. doi:10.1061/(asce)be.1943-5592.0001734
Hwang, Y.-H., Yang, K.-H., Mun, J.-H., and Kwon, S.-J. (2020). Axial Performance of RC Columns Strengthened with Different Jacketing Methods. Eng. Structures 206, 110179. doi:10.1016/j.engstruct.2020.110179
Jiang, C., Wu, Y.-F., and Dai, M.-J. (2018). Degradation of Steel-To-concrete Bond Due to Corrosion. Construction Building Mater. 158, 1073–1080. doi:10.1016/j.conbuildmat.2017.09.142
Karimipour, A., and Edalati, M. (2020). Retrofitting of the Corroded Reinforced concrete Columns with CFRP and GFRP Fabrics under Different Corrosion Levels[J]. Eng. Structures 228, 111523.
Lam, L., and Teng, J. G. (2003). Design-oriented Stress–Strain Model for FRP-Confined Concrete[J]. Construction Building Mater. 17 (6), 471–489. doi:10.1016/s0950-0618(03)00045-x
Ma, C.-K., Apandi, N. M., Sofrie, C. S. Y., Ng, J. H., Lo, W. H., Awang, A. Z., et al. (2017). Repair and Rehabilitation of concrete Structures Using Confinement: A Review. Construction Building Mater. 133, 502–515. doi:10.1016/j.conbuildmat.2016.12.100
Mander, J. B., Priestley, M. J. N., and Park, R. (1988). Theoretical Stress‐Strain Model for Confined Concrete. J. Struct. Eng. 114 (8), 1804–1826. doi:10.1061/(asce)0733-9445(1988)114:8(1804)
Meng, Z., Liu, Q. f., Xia, J., Cai, Y., Zhu, X., Zhou, Y., et al. (2022). Mechanical-transport-chemical Modeling of Electrochemical Repair Methods for Corrosion‐induced Cracking in marine concrete. Computer aided Civil Eng. doi:10.1111/mice.12827
Qian, J., Cheng, L., and Zhou, D. (2002). Behavior of Axially Loaded concrete Columns Confined with Ordinary Hoops [J]. J. Tsinghua Univ. (Science&technology) (10), 1369–1373.
Qin, F., Zhang, Z., Yin, Z., Di, J., Xu, L., and Xu, X. (2020). Use of High Strength, High Ductility Engineered Cementitious Composites (ECC) to Enhance the Flexural Performance of Reinforced concrete Beams. J. Building Eng. 32, 101746. doi:10.1016/j.jobe.2020.101746
Shan, B., Xu, C., Lai, D. D., Xiao, Y., and Li, T. Y. (2020). Experimental Research on Compressive Behavior of Seawater and Sea Sand concrete-filled RPC Tubes. Eng. Structures 222, 111117. doi:10.1016/j.engstruct.2020.111117
Sheikh, S. A., and Uzumeri, S. M. (1982). Analytical Model for Concrete Confinement in Tied Columns. J. Struct. Div. 108 (12), 2703–2722. doi:10.1061/jsdeag.0006100
Song, Q., Yu, R., Shui, Z., Rao, S., Fan, D., and Gao, X. (2020). Macro/micro Characteristics Variation of Ultra-high Performance Fibre Reinforced concrete (UHPFRC) Subjected to Critical marine Environments. Construction Building Mater. 256, 119458. doi:10.1016/j.conbuildmat.2020.119458
Wang, L., Su, R. K. L., Cheng, B., Li, L. Z., Wan, L., and Shan, Z. W. (2017). Seismic Behavior of Preloaded Rectangular RC Columns Strengthened with Precambered Steel Plates under High Axial Load Ratios. Eng. Structures 152, 683–697. doi:10.1016/j.engstruct.2017.09.048
Wu, Y.-F., Liu, T., and Oehlers, D. J. (2006). Fundamental Principles that Govern Retrofitting of Reinforced Concrete Columns by Steel and FRP Jacketing. Adv. Struct. Eng. 9 (4), 507–533. doi:10.1260/136943306778812769
Xia, R., Zhang, H., Zhou, J., Liao, L., Zhang, Z., and Yang, F. (2021). Probability Evaluation Method of cable Corrosion Degree Based on Self-Magnetic Flux Leakage. J. Magnetism Magn. Mater. 522, 167544. doi:10.1016/j.jmmm.2020.167544
Xie, J., Fu, Q., and Yan, J.-B. (20192019). Compressive Behaviour of Stub concrete Column Strengthened with Ultra-high Performance concrete Jacket. Construction Building Mater. 204, 643–658. doi:10.1016/j.conbuildmat.2019.01.220
Zhang, Z., Liu, S., Yang, F., Weng, Y., and Qian, S. (2021). Sustainable High Strength, High Ductility Engineered Cementitious Composites (ECC) with Substitution of Cement by rice Husk Ash. J. Clean. Prod. 317, 128379. doi:10.1016/j.jclepro.2021.128379
Zhang, Z., Yang, F., Liu, J.-C., and Wang, S. (2020). Eco-friendly High Strength, High Ductility Engineered Cementitious Composites (ECC) with Substitution of Fly Ash by rice Husk Ash. Cement Concrete Res. 137, 106200. doi:10.1016/j.cemconres.2020.106200
Keywords: ultra-high performance concrete (UHPC), confinement, bridge engineering, compressive behavior, column strengthening
Citation: Chen J, Wang Z, Xu A and Zhou J (2022) Compressive Behavior of Corroded RC Columns Strengthened With Ultra-High Performance Jacket . Front. Mater. 9:859620. doi: 10.3389/fmats.2022.859620
Received: 21 January 2022; Accepted: 03 March 2022;
Published: 31 March 2022.
Edited by:
Xijun Shi, Texas State University, United StatesCopyright © 2022 Chen, Wang, Xu and Zhou. This is an open-access article distributed under the terms of the Creative Commons Attribution License (CC BY). The use, distribution or reproduction in other forums is permitted, provided the original author(s) and the copyright owner(s) are credited and that the original publication in this journal is cited, in accordance with accepted academic practice. No use, distribution or reproduction is permitted which does not comply with these terms.
*Correspondence: Zongshan Wang, d3pzaEBtYWlscy5jcWp0dS5lZHUuY24=
Disclaimer: All claims expressed in this article are solely those of the authors and do not necessarily represent those of their affiliated organizations, or those of the publisher, the editors and the reviewers. Any product that may be evaluated in this article or claim that may be made by its manufacturer is not guaranteed or endorsed by the publisher.
Research integrity at Frontiers
Learn more about the work of our research integrity team to safeguard the quality of each article we publish.