
94% of researchers rate our articles as excellent or good
Learn more about the work of our research integrity team to safeguard the quality of each article we publish.
Find out more
ORIGINAL RESEARCH article
Front. Mater., 03 May 2022
Sec. Structural Materials
Volume 9 - 2022 | https://doi.org/10.3389/fmats.2022.859214
This article is part of the Research TopicAdvanced Concretes and Their Structural ApplicationsView all 23 articles
 Jinlong Jiang1,2Jingchen Leng1,2Jiangtao Zhang1,2*Jincen Guo1,2
Using traditional stud connectors to connect the ultra-high-performance concrete layer and steel deck is detrimental to the construction speed and fatigue performance of the composite structure. Connecting the steel–UHPC interface with toughened epoxy bonding is a potential alternative to avoid this issue. To explore whether the toughened epoxy bonding interface can reduce the amount of bridge deck studs or even cancel the studs, a numerical simulation was conducted in this paper. The non-toughened epoxy bonding interface, the toughened epoxy bonding interface, a few studs + toughened epoxy bonding interface, and the full stud connection interface were designed to study the interfacial behavior of the steel–UHPC composite deck. Moreover, the constitutive model of the toughened epoxy bonding interface is verified through the direct shear test and compression-shear test. The results show that the maximum interface shear stress of the toughened epoxy bonding interface is 0.61 MPa under the standard wheel load, which is 20.78% lower than that of the non-toughened epoxy bonding interface. Under the overload, the interface failure of the toughened epoxy bonding interface is more concentrated and exhibits a smaller damage area compared with the non-toughened epoxy bonding interface. When the interface defect is 5%, the toughened epoxy bonding interface only has a few interface damages, exhibiting good defect tolerance. Compared to the traditional full stud connection interface, the interface shear stress in the few studs + toughened epoxy bonding interface is more uniform, which avoids the stress concentration in the root of studs, and the studs’ average stress is significantly reduced by 63.21%. It is verified that using the toughened epoxy bonding interface can significantly reduce the amount of studs.
The orthotropic steel bridge deck is the main deck form of a long-span steel bridge due to its lightweight and high-strength advantages. However, a wide range of application practices shows that there is fatigue cracking, pavement layer damage, and pavement layer interface failure of the orthotropic steel bridge deck (Wang et al., 2019a; Xu et al., 2021a). These defects are mainly caused by insufficient local stiffness, the weld density, and interface damage between the steel bridge deck and the pavement layer (Jong, 2004; Xu et al., 2021b; Li et al., 2021).
Cementitious composites have been extensively studied, including ECC, UHPC, and SHCC (Zhang et al., 2022). Ultra-high-performance concrete (UHPC), as a new type of steel fiber-reinforced concrete with high strength, high ductility, and excellent durability (Lian et al., 2021) (Zhang et al., 2021), can enhance the overall stiffness of the orthotropic steel bridge deck after forming a combined bridge deck system with the steel bridge deck. Therefore, it can solve the disease caused by the traditional asphalt pavement (Shao et al., 2013). In the steel–concrete composite bridge deck, UHPC, as a rigid pavement layer, can alleviate the fatigue cracking of the bridge deck structure and improve the crack resistance of the pavement layer (Shao et al., 2018a; Zhang et al., 2020). Murakoshi et al. (Murakoshi et al., 2008) used steel fiber concrete to conduct a rigid pavement for an orthotropic steel bridge deck and found that the stiffness of the bridge deck has been greatly improved, and the fatigue cracking of the steel bridge deck and the interface damage of the pavement layer have been well eliminated. Shao et al. proposed the steel–UHPC lightweight composite bridge deck (Shao et al., 2018a) and steel–ultrathin UHPC composite bridge deck (Shao et al., 2018b; Wang et al., 2020), respectively, for the steel–UHPC composite bridge deck system and verified the effect of UHPC on enhancing the stiffness of steel bridge deck pavement through experiments. However, the reliable connection between the UHPC layer and the steel bridge deck significantly affects the combined effect (Zou et al., 2018; Zou et al., 2021a). Affected by steel–concrete connection modes, the UHPC and the orthotropic bridge deck can be divided into the following two types of connection modes: mechanical connection parts, such as studs (Zou et al., 2020), and adhesives, such as epoxy adhesives (Duan et al., 2020). The stud connection technology has been relatively mature, which can ensure a reliable connection between the steel bridge deck and the prefabricated UHPC bridge deck. However, in practical engineering, steel bridge decks often need to be welded with a large number of studs. Welding defects and residual stresses are inevitably introduced in stud welding, which is unfavorable to the fatigue resistance of the orthotropic deck (Bouazaoui et al., 2007). Meanwhile, when UHPC is used as a structural layer of the orthotropic steel deck, the number of studs on a bridge deck may exceed millions, which brings heavy welding work (Shao et al., 2013). When epoxy bonding is used at the steel–concrete interface, both steel and concrete surfaces are fully bonded, avoiding stress concentration caused by welding studs (Si Larbi et al., 2009; Jurkiewiez et al., 2011) and uneven shear transfer (Zou et al., 2018), which is beneficial to the fatigue performance of steel structures (Qin et al., 2020).
Larbi et al. (Si Larbi et al., 2009) conducted shear and tensile tests on 11 (eleven) steel–concrete interface specimens and found that when the specimens are loaded in a single direction, the normal and tangential ultimate stresses at the epoxy-bonded interface are 3.5 and 6.4 MPa, respectively. Under the bidirectional loading condition, the shear and tensile ultimate stresses at the interface follow the quadratic relation. Berthet et al. (Berthet et al., 2011) carried out a shear test of the epoxy bond interface between steel and concrete and found that the shear strength of the epoxy bond interface is 3.4–5.4 MPa, which is greater than the shear strength of the concrete. Buitelaar et al. (Buitelaar et al., 2004) conducted an experimental study on UHPC steel bridge decks and obtained that the stress concentration near the interface could be avoided when the steel plate surface was polished and applied with an epoxy adhesive before UHPC was poured. When the interface is subjected to normal tension, the bonding strength of the epoxy interface is 3–5 MPa. Q. Sun et al. (Sun et al., 2017) spread limestone evenly after applying epoxy on the steel plate and conducted the tensile test and push-out test on this interface form. The test results reveal that the UHPC–steel plate interface leads to high bonding performance under the single stress state of normal and tangential directions, and its tensile and shear strengths reach about 2 MPa. Luo (Luo et al., 2012) et al. simulated the mechanical properties of steel–concrete composite beams with a three-dimensional nonlinear finite element model based on push-out tests. The test results show that the epoxy adhesive between steel and concrete can provide a bond strength of 6.36 MPa, and the epoxy adhesive has a great influence on the mechanical properties of the composite beam. He et al. (He, 2020) conducted the shear test of the UHPC–steel interface and the positive bending moment loading test of the prefabricated UHPC–steel composite bridge deck. They found that the orthotropic composite bridge deck with epoxy has better ductility and higher bearing capacity and can guarantee the connection between the UHPC pavement and steel bridge deck. The above research results show that compared with the stud connectors, epoxy bonding between the interface of the steel–concrete composite structure is effective. Based on the existing research on the epoxy bonding interface, this paper introduces the quartz sand admixture while using an epoxy adhesive, aiming to realize the interface toughening between the UHPC pavement layer and orthotropic steel bridge deck.
Y.Zou et al. (Zou et al., 2021b) conducted direct shear tests, tensile tests, and tension-shear tests on the interface specimens, aiming to explore the mechanical properties of the prefabricated UHPC–steel interface with an epoxy adhesive. In this study, different admixtures were introduced in the previous epoxy bonding interface test, and the interface failure mode and interface shear tensile strength were analyzed. Based on the cohesive interface element, a numerical model of the tensile specimen was established to analyze the interface failure mechanism. The results show that the interface toughness is the best when the toughened epoxy bonding interface adopts the quartz sand bonding interface. In order to further verify the effect of an epoxy adhesive on the bending performance of the prefabricated UHPC–steel composite bridge deck, Jiang et al. (Jiang et al., 2021) carried out positive bending moment loading tests on specimens with different interface states. The results show that the bending performance is the best when the surface of the steel plate is rough and the surface of the prefabricated UHPC plate is grooved. This result is successfully verified by a finite element model based on the cohesive interface element.
In order to explore whether the toughened epoxy bonding interface can reduce the amount of bridge deck studs or even cancel the studs, this paper conducted the refined numerical simulation. The non-toughened epoxy bonding interface, the toughened epoxy bonding interface, a few studs + toughened epoxy bonding interface, and the full stud connection interface were designed to study the interfacial behavior of the steel–UHPC composite deck. Moreover, the load cases, including local wheel load, UHPC shrinkage, and interface defects, were considered in the model.
The accuracy of the steel–UHPC composite deck model mainly depends on whether the constitutive of the toughened epoxy bonding interface can effectively reflect the interface’s mechanical behavior. Both interfaces are simulated with zero-thickness cohesion elements (Jiang et al., 2021), but their respective constitutive behaviors are essentially different: the toughened epoxy bonding interface adopts the toughening-friction interface constitutive model, while the non-toughened epoxy bonding interface adopts a bilinear constitutive model (Zou et al., 2021b).
The constitutive definition of the non-toughened epoxy bonding interface is divided into the elastic stage and failure stage. The failure process of the interface is mainly that the interface is not damaged in the elastic stage, the interface enters the failure stage immediately after reaching the ultimate load, and its bearing capacity is lost rapidly. This constitutive model is used for the non-toughened epoxy bonding interface in this paper, and the details are shown in Figure 1. The constitutive model is shown in
where
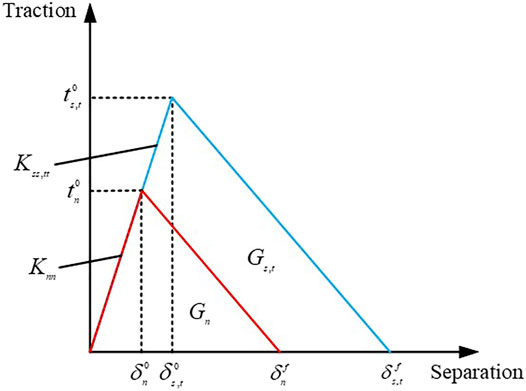
FIGURE 1. Constitutive model of the cohesive interface element (bilinear constitutive model).
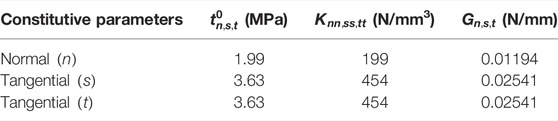
TABLE 1. Constitutive parameters of the non-toughened epoxy bonding interface.
According to the toughening properties of the steel–UHPC epoxy toughened interface, based on the basic theory of the cohesive model, a toughening-friction interface constitutive model suitable for the zero-thickness cohesion element is proposed. Compared with the bilinear constitutive model, this interface constitutive considers the plastic stage of the interface, and the normal compression in the failure stage will cause the interface tangential friction. In the finite element software ABAQUS, the bonding interface of quartz sand is simulated by the zero-thickness cohesion interface element, and the toughening-friction interface constitutive defined by the material is compiled by Fortran and realized by the subprogram VUMAT. The specific constitutive curve of the toughening-friction interface is shown in Figure 2. The constitutive model is as follows:
where
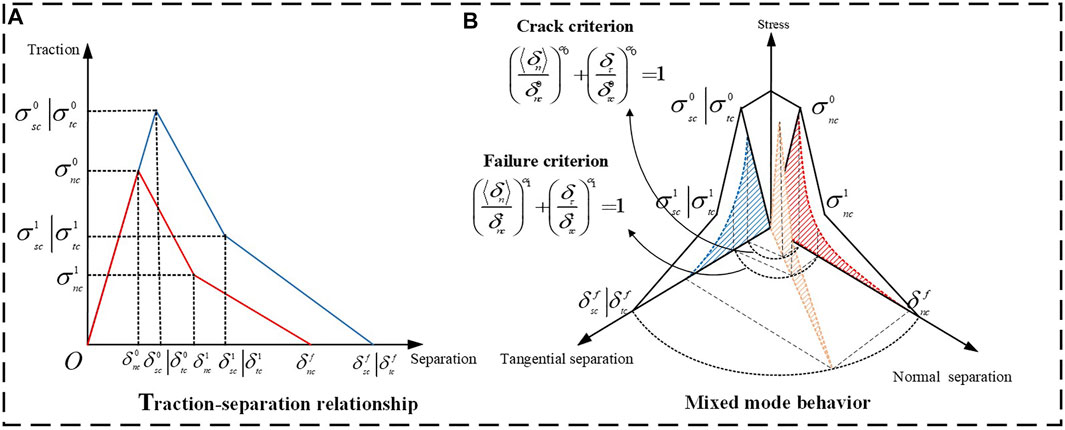
FIGURE 2. Toughened-friction interfacial constitutive model.
The specific constitutive parameters of the ductile interface are shown in Table 2.
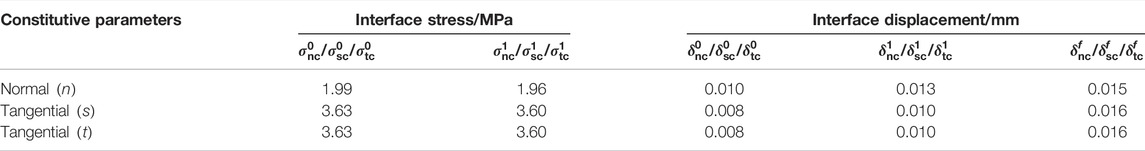
TABLE 2. Constitutive parameters of the toughened epoxy bonding interface.
The accuracy of the steel–UHPC composite deck model mainly depends on whether the constitutive of the toughened epoxy bonding interface can effectively reflect the interface’s mechanical behavior. Therefore, the toughened epoxy bonding interface constitutive will be validated in this paper. Compared with the direct shear test, the loading process of the interface in the compression shear test is still the elastic stage, plastic stage, and failure stage. However, the interface in the failure stage will be affected by tangential friction caused by normal pressure (Zou et al., 2021b). It can be seen that the toughened epoxy bonding interface has different mechanical behaviors in the direct shear state and the compression-shear state. Therefore, the interface simulation based on the toughening-friction interface constitutive model was carried out and validated by comparison with experimental results (Zou et al., 2021b), aiming to effectively reflect the mechanical behavior of the toughened epoxy bonding interface in the state of direct shear and compression shear so as to fully verify the reliability and accuracy of the interface constitutive model.
The comparison of the load–slip curves of the model and three direct shear specimens (DS-1, DS-2, and DS-3) is shown in Figure 3A. The load
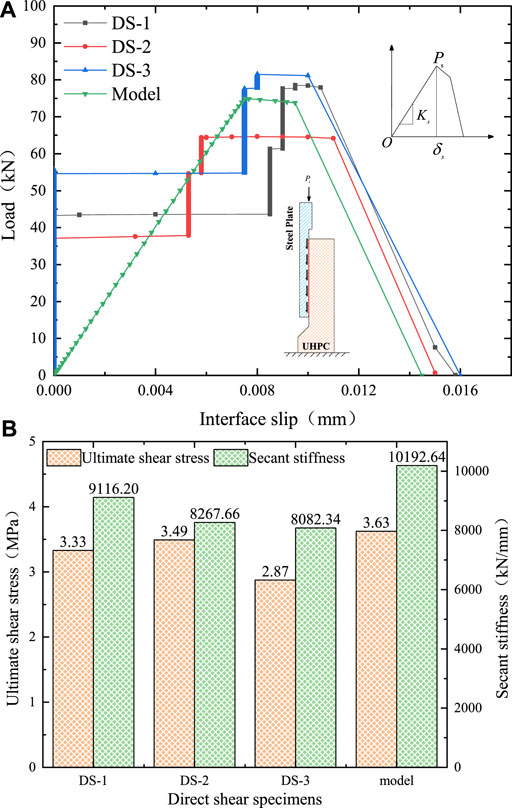
FIGURE 3. Comparison of direct shear test and model results. (A) Load–slip curve. (B) Characteristic parameters.
It can be seen from Figure 3B that in the direct shear state, the ultimate shear stress of the toughened epoxy bonding interface is between 2.87 and 3.63 MPa, and the secant stiffness
It can be seen from the curve changes of specimens CS-1, CS-2, and CS-3 in Figure 4A that the compression-shear action of the toughened epoxy bonding interface goes through loading processes of the elastic stage, plastic stage, and failure stage. Furthermore, the load–slip curves of the three compression-shear specimens are highly similar to the load–slip curves of the model. The ultimate load
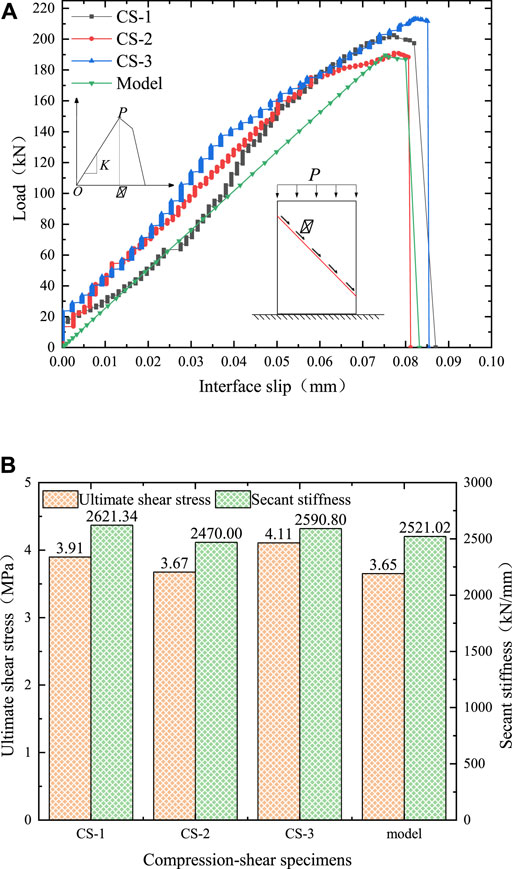
FIGURE 4. Comparison of compression-shear test and model results. (A) Load–slip curve. (B) Characteristic parameters.
As shown in Figure 4B, in the compression-shear state, the ultimate shear stress of the toughened epoxy bonding interface ranges from 3.67 to 4.11 MPa, which increases by 10.21–23.42% compared with the shear strength of the direct shear test. Since the interface friction improves the interface slip ability, the limit slip significantly increases, indicating that the overall interface performance is improved. In addition, through parameter comparison, it can be seen that the gap between the ultimate shear stress of the model and the specimen is 0.55–12.60%, and the secant stiffness
In general, through the comparative analysis of the test results and the finite element interface simulation, the constitutive model of the toughened epoxy bonding interface is reliable.
The steel–UHPC composite deck numerically simulated in this paper is the local orthotropic steel bridge deck of Humen Bridge (Shao et al., 2013). As shown in Figure 5, the total width and thickness of the orthotropic steel bridge deck are 1240 and 12 mm, respectively. The thicknesses of U-shaped stiffening ribs and diaphragms are both 8 mm. On the steel bridge deck, the UHPC layer with a thickness of 45 mm is arranged with 25Φ10 rebars longitudinally and 68Φ10 rebars horizontally, and the size of the steel reinforcement mesh is 50 × 50 mm. The diameter of the bridge deck studs is 13 mm and the height after welding is 35 mm, and they are evenly arranged at the stiffening part of the steel bridge deck. In addition, different from the literature (Shao et al., 2013), a toughened epoxy bonding interface layer with a thickness of 1 mm was added between the steel bridge deck and the UHPC layer. The longitudinal span of the entire model is 3,400 mm, the distance between the diaphragms along the longitudinal bridge direction is 3,000 mm, and the distance from the end of the composite bridge deck is 200 mm.
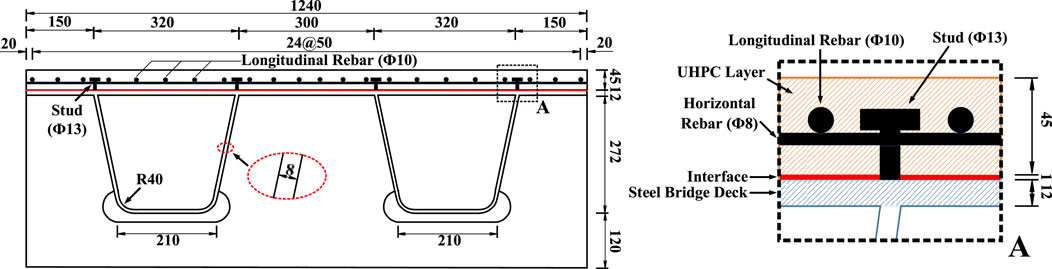
FIGURE 5. Cross-section of the steel–UHPC composite deck (unit: mm).
Two kinds of bonding interfaces are designed: the non-toughened epoxy bonding interface and toughened epoxy bonding interface. The detailed structure of each interface is shown in Figure 6, and the thickness of the interface layer is 1 mm. Figure 6A shows that the UHPC layer and the orthotropic steel bridge deck form a combined effect through the toughened epoxy bonding interface. One side of the interface and the surface of the steel plate are bonded by the epoxy layer, and the other side is paved with the UHPC layer by the embedding of quartz sand particles. In Figure 6B, for the few studs + toughened epoxy bonding interface, the longitudinal spacing of studs is 500 mm, and the transverse studs are arranged at the stiffening part of the steel bridge deck with a spacing of 320 mm. Compared with the full stud connection interface, the amount of stud on the steel bridge deck is reduced by 50%; Figure 6C shows the full stud connection interface.
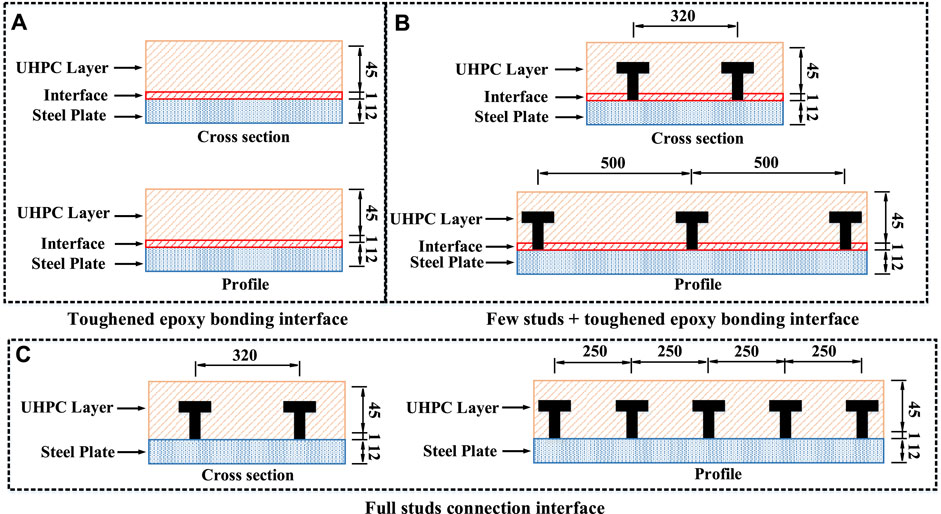
FIGURE 6. Interface design of the steel–UHPC composite deck (unit: mm).
The orthotropic steel bridge deck mainly includes U-shaped stiffening ribs, diaphragms, and steel bridge decks in the numerical model. These components are all simulated using the three-dimensional 8-node linear solid element (C3D8), which can fully simulate the nonlinear behavior of the structure. The UHPC layer is simulated using three-dimensional solid elements. The steel reinforcement mesh is simulated with T3D2 trusses. Moreover, a zero-thickness cohesive interface element (COH3D8) is introduced into the finite element analysis to simulate the toughened epoxy bonding interface and the non-toughened epoxy bonding interface.
As an elastic-plastic material, the damage and cracking behavior of UHPC can be defined by defining the CDP (concrete damaged plasticity) model in ABAQUS. In this paper, the tensile constitutive model is based on the stress–strain relationship proposed by Zhang (Zhang et al., 2015), as shown in Figure 7A. The constitutive model of compression is based on the stress–strain relationship proposed by Yang (Yang, 2007), as shown in Figure 7B. In the tensile stress–strain relationship,
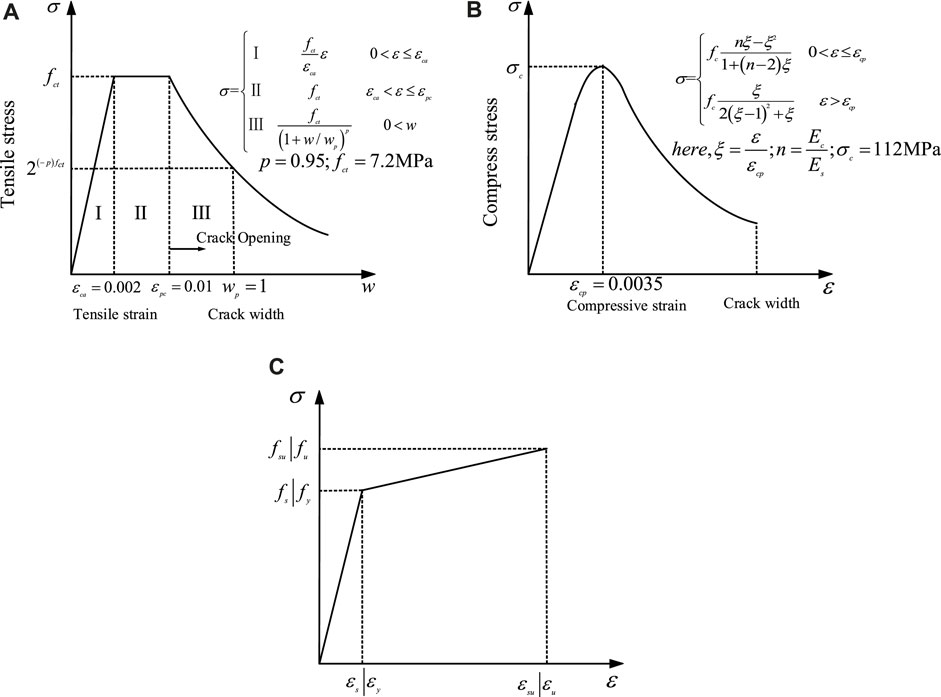
FIGURE 7. Constitutive model of UHPC in (A) tension (Zhang et al., 2015), (B) compression (Yang, 2007), and (C) steel (Ministry of Housing and Urban-Rural Development of the People’s Republic of China, 2015).
The stress–strain relationship of the steel and the rebar adopts the linear hardening elastoplastic constitutive model (Ministry of Housing and Urban-Rural Development of the People’s Republic of China, 2015) (Figure 7C); that is, after the rebar stress reaches the yield stress, the stress increases to the ultimate strength with the increase of the strain. In the stress–strain relationship of the steel deck,
The existing interface test and numerical simulation results show that when using the cohesive interface element, the epoxy bonding interface layer between steel and concrete can be effectively simulated (Wang et al., 2019b; Jiang et al., 2021). Furthermore, the experimental results (Zou et al., 2021b) related to the properties of the steel–UHPC interface show that when the steel–UHPC epoxy bonding interface is relatively thin, the epoxy layer and the steel plate interface are well bonded under pure tension or the pure shear state. Therefore, a zero-thickness cohesive interface element (COH3D8) in the model was generated by mesh offset of the steel bridge deck, and its numerical thickness was input through the material definition.
The internal constraints of the model are as follows: the U-shaped stiffening rib, diaphragms, and steel bridge decks are bound to each other achieved through “Tie” constraints; the constraint between studs and UHPC is the embedded region. The top surface of the interface layer and the bottom of the UHPC layer are bound by “Tie.” The steel reinforcement mesh is connected to the surrounding UHPC elements through embedded constraints. Given the low shear strength of the direct bond between ordinary concrete and the steel plate surface, which is only 0.4 MPa under ideal conditions, the cracked concrete will cause friction in the tangential direction of the interface (Tassios, 1979). Therefore, for the stud connection interface, the normal direction of the surface-to-surface contact properties between the UHPC layer and the steel bridge deck adopts the hard contact, and penalty function contact is adopted in the tangential direction, with a friction coefficient of 0.4 (Luo et al., 2016).
The boundary constraints of the steel–UHPC composite deck are all arranged on the side of the diaphragm. As shown in Figure 8, both boundary B-1 and boundary B-2 only constrain the vertical and transverse translational degrees of freedom to prevent the bridge deck from flipping laterally. Boundary B-3 constrains the vertical and longitudinal translational degrees of freedom, and boundary B-4 only constrains the vertical translational degrees of freedom, ensuring the statically indeterminate system of the bridge deck structure.
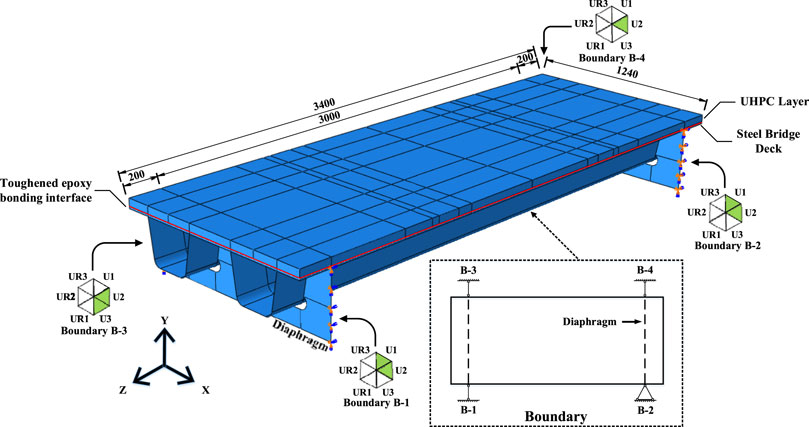
FIGURE 8. ABAQUS finite element model.
The subprogram VUMAT realizes the toughening-friction interface constitutive model, and the model is calculated and solved by the ABAQUS/Explicit module. In order to ensure the calculation accuracy of the model and reduce the calculation time, the mass scaling factor set in the explicit analysis step is 100.
According to Chinese codes, codes for design of highway bridges and culverts (JTG D60−2015) (Ministry of Transport of the People’s Republic of China, 2015), both Highway-I and Highway-II use a standard vehicle load with a total weight of 550 kN, and its specific layout is shown in Figure 9A. In the model, the wheel weight of the rear axle of the vehicle is 140 kN for bridge deck loading; that is, the weight of a single wheel is 70 kN, and the area acted by the wheel load is 0.6 m × 0.2 m. Referring to the relevant literature (Shao et al., 2013), the layout of the local wheel load is shown in Figure 9B. However, vehicle overloading on the bridge deck cannot be avoided in practical engineering. For this reason, the standard wheel load (70 kN) and the overload wheel load (350 kN), which is 5 times the standard wheel load, are considered in this paper.
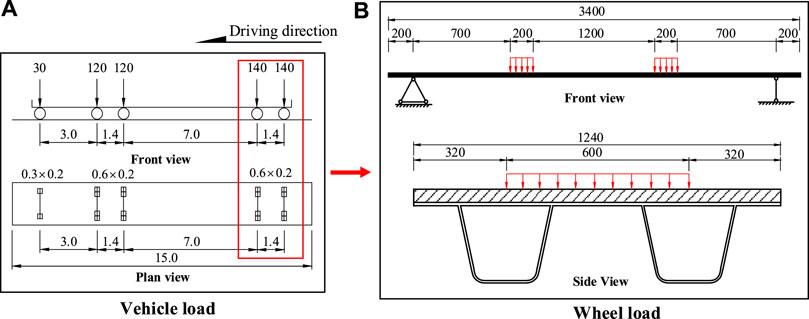
FIGURE 9. Schematic diagram of local wheel load. (A) Vehicle load. (B) Wheel load (load unit: kN, size unit: mm).
Affected by the model’s boundary conditions, the shrinkage of UHPC before and after curing will affect the stress state of the structure. In structural design, the shrinkage strain of UHPC is considered to be between 500 and 800με (Chen et al., 2018; Kamen et al., 2008). Therefore, the UHPC shrinkage strain was set as 500με, and the equivalent temperature drop method was used to simulate the UHPC shrinkage in the model. After the amount of shrinkage strain
The relative temperature decrease
where
In practical engineering, the fluidity of the epoxy adhesive, inclusions or air bubbles at the interface, etc., may cause some interfaces to fail to bond effectively. Therefore, the relative bonding area becomes an important parameter for analyzing the toughened epoxy bonding interface. For prefabricated steel–concrete composite beams based on epoxy bonding, it is necessary to ensure that the relative bonding area is greater than 90% to avoid interfacial debonding damage (Luo et al., 2012). Considering the low shear strength of the toughened epoxy bonding interface, the relative bonding area is determined to be 95% in the model. The interface defects are concentrated in the L/4 span, L/2 span, and 3L/4 span along the longitudinal length of the bridge deck. The area of the void area is 1,240 mm × 50 mm. The distribution of the specific bonding area of the interface is shown in Figure 10.
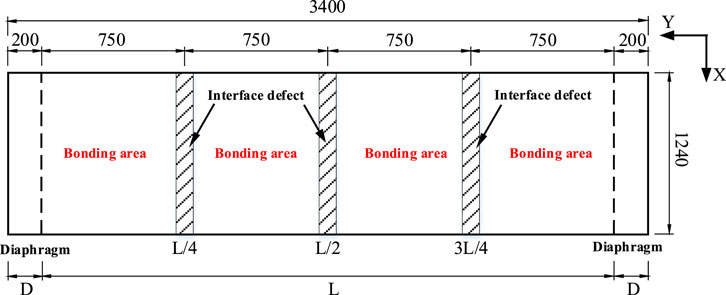
FIGURE 10. Interface defect layout (unit: mm).
When the local wheel load is the standard wheel load (70 kN), the stress distribution of the four types of interfaces in the steel–UHPC composite deck is shown in Figure 11. Here, the stress of each stud is the maximum stress of each row of studs, and the positive and negative directions of shear stress are shown in Figure 11. Comparing the toughened epoxy bonding interface with the non-toughened epoxy bonding interface, it can be found that the stress distribution of the two types of interfaces has the following characteristics: within the centerline of the local wheel load on both sides, the shear stress along the longitudinal interface is mainly concentrated near the wheel load area, and there is almost no shear stress at the mid-span; on the outside of the centerline, the shear stress is concentrated near the wheel load area and at the fulcrum. In this state, the interface cracking criterion QUADSCRT is less than 1 and the strength weakening coefficient is 0, indicating that both types of interfaces are in the elastic stage. As far as the shear stress value is concerned, the maximum shear stress of the toughened epoxy bonding interface inside and outside the centerline is both 0.61 MPa, which is 20.78% lower than that of the non-toughened epoxy bonding interface. It can be seen that the toughened epoxy bonding interface has a higher shear strength than the non-toughened epoxy bonding interface.
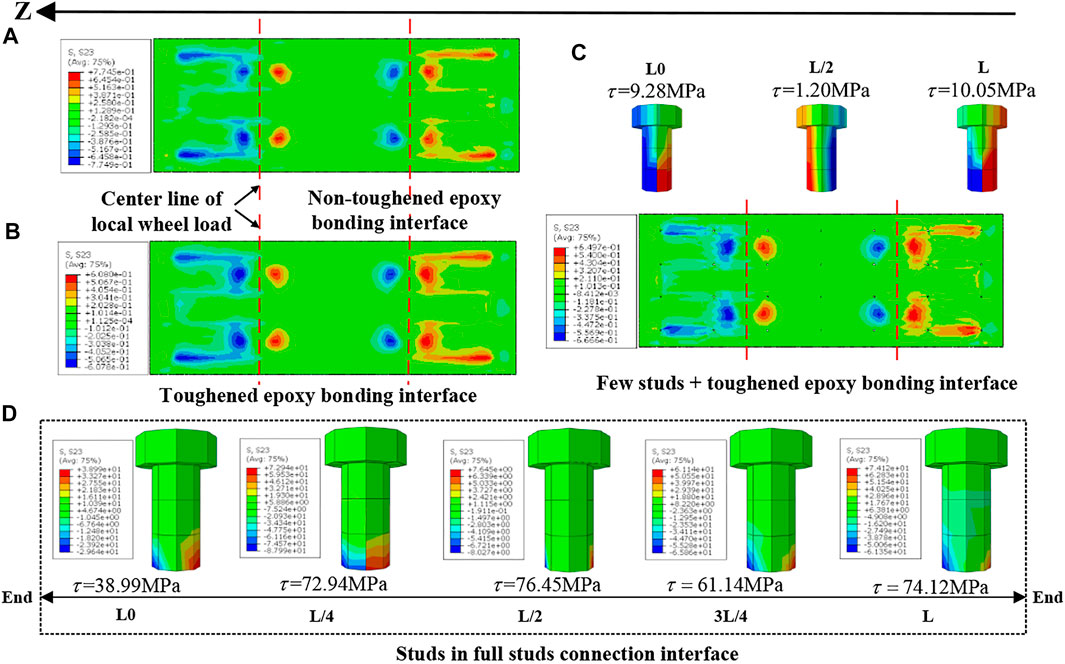
FIGURE 11. Interface stress distribution under standard wheel load. (A) Non-toughened epoxy bonding interface. (B) Toughened epoxy bonding interface. (C) Few studs + toughened epoxy bonding interface. (D) Studs in the full stud connection interface.
As shown in Figure 11A,C, under the standard load, the maximum shear stress of the studs in the full stud connection interface is mainly concentrated at the quarter-point and mid-span of the bridge deck, and the maximum shear stress is 76.45 MPa. The maximum shear stress at the fulcrum L0 is 47.40% lower than that at the fulcrum L. Furthermore, the maximum shear stress values at both ends of the bridge deck are quite different, which is mainly caused by the constraint at the fulcrum L0. On the contrary, when the interface is a few studs + toughened epoxy bonding interface, the difference between the maximum shear stress values at the fulcrum L0 and the fulcrum L is only 7.66%. The large reduction in stud shear stress may be due to the smaller model size. In this state, the toughened epoxy bonding interface’s forward and reverse shear strengths are 0.65 and 0.67 MPa, respectively, and the interface is in the elastic stage.
When the local wheel load is 5 times the standard wheel load, the non-toughened epoxy bonding interface and the toughened epoxy bonding interface begin to enter the failure stage. The interface failure mode and the shear stress distribution of the stud are shown in Figure 12. Once the value of the indicator “SDEG"
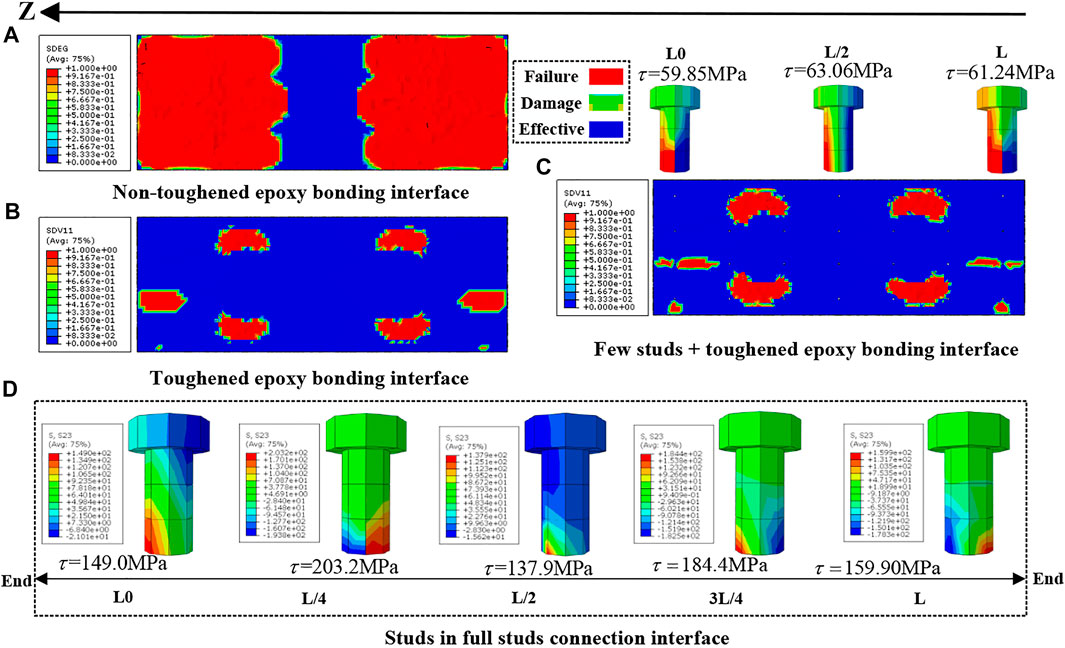
FIGURE 12. Interface stress and failure distribution under 5 times the standard wheel load. (A) Non-toughened epoxy bonding interface. (B) Toughened epoxy bonding interface. (C) Few studs + toughened epoxy bonding interface. (D) Studs in the full stud connection interface.
In the full stud connection interface, the shear stress distribution of the studs along the longitudinal bridge has the following characteristics (Figure 12D): the stud shear stress is mainly concentrated at the quarter point, and the maximum shear stress is 203.2 MPa, which is only 7.32% different from that of the stud at the fulcrum. For a few studs + toughened epoxy bonding interface, affected by the toughening of the interface, the interface failure area is concentrated in the wheel load area and near the stud’s root, and the studs’ average stress is significantly reduced by 63.21% compared with the full stud connection interface, which can be seen in Figure 12C.
After cooling by 50°C to simulate the shrinkage performance of UHPC, the stress distribution of each interface is shown in Figure 13, and the area surrounded by red is the concentration of shear stress at the interface. It can be seen from Figure 13A,B that the shear stress of the non-toughened epoxy bonding interface and the toughened epoxy bonding interface is mainly concentrated at both ends of the steel–UHPC composite bridge deck. Unlike the former, the maximum shear stress of the latter occurs at the bridge deck fulcrum. In both interfaces, as shown in Figure 13A,B, the stiffness degradation parameter SDEG and strength weakening coefficient
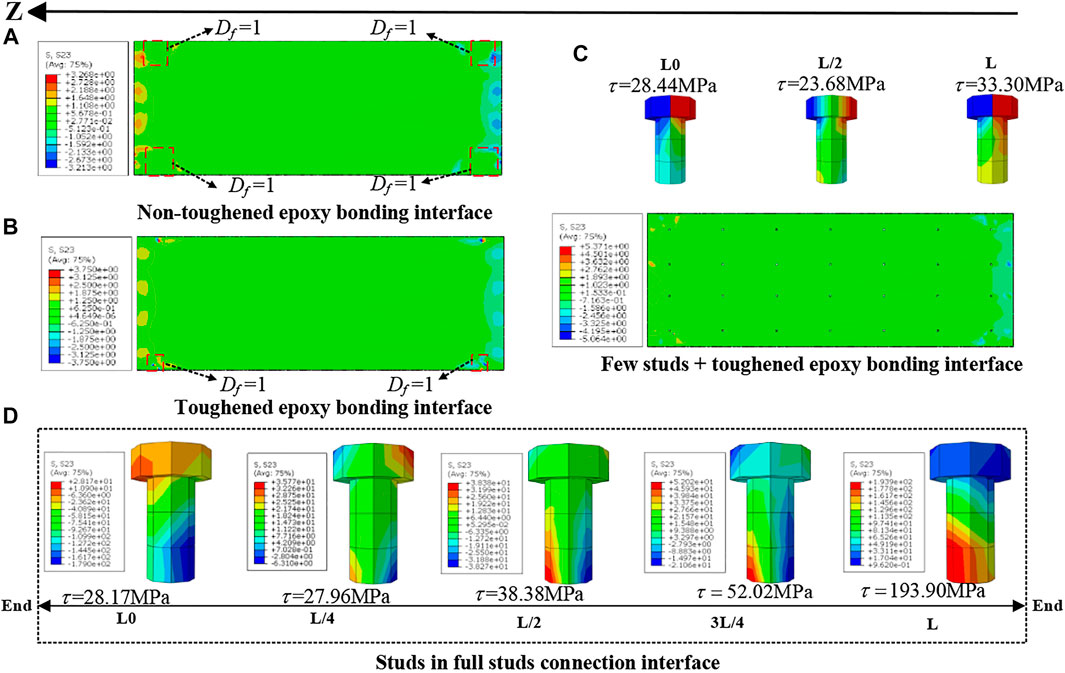
FIGURE 13. Interface stress distribution under UHPC shrinkage. (A) Non-toughened epoxy bonding interface. (B) Toughened epoxy bonding interface. (C) Few studs + toughened epoxy bonding interface. (D) Studs in the full stud connection interface.
It can be seen from Figure 13D that the shear stress of the stud at the fulcrum L in the full stud connection interface differs by 85.47% from that of the stud at the fulcrum L0. The main reason is that the shrinkage effect at the fulcrum L0 is suppressed due to the constraints of its boundary conditions. Meanwhile, Figure 13C shows that the shear stress of the stud is significantly reduced after combining the stud and the non-toughened epoxy bonding interface. Moreover, the shear stress of the stud at fulcrums L0 and L is only 14.60% different. Therefore, the toughened epoxy bonding interface can significantly reduce the shear stress of the stud and make the stress distribution of the interface more uniform. Moreover, the existence of studs can further improve the shear performance of the toughened epoxy bonding interface.
Five percent interface defects are arranged at the bonding interface of the bridge deck, and the interface stress distribution under the standard wheel load (70 kN) is obtained, as shown in Figure 14.
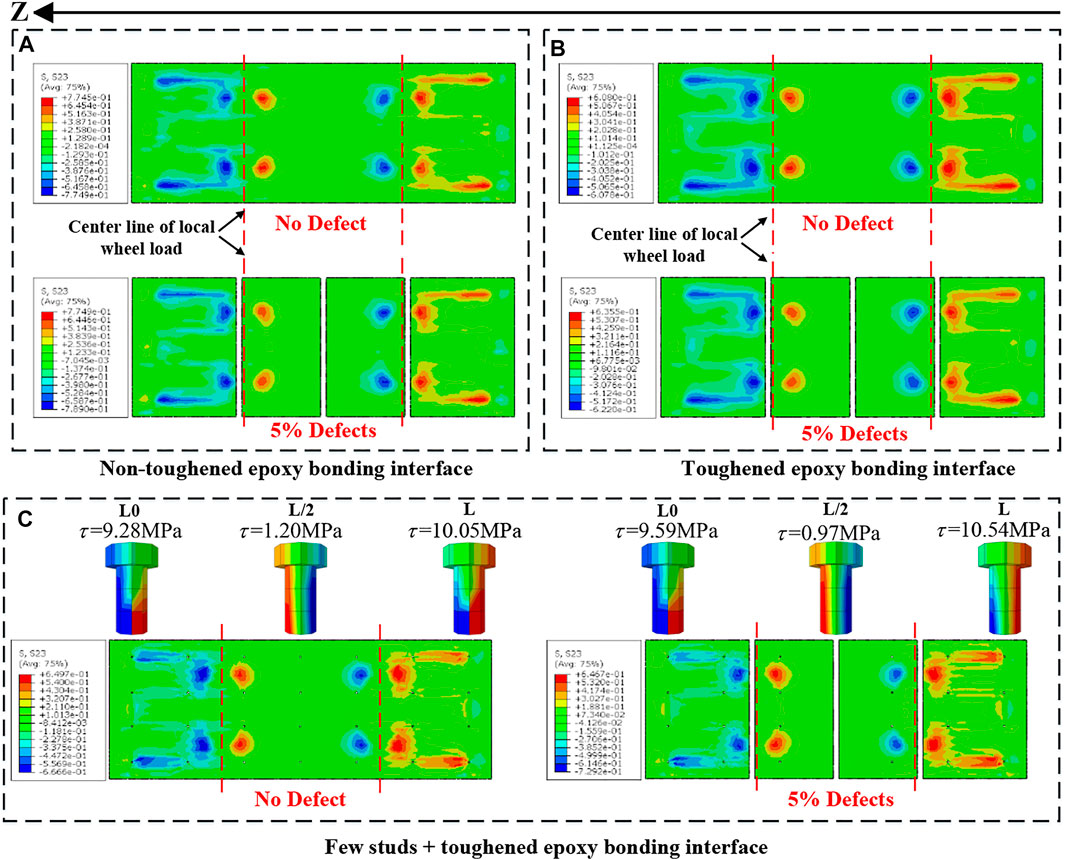
FIGURE 14. Stress distribution before and after interface defects under the standard wheel load. (A) Non-toughened epoxy bonding interface. (B) Toughened epoxy bonding interface. (C) Few studs + toughened epoxy bonding interface. (D) Full stud connection interface.
It can be seen from Figure 14 that before and after the epoxy bonding interface defect, the shear stress distribution of studs and interfaces in various interfaces basically does not change. As shown in Figure 14A,B, before the interface defect, the maximum shear stress in the positive and negative directions of the toughened epoxy bonding interface is 20.78% different from that of the non-toughened epoxy bonding interface. After the interface defect, the maximum shear stress in the positive and negative directions of the interface differs by 16.88 and 21.52%, respectively. This indicates that the toughened epoxy bonding interface can significantly reduce the interface shear stress after the defect. Figure 14C shows the shear stress distribution between the stud and the interface. It can be seen from the figures that after the interface defect, the maximum shear stress of the toughened epoxy bonding interface only increased by 8.96% in the positive direction, and the shear stress of each stud increased slightly. Therefore, it can be shown that under the standard wheel load, the few studs + toughened epoxy bonding interface can still work normally after 5% defects, and the toughened epoxy bonding interface is still in the elastic stage.
Figure 15 shows various interfaces’ damage and stress distribution under five times the standard wheel load (350 kN). In Figure 15A, after the non-toughened epoxy bonding interface defects, the interface failure range does not expand anymore. In addition, the interface failure in the wheel load area is no longer concentrated and slightly reduced. In Figure 15B, after the toughened epoxy bonding interface defects, the interface failure is mainly concentrated at the interface of both ends, and the failure area is greatly reduced. Comparing Figure 15A,B, it can be found that on one hand, interface defects do not significantly change the stress state of the interface; on the other hand, the toughened epoxy bonding interface still exhibits good toughening properties even after interface defects. Figure 15C shows that the shear stress of the toughened epoxy bonding interface in the few studs + toughened epoxy bonding interface is significantly reduced after the interface defects. The failure area is significantly more concentrated, and the shear stress of the stud is reduced. It may be due to the relief of stress concentration and interface toughness at the defect.
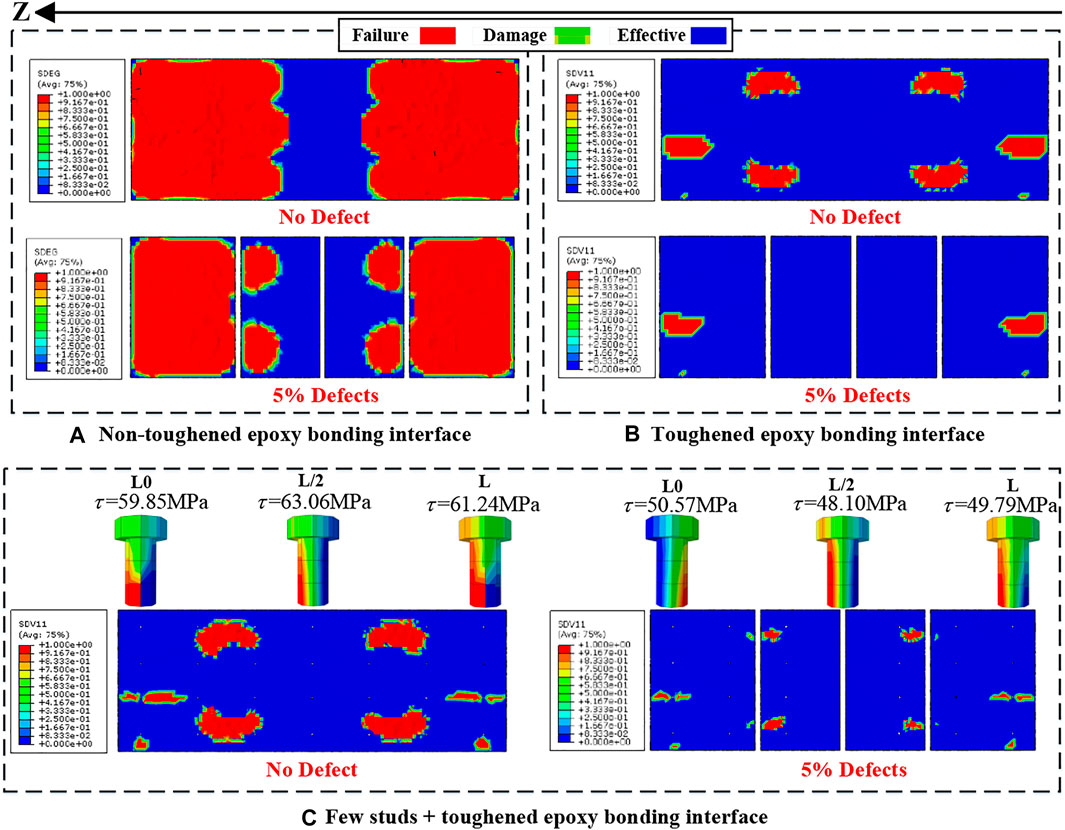
FIGURE 15. Stress distribution before and after interface defects under the overload wheel load. (A) Non-toughened epoxy bonding interface. (B) Toughened epoxy bonding interface. (C) Few studs + toughened epoxy bonding interface.
To explore whether the toughened epoxy bonding interface can reduce the amount of bridge deck studs or even cancel the studs, this paper designed four types of interfaces to study the interfacial behavior of the steel–UHPC composite deck. The load cases, including local wheel load, UHPC shrinkage, and interface defects, were considered in the numerical simulation. Moreover, the constitutive model of the toughened epoxy bonding interface is validated through the direct shear test and compression-shear test. The main conclusions are summarized as follows:
(1) The maximum interface shear stress of the toughened epoxy bonding interface is 0.61 MPa under the standard wheel load, which is 20.78% lower than that of the non-toughened epoxy bonding interface. The toughened epoxy bonding interface mainly manifests as interface failure in the wheel load region and a smaller range at the interface of both ends. Moreover, the undamaged area around enters the plastic stage first, which greatly delays the failure process of the toughened epoxy bonding interface. However, the non-toughened epoxy bonding interface will fail rapidly once they enter the failure stage.
(2) For a few studs + toughened epoxy bonding interface, due to the sufficient bonding between the UHPC layer and steel bridge deck, the maximum shear stress of the stud is 61.24 MPa under the overload (350 kN). The interface shear stress is more uniform than that in the full stud connection interface, which avoids the stress concentration in the root of studs, and the studs’ average stress is significantly reduced by 63.21%. Therefore, the toughened epoxy bonding interface can indeed improve the toughness of the steel–UHPC interface. It is verified that using the toughening epoxy bonding interface can reduce the amount of studs.
(3) Before the interface fails, the interface shearing effect is borne together with the bridge deck studs, the toughened epoxy bonding interface mainly bears the shear force, and the stud stress is relatively small. Even if the local interface failure begins, the shear resistance of the interface is still dominated by the toughened epoxy bonding interface, and the stud stress is significantly lower compared with the few studs + toughened epoxy bonding interface.
(4) When the interface defect is 5%, the interface stress under the standard load in both toughened epoxy bonding interfaces is only 0.635 and 0.646 MPa, respectively. At this time, large area failure occurs at the non-toughened epoxy bonding interface under the overload. However, the toughened epoxy bonding interface only has a few interface damages, exhibiting good defect tolerance (Chen et al., 2018;Kamen et al., 2008).
The original contributions presented in the study are included in the article/Supplementary Material, further inquiries can be directed to the corresponding author.
These authors have made great contributions in the field of the steel–concrete composite structure and high-performance concrete material.
The authors express their sincere gratitude for the financial support provided by the National Natural Science Foundation of China (Grant Nos. 52008066), the Natural Science Foundation of Chongqing, China (Grant Nos. cstc2020jcyj-msxmX0088), the Science and Technology Project of Chongqing Municipal Education Commission (Grant Nos. KJQN201900733), and the Science and Technology Project of Hubei Provincial Transportation Department (Grant Nos. 2020-2-1-1 and 2020-186-1-8).
The authors declare that the research was conducted in the absence of any commercial or financial relationships that could be construed as a potential conflict of interest.
All claims expressed in this article are solely those of the authors and do not necessarily represent those of their affiliated organizations or those of the publisher, the editors, and the reviewers. Any product that may be evaluated in this article or claim that may be made by its manufacturer is not guaranteed or endorsed by the publisher.
Berthet, J. F., Yurtdas, I., Delmas, Y., and Li, A. (2011). Evaluation of the Adhesion Resistance between Steel and concrete by Push Out Test. Int. J. Adhes. Adhesives 31 (2), 75–83. doi:10.1016/j.ijadhadh.2010.11.004
Bouazaoui, L., Perrenot, G., Delmas, Y., and Li, A. (2007). Experimental Study of Bonded Steel concrete Composite Structures. J. Constructional Steel Res. 63 (9), 1268–1278. doi:10.1016/j.jcsr.2006.11.002
Buitelaar, P., Rene, B., and Neik, K. (2004). “Reinforced High Performance concrete Overlay System for Steel Bridges,” in Proceedings of the 5th International CROW Workshop On Fundamental Modelling of the Design and Performance of Concrete Pavements, Turkey, August 2004 (Istanbul).
Chen, B., Li, C., Huang, W., An, M. Z., Han, S., and Ding, Q. J. (2018). Review of Ultra-high Performance concrete Shrinkage. J. Traffic Transportation Eng. 18 (01), 13–28. doi:10.19818/j.cnki.1671-1637.2018.01.002
Duan, L., Brühwiler, E., and Wang, C.-s. (2020). Cold Stiffening of Orthotropic Steel Decks by a Composite UHPFRC Layer. J. Constructional Steel Res. 172, 106209. doi:10.1016/j.jcsr.2020.106209
He, X. Y. (2020). Mechanical Properties of Orthotropic Steel Deck with Epoxy Adhesively Bonded Rigid Pavement. J. Harbin Inst. Tech. 52 (9), 25–31. doi:10.11918/201910033
Jiang, J., Zou, Y., Yang, J., Zhou, J., Zhang, Z., and Huang, Z. (2021). Study on Bending Performance of Epoxy Adhesive Prefabricated UHPC-Steel Composite Bridge Deck. Adv. civil Eng. 2021, 1–16. doi:10.1155/2021/6658451
Jong, D. (2004). “Overview Fatigue Phenomenon in Orthotropic Bridge Decks in the Netherlands,” in Proceedings of 2004 Orthotropic Bridge Conference, Sacramento, CA, USA, Aug 2004 (ASCE), 489.
Jurkiewiez, B., Meaud, C., and Michel, L. (2011). Non Linear Behaviour of Steel-concrete Epoxy Bonded Composite Beams. J. Constructional Steel Res. 67 (3), 389–397. doi:10.1016/j.jcsr.2010.10.002
Kamen, A., Denarié, E., Sadouki, H., and Brühwiler, E. (2008). Thermo-mechanical Response of UHPFRC at Early Age - Experimental Study and Numerical Simulation. Cement Concrete Res. 38 (6), 822–831. doi:10.1016/j.cemconres.2008.01.009
Li, Z. X., Chan, T. H. T., and Ko, J. M. (2021). Fatigue Damage Model for Bridge under Traffic Loading: Application Made to Tsing Ma Bridge. Theor. Appl. Fracture Mech. 35, 81–91. doi:10.1016/S0167-8442(00)00051-3
Lian, J., Hu, C., Fu, T., and Wang, Y. (2021). Review of Self-Sensing Capability of Ultra-high Performance Concrete. Front. Mater. 8, 746022. doi:10.3389/fmats.2021.746022
Luo, Y., Hoki, K., Hayashi, K., and Nakashima, M. (2016). Behavior and Strength of Headed Stud-SFRCC Shear Connection. I: Experimental Study. J. Struct. Eng. 142 (2), 4015112 1–4015112 10. doi:10.1061/(asce)st.1943-541x.0001363
Luo, Y., Li, A., and Kang, Z. (2012). Parametric Study of Bonded Steel-concrete Composite Beams by Using Finite Element Analysis. Eng. Structures 34, 40–51. doi:10.1016/j.engstruct.2011.08.036
Ministry of Housing and Urban-Rural Development of the People’s Republic of China (2015). Code for Design of Concrete Structures (GB 50010-2010). Beijing, China: China Planning Press. [in Chinese].
Ministry of Transport of the People's Republic of China (2015). General Specifications for Design of Highway Bridges and Culverts: JTG D60-2015. Beijing: People's Communication Press. [in Chinese].
Momayez, A., Ehsani, M. R., Ramezanianpour, A. A., and Rajaie, H. (2005). Comparison of Methods for Evaluating Bond Strength between concrete Substrate and Repair Materials. Cement Concrete Res. 35 (4), 748–757. doi:10.1016/j.cemconres.2004.05.027
Murakoshi, J., Yanadori, N., and Ishii, H. (2008). “Research on Steel Fiber Reinforced concrete Pavement on Orthotropic Steel Deck,” in Proceedings of the 2nd International Orthotropic Bridge Conference, Sacramento.
Qin, F., Zhang, Z., Yin, Z., Di, J., Xu, L., and Xu, X. (2020). Use of High Strength, High Ductility Engineered Cementitious Composites (ECC) to Enhance the Flexural Performance of Reinforced concrete Beams. J. Building Eng. 32, 101746. doi:10.1016/j.jobe.2020.101746
Shao, X., Yi, D., Huang, Z., Zhao, H., Chen, B., and Liu, M. (2013). Basic Performance of the Composite Deck System Composed of Orthotropic Steel Deck and Ultrathin RPC Layer. J. Bridge Eng. 18 (5), 417–428. doi:10.1061/(ASCE)BE.1943-5592.0000348
Shao, X., Qu, W., Cao, J., and Yao, Y. (2018). Static and Fatigue Properties of the Steel-UHPC Lightweight Composite Bridge Deck with Large U Ribs. J. Constructional Steel Res. 148, 491–507. doi:10.1016/j.jcsr.2018.05.011
Shao, X-D., Gan, Q-D., Li, J., and Qiu, M-H. (2018). Interfacial Shear Resistance of Welded Structure of Composite Deck System Composed of Orthotropic Deck and Ultrathin UHPC Layer. China J. Highw. Transport 31 (11), 91–101. doi:10.3969/j.issn.1001-7372.2018.11.010
Si Larbi, A., Ferrier, E., and Hamelin, P. (2009). Concrete to Steel Lap Joint Failure Criteria under Combined Shear and Peeling Stress. J. Constructional Steel Res. 65 (2), 386–394. doi:10.1016/j.jcsr.2008.03.012
Sun, Q., Lu, X., Nie, X., Han, Z., and Fan, J. (2017). Experimental Research on Tensile and Shear Behaviour of the Interface between Non-steam-cured Uhpc and Steel Plate Structure. Mech. Eng. 34 (9), 167–174. [in Chinese]. doi:10.6052/j.issn.1000-4750.2016.05.0361
Tassios, T. P. (1979). Properties of Bond between concrete and Steel under Load Cycles Idealizing Seismic Actions. Rome: Proceeding AICAP-CEB Symp. CEB Bull. d’Information. 131, 67–122. doi:10.1680/rceucl.35485.0005
Wu, S. (2019). Study on Interfacial Characteristics of Steel Deck Pavement with Engineered Cementitious Composites. Doctor: southeast university, 148.
Wang, Z., Wang, Y., and Zheng, Y. (2019). Analysis of Fatigue Crack Propagation of an Orthotropic Bridge Deck Based on the Extended Finite Element Method. Adv. Civil Eng. 2019, 1–14. doi:10.1155/2019/6319821
Wang, Z., Nie, X., Fan, J.-S., Lu, X.-Y., and Ding, R. (2019). Experimental and Numerical Investigation of the Interfacial Properties of Non-steam-cured UHPC-Steel Composite Beams. Construction Building Mater. 195 (20), 323–339. doi:10.1016/j.conbuildmat.2018.11.057
Wang, L. G., Shao, X-D., Cao, J. H., Chen, Y. B., He, G., and Wang, Y. (2020). Performance of Steel-Ultrathin UHPC Composite Bridge Deck Based on Ultra-short Headed Studs. J. Zhejiang Univ. (Engineering Science) 54 (10), 2027–2037. doi:10.3785/j.issn.1008-973X.2020.10.021
Xu, J.-H., Zhou, G.-D., and Zhu, T.-Y. (2021). Fatigue Reliability Assessment for Orthotropic Steel Bridge Decks Considering Load Sequence Effects. Front. Mater. 8, 678855. doi:10.3389/fmats.2021.678855
Xu, Y., Lv, X., Ma, C., Liang, F., Qi, J., Chou, Z., et al. (2021). Shear Fatigue Performance of Epoxy Resin Waterproof Adhesive Layer on Steel Bridge Deck Pavement. Front. Mater. 7, 618073. doi:10.3389/fmats.2020.618073
Yang, J. (2007). Flexural Behavior of Ultra-high Performance Concrete Beams Prestressed with CFRP Tendons. Changsha, China: Hunan University.
Zhang, Z., Shao, X., Li, W., Zhu, P., and Chen, H. (2015). Axial Tensile Behavior Test of Ultra High Performance concrete China. J. Traffic Transportation Eng. 28 (8), 50–58. doi:10.19721/j.cnki.1001-7372.2015.08.007
Zhang, X., Li, X., Liu, R., Hao, C., and Cao, Z. (2020). Dynamic Properties of a Steel-UHPC Composite Deck with Large U-Ribs: Experimental Measurement and Numerical Analysis. Eng. Structures 213, 1–14. doi:10.1016/j.engstruct.2020.110569
Zhang, Z., Liu, S., Yang, F., Weng, Y., and Qian, S. (2021). Sustainable High Strength, High Ductility Engineered Cementitious Composites (ECC) with Substitution of Cement by rice Husk Ash. J. Clean. Prod. 317, 128379. doi:10.1016/j.jclepro.2021.128379
Zhang, Z., Liu, D., Ding, Y., and Wang, S. (2022). Mechanical Performance of Strain-Hardening Cementitious Composites (SHCC) with Bacterial Addition. J. Infrastruct Preserv Resil 3 (3). doi:10.1186/s43065-022-00048-3
Zou, Y., Zhou, X. H., Di, J., and Qin, F. J. (2018). Partial Interaction Shear Flow Forces in Simply Supported Composite Steel-concrete Beams. Adv. Steel Construction 14 (4), 634–650. doi:10.18057/IJASC.2018.14.7
Zou, Y., Di, J., Zhou, J., Zhang, Z., Li, X., Zhang, H., et al. (2020). Shear Behavior of Perfobond Connectors in the Steel-concrete Joints of Hybrid Bridges. J. Constructional Steel Res. 172, 106217. doi:10.1016/j.jcsr.2020.106217
Zou, Y., Qin, F., Zhou, J., Zheng, Z., Huang, Z., and Zhang, Z. (2021). Shear Behavior of a Novel Bearing-Shear Connector for Prefabricated concrete Decks. Construction Building Mater. 268, 121090. doi:10.1016/j.conbuildmat.2020.121090
Keywords: epoxy, bonding, interfacial behavior, toughness, ultra-high- performance concrete
Citation: Jiang J, Leng J, Zhang J and Guo J (2022) Interfacial Behavior of the Steel–UHPC Composite Deck With Toughened Epoxy Bonding. Front. Mater. 9:859214. doi: 10.3389/fmats.2022.859214
Received: 21 January 2022; Accepted: 14 March 2022;
Published: 03 May 2022.
Edited by:
Zhigang Zhang, Chongqing University, ChinaCopyright © 2022 Jiang, Leng, Zhang and Guo. This is an open-access article distributed under the terms of the Creative Commons Attribution License (CC BY). The use, distribution or reproduction in other forums is permitted, provided the original author(s) and the copyright owner(s) are credited and that the original publication in this journal is cited, in accordance with accepted academic practice. No use, distribution or reproduction is permitted which does not comply with these terms.
*Correspondence: Jiangtao Zhang, emhhbmdqaWFuZ3Rhb0BjcWp0dS5lZHUuY24=
Disclaimer: All claims expressed in this article are solely those of the authors and do not necessarily represent those of their affiliated organizations, or those of the publisher, the editors and the reviewers. Any product that may be evaluated in this article or claim that may be made by its manufacturer is not guaranteed or endorsed by the publisher.
Research integrity at Frontiers
Learn more about the work of our research integrity team to safeguard the quality of each article we publish.