
94% of researchers rate our articles as excellent or good
Learn more about the work of our research integrity team to safeguard the quality of each article we publish.
Find out more
ORIGINAL RESEARCH article
Front. Mater., 08 March 2022
Sec. Environmental Degradation of Materials
Volume 9 - 2022 | https://doi.org/10.3389/fmats.2022.857671
This article is part of the Research TopicCorrosion and Protection of Magnesium AlloysView all 11 articles
 Alejandra Silvina Román1†Edgar Rolando Ibañez1†Claudia Marcela Méndez1Marianela Pedrozo1Gustavo Raúl Kramer1Natalia Silvina Zadorozne1Paula Regina Alonso2
 Alicia Esther Ares1*
The objective of the present research is to study the corrosion susceptibility of two Al-Mg diluted alloys (Al-0.5wt.%Mg and Al-2wt.%Mg) with different grains structures obtained by directional solidification (columnar, equiaxed and columnar-to-equiaxed transition, CET) in 0.5% NaCl solution, at room temperature. The corrosion resistance is analyzed by potentiodynamic polarization and electrochemical impedance spectroscopy (EIS) techniques in both longitudinal and transversal sections of the samples. The columnar grain zone presents higher corrosion resistance than the equiaxed grain zone. In addition, the transversal section shows higher corrosion resistance than the longitudinal section of the samples. Then, the Al-0.5wt.% Mg alloy displays higher corrosion resistance than the Al-2wt.% Mg alloy. The values of the polarization resistance are used as a basic criterion for the evaluation of the corrosion resistance of both alloys. In this way, when the polarization resistance decreases with the increasing in the distance from the base, the grain size, secondary dendritic arm spacings and hardness increases. In addition, when the polarization resistance increases, the critical temperature gradient decreases.
Aluminum and its alloys stand out for two main properties: low density and excellent mechanical strength. These characteristics have led to its use in applications where weight is a determining factor, as it is the case in the transportation, automotive and naval industries (Davis, 1993; Canales et al., 2012; Jayalakshmi et al., 2013). The use of aluminum in these industries dates back to 1899, when Karl Benz presented the first sports car with an aluminum chassis. At the same time, Zeppelin was working on the construction of the first rigid airship using the same material in the frame of the structure. However, the mechanical properties of pure aluminum did not meet the demands required in structural applications, and for that reason, its industrialization did not take place until 1930 with the design of aluminum-based alloys. The incorporation of alloying elements enables a considerable increase in mechanical properties, which in turn, widens its range of applicability (Shu-qing and Xing-fu, 2014; Kaygisiz and Marasli, 2015).
Magnesium is the lightest structural metal. In the automotive industry, it reduces the total weight of the car by 10 percent and saves between 20 and 30 percent on fuel. Other advantages include not only excellent stiffness, specific strength, high electrical and thermal conductivity, but also great protection against electromagnetic interference. It is characterized by an excellent tolerance in the final dimensions of the parts as well as good endings; it also allows parts of small thickness (up to Ø wall = 2 mm), is fully recyclable and is easy to machine; besides, its costs are lower in relation to polymers (Jayalakshmi et al., 2013; Shu-qing and Xing-fu, 2014).
However, application of aluminum casting alloys for structural components requires high strength and suitable high elongations (Totten et al., 2004). In addition, the use of indentation at several scale levels was proposed in order to estimate strengthening kinetics of heat-resistant steel 15Kh2MFA (II) after high-temperature deformation (Maruschak et al., 2012). Recently, the effect of electron beam energy densities on the surface morphology and tensile property of additively manufactured Al-Mg alloy was analyze and it was determined that the crystallization and tensile strength of Al-Mg alloy are optimum at the condition EBED = 10 J/cm2 (Geng et al., 2021a). In another research, the authors demonstrate the tensile properties and fracture mechanism with the analysis of microstructure and phase composition of Al-5.0 Mg alloys. The results achieved from experiments can enrich the information of studies about Al-5.0 Mg alloys produced by WAAM-CMT (Geng et al., 2021b).
Grain size, their morphology, interdendritic distance and distribution of secondary phases are crucial factors affecting mechanical properties of cast parts (Canales et al., 2012; Luna et al., 2013; Shokuhfar and Nejadseyfi, 2014; Krupin´ski et al., 2016). The quality of the microstructure of aluminum alloys mainly depends on the chemical composition, melting process, cooling rates and temperature gradients (Xia et al., 2014; Kro´l et al., 2015; Krupin´ski et al., 2016). Due to those facts, it is important to understand how to control structure forming of aluminum alloys through casting.
Generally, a columnar structure has large grain boundaries, which are sensitive locations for crack initiation. However, it can be used to produce the strong texture and the anisotropic properties for special applications (Liu and To, 2017). In contrast, homogeneous equiaxed grains are commonly desirable for the sake of enhancing resistance to crack propagation (Liu et al., 2018; Zhang et al., 2019; Liu et al., 2020). In addition, columnar-to-equiaxed transition (CET) behavior is determined by the temperature gradient and the solidification rate during the directional solidification process (Ares and Schvezov, 2000; Spittle, 2006; Ares and Schvezov, 2007; Ares et al., 2010; Gueijman et al., 2010; Ares and Schvezov, 2011; Song et al., 2018; Xiang et al., 2019; Zhang et al., 2019; Oliveira et al., 2020). Either an equiaxed or a columnar microstructure can be achieved by selecting appropriate processing parameters, which further determine the mechanical properties of the alloy.
Several researches about the corrosion behavior and the characteristics of films formed (Song et al., 2019; Xu et al., 2021; Chen et al., 2021). Other previous studies evaluated corrosion susceptibility of Al alloys (Smialowska, 1999; Amin et al., 2008; Boag et al., 2010; Osório et al., 2013; Zhou et al., 2015; Yasakau et al., 2018). The influence of the concentration of aggressive ions in the electrolyte on the pitting potential of Al alloys has always been a matter of great interest; therefore, it was extensively studied (Smialowska, 1999; Hui Zhao et al., 2006; Amin et al., 2008; Arrabal et al., 2013; Wang et al., 2014; Yasakau et al., 2018). However, there are previous investigations evaluating the susceptibility to corrosion of directionally solidified aluminum alloys (Ares et al., 2008; Ares and Gassa, 2012; Osório et al., 2013; Ares et al., 2018; Satizabal et al., 2019). It is evident that the results are governed by a complex set of interacting phenomena, and even more when we consider the thermal parameters for obtaining the alloys with the mechanical and electrochemical parameters.
Electrochemical techniques are fast and can be used to obtain instantaneous information on a corrosion process, which cannot be provided by weight loss measurements. Also, impedance techniques, along with the linear polarization technique, are the most commonly used methods for determining corrosion rates. The electrochemical impedance spectroscopy (EIS) technique is a particularly useful method to study electrode kinetics at the corrosion potential. The nature of the corrosion process can be often revealed by an impedance spectrum (Barsoukov and Ross McDonald, 2005).
In previous works, we correlated the effect of several parameters, like thermal, mechanical and electrochemical ones, on the CET macrostructure of different alloys systems (Ares et al., 2008; Ares et al., 2011; Román et al., 2014; Román et al., 2015; Kociubczyk et al., 2015; Ares and Schvezov, 2015; Ares et al., 2016; Rozicki et al., 2018; Kociubzyk et al., 2018; Ares et al., 2018; Ares et al., 2018; Kramer et al., 2016; Méndez et al., 2018; Román et al., 2021). Earlier, we had analyzed the thermal and structural parameters of Al-Mg alloys during the columnar-to equiaxed transition (Al-2wt.%Mg and Al-4wt.%Mg) (Ares et al., 2003a; Ares et al., 2003b; Ares et al., 2004) and the corrosion of Al-Mg alloys exposed to ethanol solutions and bioethanol fuel (Kramer et al., 2017; Gauto et al., 2018; Kramer et al., 2018).
In this investigation, we examined the susceptibility to corrosion of directionally solidified aluminum-magnesium diluted alloys (Al-0.5wt.%Mg and Al-2wt.%Mg) with different grain structures (columnar (C), equiaxed (E) and columnar-to-equiaxed transition, CET), obtained by a directional solidification process, in 0.5 M NaCl solution, at room temperature, using potentiodynamic polarization and electrochemical impedance spectroscopy (EIS) as principal electrochemical techniques.
The Al-0.5wt.%Mg and Al-2wt.%Mg alloys were prepared by using commercially pure metals (Chemical composition of Al: 99.93 Al, 0.038 Fe, < 0.001 Pb, 0.033 Si and <0.001 others. Chemical composition of Mg: 99.97 Mg, 0.015 Fe, 0.012 Pb, 0.003 Si and <0.001 others). Then, they were solidified by using a directional solidification device, which consists of a heating unit, and a control system with data acquisition. Data acquisition was carried out by means of six thermocouples connected to a data acquirer, which were placed in the holes of the molds of the specimens with a depth of 0.7 cm and a distance between each one of 2 cm, coinciding with the center of the diameter of the specimen. Thus, allowing the determination of the time-dependent temperature profiles (Ares and Schvezov, 2000; Spittle, 2006; Ares and Schvezov, 2007; Ares et al., 2010; Gueijman et al., 2010; Ares and Schvezov, 2011). Figure 1A shows the experimental setup with a vertical heat extraction system at the bottom of the furnace.
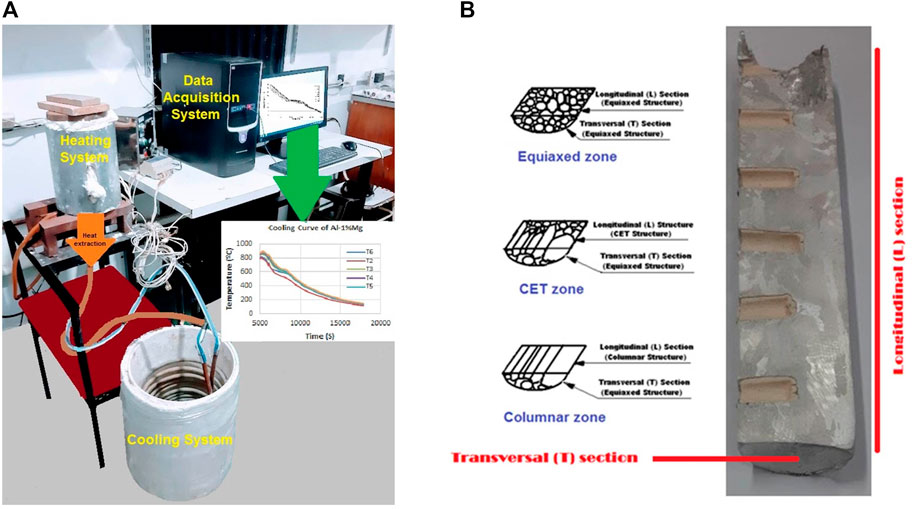
FIGURE 1. (A) Experimental setup used in directional solidification experiments. (B) The longitudinal (L) and transversal (T) sections of the cylindrical sample.
Prior to solidification, the crucibles and cylindrical molds were prepared with commercial clay. An adapted manual extruder was used to obtain the molds, with an approximate length of 13 cm and an internal diameter of 2.5 cm. Its firings were carried out in a muffle at 300°C for 1 h, then at 600°C for another 1 h and finally at 900°C for 1 h again.
The pure elements were also melted in the muffle, in the crucibles, each one at its respective melting temperature, using 159.44 g of aluminum and 1.61 g of magnesium for the first Al-2wt.%Mg cylindrical sample, and 160.66 g of aluminum and 0.85 g of magnesium for the second Al-0.5wt.%Mg sample, occupying a volume of 40 cm3, respectively. Once melted, they were mixed using a graphite rod, and then, placed in the solidification furnace to obtain the alloy samples. Five alloy samples of each concentration were tested, as it can be seen in Table 1.
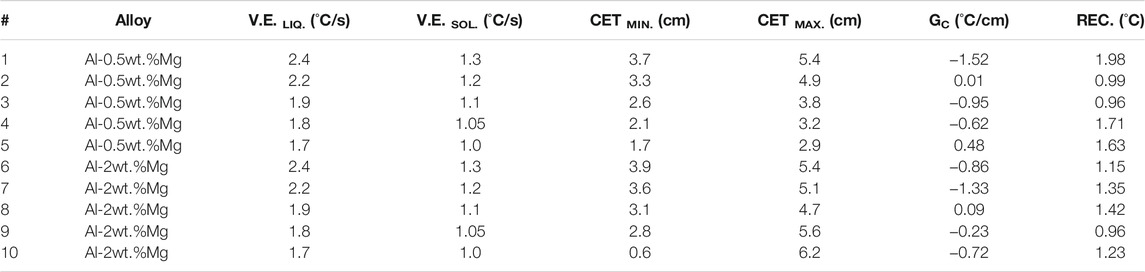
TABLE 1. Cooling velocity in the liquid (V.E.LIQ.) and cooling velocity in the solid (V.E.SOL.), minimum CET position (CET MIN.) and maximum CET position (CET MAX.), critical gradients (GC) and recalescence values (REC.) obtained from the temperature versus time curves.
When the specimens were cooled, they were cut in longitudinal direction, devastated with SiC paper up to granulometry #1500, and chemically attacked with Keller reagent (distilled water, 32% hydrochloric acid, 65% nitric acid, 40% hydrofluoric acid) for approximately 3 min at room temperature to reveal the macro and microstructures (Vander Voort, 2004). This made it possible to locate the three defined zones of grain structures by visual observation and optical microscopy, as it can be seen in Figure 2.
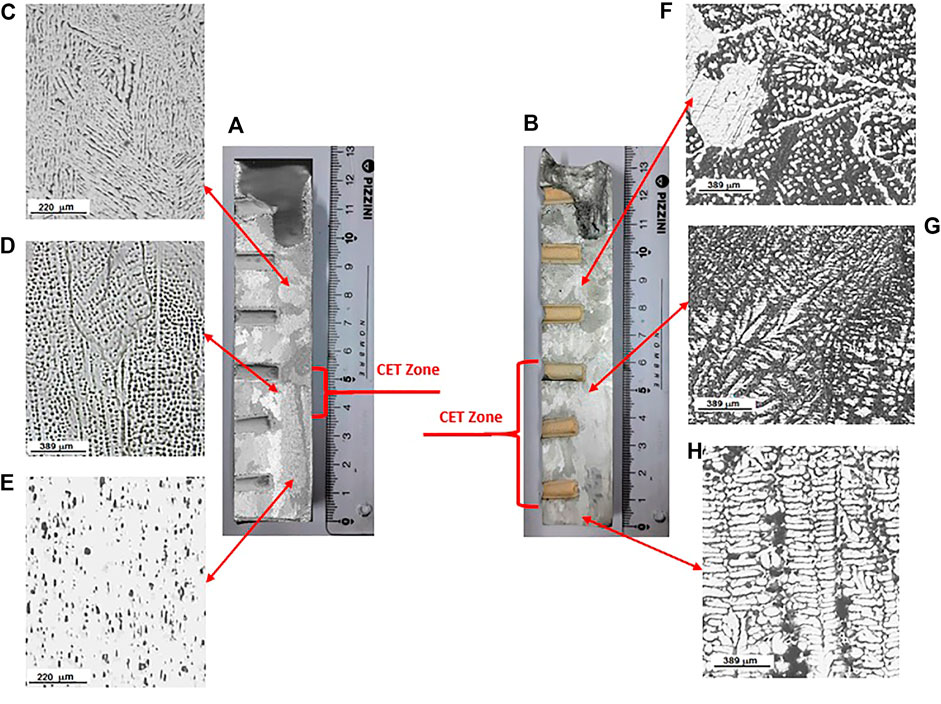
FIGURE 2. Macrostructures: (A) Al-0.5wt.%Mg. (B) Al-2wt.%Mg. Microstructures: (C–E) Al 0.5wt.%Mg. (F–H) to (h) Al-2wt.%Mg.
The position of the CET was located by visual observation and an optical microscopy, and the distance from the chill zone of the sample was measured with a ruler. Also, the grain structure was inspected by visual observation with an Arcano® optical microscopy. The dimensions of the grain sizes obtained from the macrostructures were determined on the basis of ASTM E-112 (Boyer and Gall, 1990) standards with the help of TSView® free image processing software. The equiaxed grain size was measured at equally spaced intervals. The columnar region was divided in a similar way and the width and length of the grains were directly measured.
Electrochemical tests were performed on Al-Mg alloys with two compositions: Al-0.5wt.% Mg and Al-2wt.% Mg. Working electrodes were obtained from the longitudinal (L) and transversal (T) sections of the three grain structures zones of the specimens tested: columnar, CET and equiaxed, as can be seen in Figure 1B.
The electrochemical tests were carried out in a three-electrode Pyrex glass cell, using a saturated calomel reference electrode and a platinum wire as a counter electrode. A 0.5 M NaCl solution at room temperature was used as electrolyte. Prior to the tests, nitrogen was bubbled into the solution for at least 10 min to remove dissolved oxygen.
Potentiodynamic polarization curves were performed at a rate of 0.16 mV/s. They started at 300 mV below the corrosion potential. The curves ended when a current value of 1 mA/cm2 was reached. Electrochemical Impedance Spectroscopy tests were performed after a 10 min stabilization period, with a potential amplitude of 10 mVrms, around the open circuit potential. The frequency range of the test was from 105 Hz to 5.10−2 Hz. The linear least squares method was used to analyze the results.
Before and after the corrosion tests, the samples were analyzed with a FEI Quanta200 SEM together with an EDS detector of the Electron Microscopy and Microanalysis Service (SeMFi-LIMF) (Microscopía Electrónica y Microanálisis (SeMFi-LIMF)—Facultad de Ingeniería, UNLP, Argentina). Secondary dendritic spacings were determined by using an Arcano® metallurgical microscope, employing the linear intercept method with a TSView® free image processing software.
The microhardness measurements of these alloys were done at room temperature, using a Future Tech® microhardness tester (Instituto de Materiales de Misiones (IMAM), Posadas, Misiones, Argentina). The measurements were performed under ASTM E 384-89 standard, using a pressing time of 10 s with a load of 50 gf.
The harness measurements of the same alloys were carried out using a BRIN200C Brinell calibration hardness machine (Comisión Nacional de Energía Atómica (CNEA), Buenos Aires, Argentina) to ISO 6506-3:1999 using a load rating (P/D2) = 5, an application time of 60 s and a sphere diameter of 2.5 mm.
A number of 10 successful experiments were performed where the transition from columnar-to-equiaxed grain structure was produced. It is noted in Figure 2 that the CET is not sharp, showing a zone where some equiaxed grains co-exist with columnar grains. The size of the transition zone is in the order of up to 1 cm. The CET occurred between 0.6 and 6.2 cm from the bottom of the sample. Typical columnar—to—equiaxed transitions can be observed in Figure 2 for the two alloys tested, Al-0.5wt.%Mg and Al-2wt.%Mg.
Also, Figure 2 shows the microstructure for hypoeutectic composition, in which the presence of two phases is observed: α-Al phase in the case of Al-0.5wt.%Mg (Figures 2C–E) and α-Al plus eutectic phase (α-Al + Mg) for Al-2wt.%Mg (Figures 2F–H). Both phases are well distributed throughout the system. The α-Al, is the light gray (free Mg) zone phase while the eutectic phase is observed as fine needles of Mg (black color) dispersed in a matrix of α-Al.
Figures 3A,C indicate the position of each thermocouple in the sample during the experiment. The liquidus, TL, and solidus, TS, temperatures were taken from the heating and cooling curves as usual (Ares and Schvezov, 2000; Ares and Schvezov, 2011; Ares and Schvezov, 2007; Ares et al., 2010; Gueijman et al., 2010). The results, which are shown in Figures 3B,D, are within the predicted values given by the phase diagram for the two alloys tested [52]: TLiquidus (Al-0.5wt.%Mg) = 658°C, TSolidus (Al-0.5wt.%Mg) = 645°C, TLiquidus (Al-2wt.%Mg) = 655°C, TSolidus (Al-2wt.%Mg) = 623°C.
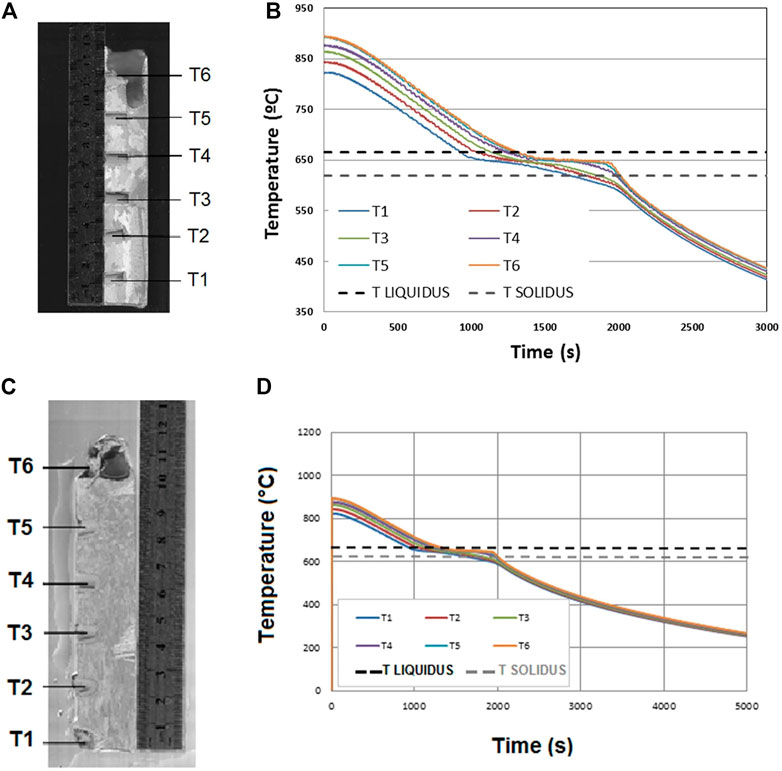
FIGURE 3. (A) Macrostructure of Al-0.5wt.%Mg alloy indicating the position of the thermocouples during the experiment. (B) Cooling curves of Al-0.5wt.%Mg alloy in each position of the thermocouples. (C) Macrostructure of Al-2wt.%Mg alloy indicating the position of the thermocouples during the experiment. (D) Cooling curves of Al-2. wt.%Mg alloy in each position of the thermocouples.
The cooling velocity of the liquid alloy was determined from the temperature versus the time curves at each thermocouple position and by taking the average slope. The temperature versus the time curves for Al-0.5wt%Mg and Al-2wt.%Mg alloys are presented in Figures 3B,D. The cooling velocity in the liquid was calculated from these types of curves and are listed in Table 1 for all the experiments as V.E.LIQ.; velocities of 1.7–2.4°C/s were obtained. The values of cooling velocity in the solid, V.E.SOL., were ranging between 1 and 1.3°C/s. Table 1 also lists the location of the CET zone from the bottom of the sample, which is in the range of CETMIN. to CETMAX. The values of the CETMIN(Al-0.5wt.%Mg) were between 1.7 and 3.7 cm. The values of the CETMAX(Al-0.5wt.%Mg) were between 2.9 and 5.4 cm. Likewise, the values for the CETMIN(Al-2wt.%Mg) were between 0.6 and 3.9 cm and the CETMAX(Al-0.5wt.%Mg) were between 4.7 and 6.2 cm. Comparing the cooling velocities with the distances, which correspond to the length of the columnar zone for all alloys, it is observed that increasing the velocity, increases the length of the columnar grains.
The temperature versus time curves also show that the temperature evolution depends on the structure being formed. During columnar solidification, the temperature decreases steadily and monotonically; on the contrary, in the equiaxed region, and during the transition, there is a recalescence which increases the temperature from a minimum.; the level of recalescence for each experiment is listed in Table 1 as REC (°C).
The temperature gradients, G, were calculated for each pair of neighbour thermocouples as the temperature difference between the thermocouple readings divided by the separation distance between thermocouples. As it is shown in Table 1, the gradients determined at the moment of the CET (which is called the critical temperature gradient, Gc) are negative in most experiments. This negative value is an indication of a reversal in the temperature profiles ahead of the interface, which could be associated to the recalescence due to massive nucleation of equiaxed grains, and previously reported and discussed by the authors for others alloy systems (Ares and Schvezov, 2000; Ares and Schvezov, 2007; Ares et al., 2010; Gueijman et al., 2010; Ares and Schvezov, 2011; Kociubczyk et al., 2015; Ares and Schvezov, 2015; Ares et al., 2016; Kociubzyk et al., 2018; Rozicki et al., 2018). The fact that in some cases the position of the thermocouples is not located at the precise position where the transition occurs, it may prevent the detection of the negative gradients which is believed to occur in all the cases.
The grain size along the samples is affected by the degree of heat extraction, which is higher at the base than at the top of the samples, as it can be seen in Figures 4A,B for both alloys.
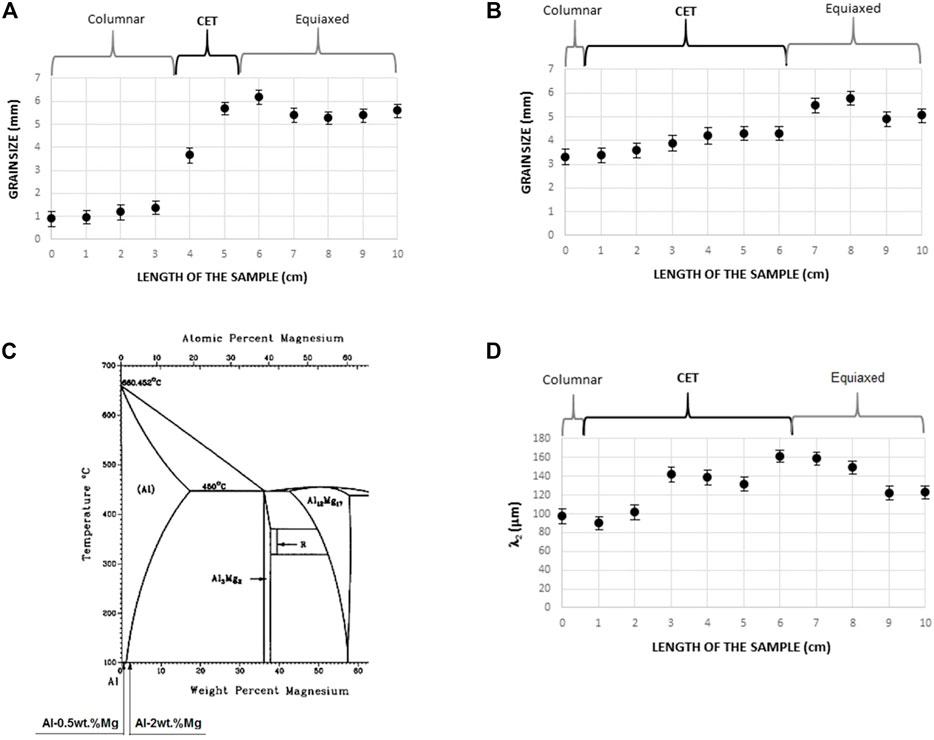
FIGURE 4. Grain size as a function of the length of the sample. (A) Al-0.5wt.%Mg. (B) Al-2wt.%Mg. (C) Al-Mg phase diagram (on the Al side) showing the positions of the Al-0.5wt.%Mg and Al-2wt.%Mg alloys (adapted from Boyer and Gall, 1990). (D) Secondary dendritic arm spacing, λ2, as a function of the length of the sample for Al-2wt.%Mg alloy.
The secondary dendritic arm spacing, λ2, was only possible to measure in Al-2wt.%Mg alloy (Figure 4C adapted from Boyer and Gall, 1990) due to the Al-0.5wt.%Mg, is a solid solution of α-Al.
The behavior of the secondary dendritic arm spacing, λ2, in Al-2wt.%Mg alloys, is also linked to the degree of heat extraction. The values of λ2 are smaller at the base of the samples, as it can be seen in Figure 4D. Otherwise, the dendritic structure is finer at the base of the samples (columnar zone).
First, we analyze microhardness (HV) variations as a function of sample length for both alloys, using load of 50 gf. Figure 5A show the experimental results. It can be seen that Vickers microhardness have greater values in the equiaxed zone than in the columnar and the columnar to equiaxed transition (CET) zones.
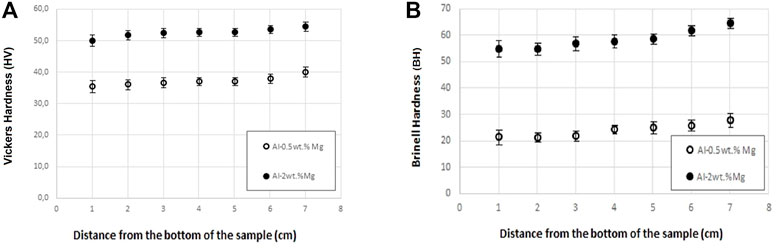
FIGURE 5. (A) Vickers microhardness (HV) and (B) Brinell hardness values versus length of the samples. Al-0.5wt%Mg and Al-2wt.%Mg alloys.
The same behavior is observed with the variation of Brinell hardness (HB) versus sample length (Figure 5B).
Comparing the Vickers microhardness and Brinell hardness values with the literature, we observe that the measured values are within the established for Al-Mg alloys (Totten et al., 2004).
Figures 6A,B shows the curves obtained for the Al-0.5wt.%Mg alloy. Figure 6A corresponds to the longitudinal section and Figure 6B to the transversal section of the samples. For both sections, it is observed that the columnar grain zone presents the noblest corrosion potential value, Ecorr. For the longitudinal section, after reaching Ecorr, a region where the current increases gradually, until reaching the pitting potential, Ep, is observed. The current values reached in this anodic region move towards higher values from the columnar zone to the equiaxed zone of grains. The Ep is equal to −750 mV coincident for the three-grain zones.
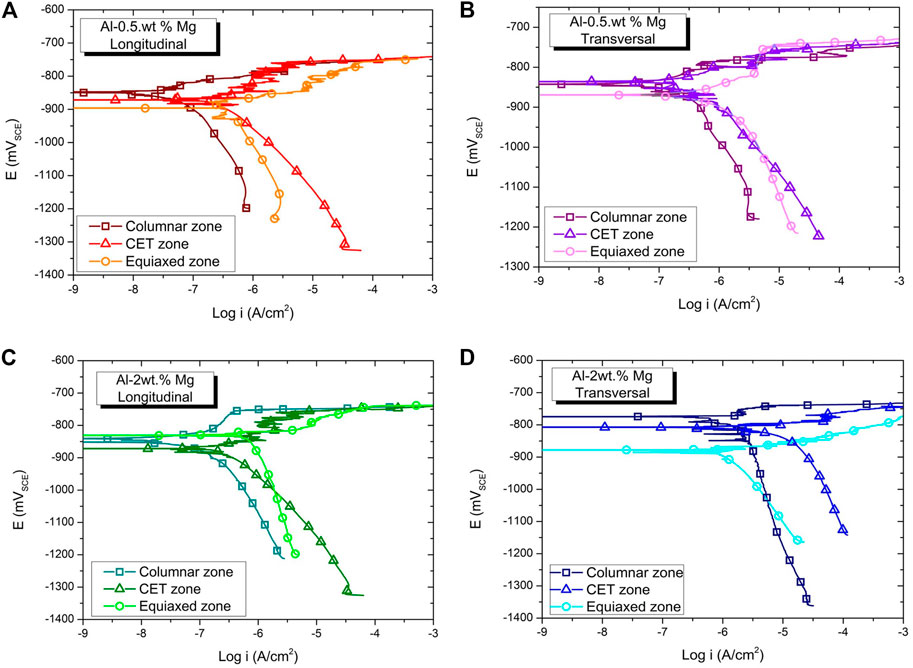
FIGURE 6. Potentiodynamic curves of Al-Mg alloys. (A) Al-0.5wt.% Mg (Longitudinal section). (B) Al-0.5wt.% Mg (Transversal section). (C) Al-2wt.% Mg (Longitudinal section). (D) Al-2wt.% Mg (Transversal section).
The curves obtained for the cross section show a behavior similar to that described above. However, the Ep of the equiaxed grain zone is equal to −734 mV, slightly nobler than that reached by the other samples described.
Figures 6C,D shows the potentiodynamic curves obtained for the alloy Al-2wt.%Mg. As observed in Figure 6A, the longitudinal section also presents a region of gradual increase of the current after Ecorr is reached. This region is well defined for the columnar grain zone and can be considered a region of passivity. The noblest Ecorr corresponds to the CET zone. The difference in Ecorr between the columnar and equiaxed grain zones is not considered significant. Again, the three zones show an Ep around −750 mV.
Figure 6B presents the curves obtained for the transversal section of the Al-2wt.%Mg alloy. The columnar grain zone shows, again, the noblest Ecorr. However, after reaching this potential, a rapid increase in current is observed, associated with the direct dissolution of the material. The corrosion potentials, Ecorr, as well as the corrosion current density, Icorr, of the Al-Mg alloys are listed in Table 2.
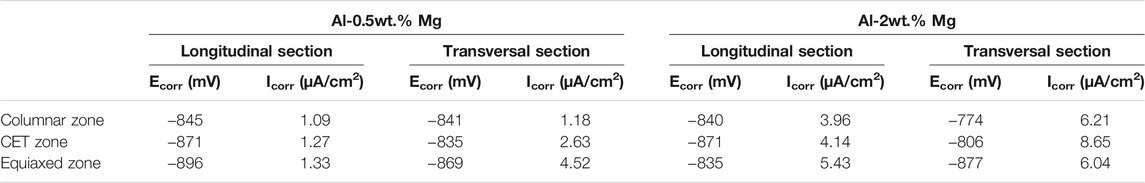
TABLE 2. Fitting corrosion potentials, Ecorr, and corrosion current density, Icorr, of Al-Mg alloys in 0.5 M NaCl.
In general, it is observed that, for the same composition, the transversal section presents nobler values of Ecorr. In addition, it was observed that with increasing Mg content, Ecorr increases. This was evident for the transversal section, while in the longitudinal section, this effect was observed only for the equiaxed grain zone.
The micrographs obtained by scanning electron microscopy (SEM) after the polarization tests are shown in Figure 7. From the comparison of Figures 7A,B, corresponding to the longitudinal section of the Al-0.5wt.%Mg alloy, it can be seen that the columnar zone is less affected. In the equiaxed grain zone (Figure 7B) the damage is clearly located in the grain border region. In the transversal section of the Al-0.5wt.%Mg alloy (Figures 7C,D), the corrosion is localized in the α-Al matrix. Figures 7E,F correspond to the Al-2wt.% Mg alloy. Figure 7E shows that the corrosion is located in the dendritic matrix close to the interdendritic boundary. Figure 7F denotes the presence of particles that may correspond to the oxide deposited in the region close to the corrosion affected zone.
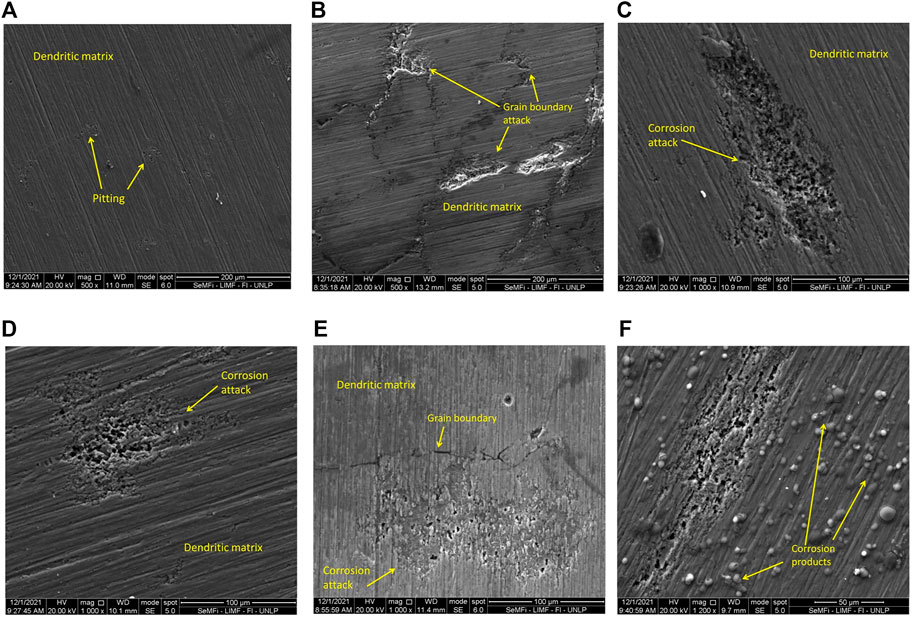
FIGURE 7. SEM micrographs of Al-Mg alloys after corrosion tests: (A) Al-0.5wt.%Mg columnar zone (longitudinal). (B) Al-0.5wt.%Mg equiaxed zone (longitudinal section). (C) Al-0.5wt.%Mg columnar zone (transversal section). (D) Al-0.5wt.%Mg equiaxed zone (transversal section). (E) Al-2wt.%Mg columnar zone (longitudinal section). (F) Al-2wt.%Mg equiaxed zone (longitudinal section).
Figure 8 shows the Nyquist diagrams obtained from the EIS measurements of the Al-Mg alloys. As it has been reported in other works on aluminum base alloys in chloride-containing solutions, the analysis of impedance data at frequencies lower than 0.1 Hz is difficult, probably due to the non-stationary nature of the pitting phenomenon (Frankel, 2008; Román et al., 2021). Consequently, we have decided not to consider points at frequencies below 0.05 Hz. The scattering of the data was even more evident for the samples from the equiaxed grain zone, because in those cases we chose to ignore data below 0.1 Hz.
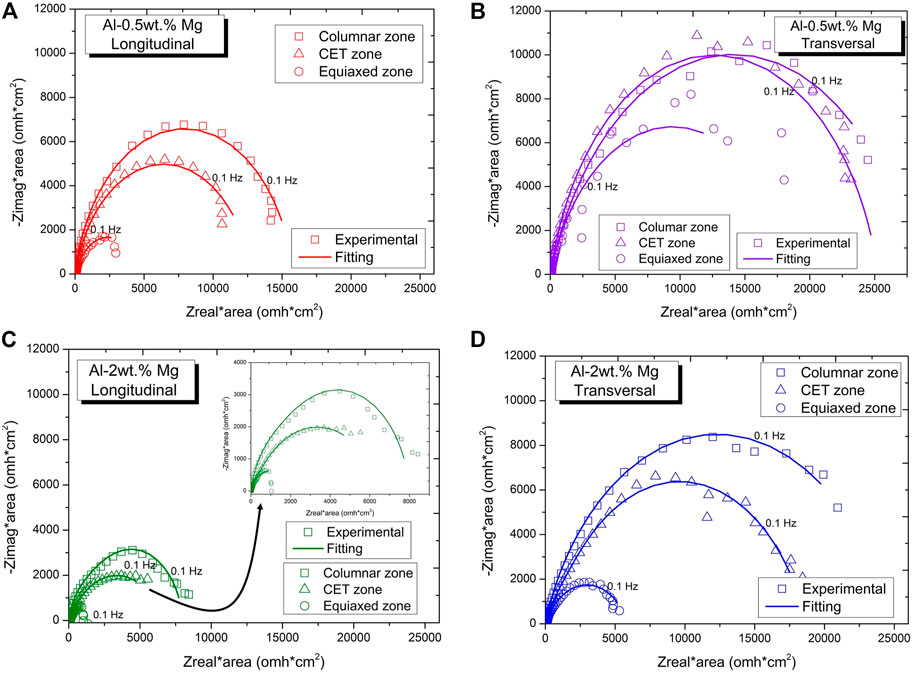
FIGURE 8. Nyquist diagrams of Al-Mg alloys. (A) Al-0.5wt.% Mg alloy (longitudinal). (B) Al-0.5wt.% Mg alloy (transversal). (C) Al-2wt.%Mg alloy (longitudinal). (D) Al-2wt.%Mg (transversal) alloy.
For all the samples studied, the Nyquist diagram showed a capacitive semicircle at high and medium frequencies. For the same alloy composition, it can be seen that the diameter of such semicircle increases for the cross section of the samples. Ares et al. (Ares et al., 2011) pointed out that the diameter of such semicircle is related to the corrosion resistance. Therefore, it can be deduced that the transversal section of the Al-Mg samples presented higher corrosion resistance than the longitudinal section. The size of the capacitive arcs obtained for the longitudinal section of the Al-2wt.%Mg were notably smaller than the rest of the alloys studied.
Figure 9 displays the Bode diagrams of the alloys studied. The impedance responses were simulated using the equivalent circuit of two nested time constants shown in Figure 10. The use of such a circuit has been reported to explain the behavior of aluminum base alloys as well as Mg base alloys with aluminum coatings (Frankel, 2008; Román et al., 2021; Wei et al., 2021; Ma et al., 2022). RΩ represents the solution resistance. R1 and CPE1 correspond to the pore resistance and the capacitance of the outer porous layer respectively. R2 and CPE2, represent the resistance and the capacitance of the barrier layer (Orazem and Tribollet, 2008; Sekularac and Milosev, 2018; Wei et al., 2021). The deviation from the ideal capacitive behavior due to the inhomogeneous interface, is represented by using CPE with coefficients n1 and n2 (Román et al., 2021; Ma et al., 2022).

FIGURE 9. Bode diagrams of Al-Mg alloys. (A) Al-0.5wt.% Mg alloy (longitudinal). (B) Al-0.5wt.% Mg alloy (transversal). (C) Al-2wt.% Mg alloy (longitudinal). (D) Al-2wt.% Mg alloy (transversal).
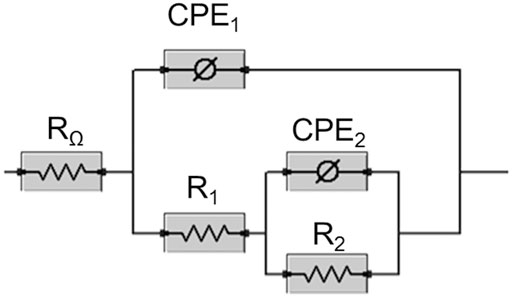
FIGURE 10. Equivalent circuit used to fit the experimental data.
The parameters of the impedance settings of the samples studied are presented in Table 3. From the summation of the resistances R1 and R2, the values of the polarization resistance Rp were obtained, which can be seen in Figure 11. Higher values of Rp indicate higher corrosion resistance (Ares and Gassa, 2012).
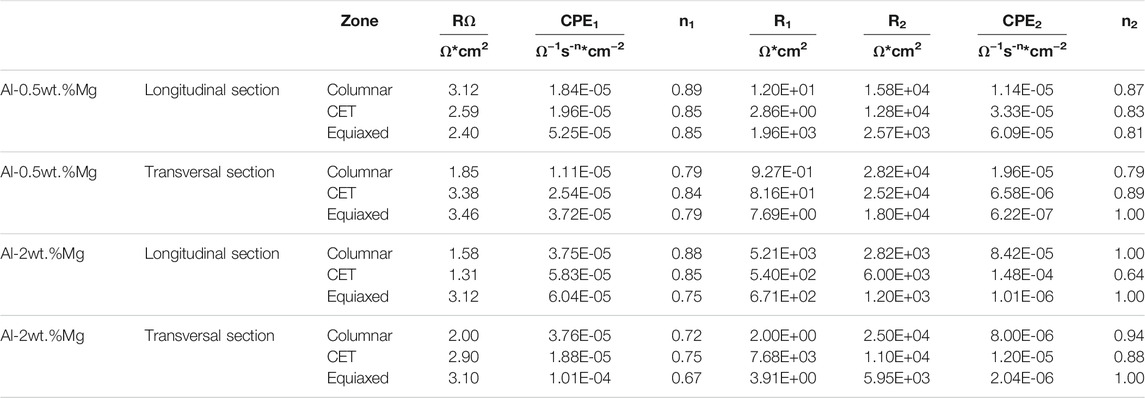
TABLE 3. Electrochemical impedance spectroscopy fitting parameters.
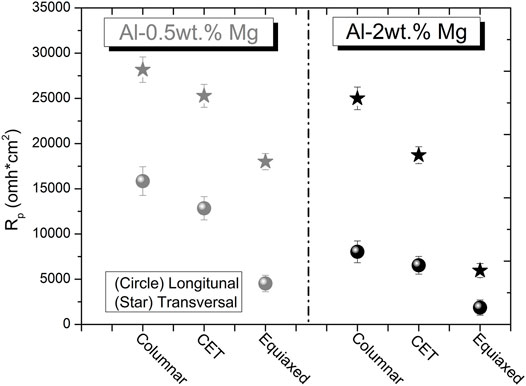
FIGURE 11. Polarization resistance, Rp, of Al-Mg alloys in 0.5 M NaCl solution.
Figure 11 shows that the corrosion resistance, for the same alloy, decreases from the base to the upper zone of the samples; that is, from the columnar grain zone to the equiaxed grain zone. This behavior coincides with that observed in the polarization curves. Moreover, for the same alloy composition, the transversal section shows better polarization resistance than the longitudinal section. However, the polarization curves seem to show a better corrosion behavior for the longitudinal section. This could be explained by considering the values of the impedance matching parameters shown in Table 3. Comparing the values of n1, corresponding to the CPE1 of the two sections for the same sample, it is observed that the longitudinal section presents values closer to 1 with respect to the transverse zone. This would indicate that the porosity of the oxide formed in the longitudinal section is lower. This behavior could be due to the adhesion of the detached oxide product of the corrosive attack, which can be observed in Figure 7F. In addition, it is evident that the values of the resistance associated to the pores, R1 are higher for the longitudinal section than for the transversal section. This could explain the behavior observed in the potentiodynamic curves. These curves would be reflecting the “performance” of this resistance R1, associated to the pores, but that is not significant in relation to the corrosion resistance of the samples. According to Table 3, the R2 values are higher than the R1 values for all the samples, so that the barrier layer evidently provided the corrosion resistance (Osório et al., 2013). On the other hand, it is clear that as the Mg content increases, for the same grain zone and the same transversal-section, the polarization resistance decreases.
In the case of the correlation of the polarization resistance, Rp, with the secondary dendritic arm spacing for Al-2wt.%Mg alloy; so, when λ2 increases, the polarization resistance, Rp, decreases (Figure 12A).
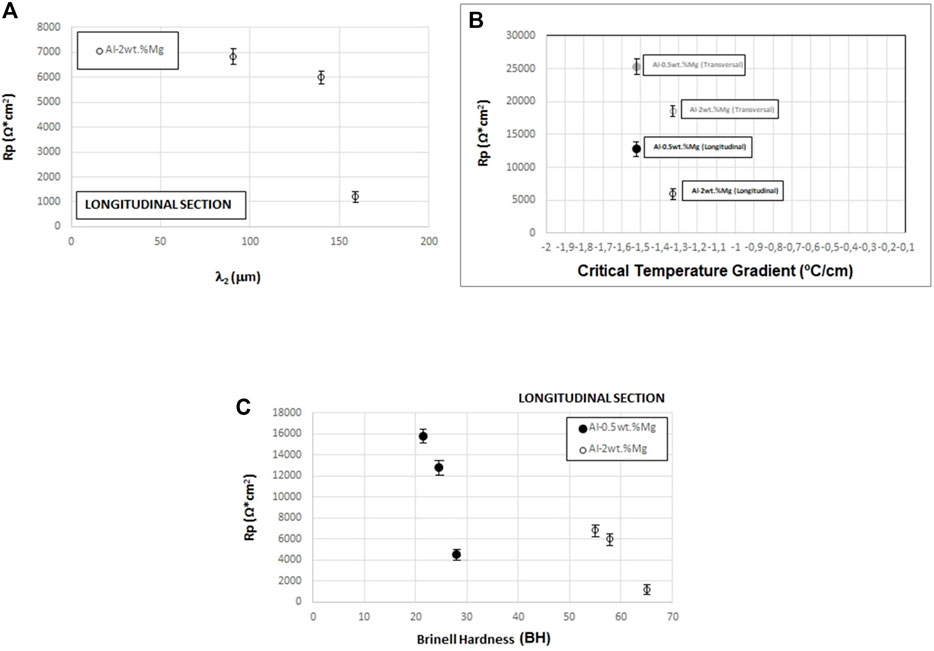
FIGURE 12. Polarization resistance, Rp, versus (A) secondary dendritic arm spacing, λ2, for Al-2wt.%Mg alloy, (B) critical temperature gradient, GC, and (C) Brinell hardness, BH, for Al-0.5wt.%Mg and Al-2wt.%Mg alloys.
The values of the polarization resistance, Rp, were correlated with the values of temperature gradient in the liquid at the moment of the CET (critical values), GC, for each concentration, where it is observed that, when GC becomes more negative (Figure 12B), the Rp increases.
Since the microhardness is a very localized parameter, and the hardness allows a deeper understanding of the relationship between the structure and properties of a material (Maruschak et al., 2012), the polarization resistance, Rp, is correlated to the Brinell hardness, HB, in Figure 12C it is possible to observe that when the Brinell hardness, HB, increases the polarization resistance decreases for both alloys.
Using potentiodynamic polarization and electrochemical impedance spectroscopy (EIS) techniques, allowed us to evaluate the corrosion behavior of Al-0.5wt.% Mg and Al-2wt.% Mg alloys in a 0.5% NaCl solution.
The values of the polarization resistance were used as a basic criterion for the evaluation of the corrosion resistance of both alloys, but do not indicate the protective properties of the films formed on the directionally solidified Al-Mg alloys.
For both compositions of Al-Mg alloys and sections of the samples, the columnar grain zone presents a higher corrosion resistance than that of the equiaxed grain zone.
Considering the polarization resistance values obtained for the EIS tests, it is concluded that the transversal section presents a higher corrosion resistance than the longitudinal section of the samples. In the same sense, the Al-0.5wt.% Mg alloy presents higher corrosion resistance than the Al-2wt.% Mg alloy.
The polarization resistance decreases with 1) the increasing in the distance from the base of the sample, 2) the increasing in grain size and secondary dendritic arm spacing, and 3) the increasing in Brinell hardness and Vickers microhardness.
The polarization resistance increases when the critical temperature gradient decreases.
The original contributions presented in the study are included in the article/Supplementary Material, further inquiries can be directed to the corresponding author.
All authors listed have made a substantial, direct, and intellectual contribution to the work and approved it for publication.
National Agency of Scientific and Technological Promotion of Argentina (ANPCyT) under PICT-2017-0079 grant. National Scientific and Technical Research Council (Consejo Nacional de Investigaciones Científicas y Técnicas—CONICET) under PUE-CONICET- Announcement 2018 of the Materials Institute of Misiones (Instituto de Materiales de Misiones- IMAM) grant.
The authors declare that the research was conducted in the absence of any commercial or financial relationships that could be construed as a potential conflict of interest.
All claims expressed in this article are solely those of the authors and do not necessarily represent those of their affiliated organizations, or those of the publisher, the editors and the reviewers. Any product that may be evaluated in this article, or claim that may be made by its manufacturer, is not guaranteed or endorsed by the publisher.
The authors appreciate the financial support provided by the National Scientific and Technical Research Council (Consejo Nacional de Investigaciones Científicas y Técnicas—CONICET), the National Council for Scientific and Technological Outreach (Agencia Nacional de Promoción Científica y Tecnológica de Argentina (ANPCyT) for their funding through the grant PICT-2017-0079 and the Research Project of the executing entity—PUE-CONICET: PUE 22920180100025CO—Announcement 2018 of the Materials Institute of Misiones (Instituto de Materiales de Misiones- IMAM).
Aguilera Luna, I., Mancha Molinar, H., Castro Román, M. J., Escobedo Bocardo, J. C., and Herrera Trejo, M. (2013). Improvement of the Tensile Properties of an Al-Si-Cu-Mg Aluminum Industrial alloy by Using Multi Stage Solution Heat Treatments. Mater. Sci. Eng. A 561, 1–6. doi:10.1016/j.msea.2012.10.064
Amin, M. A., Abd El Rehim, S. S., Moussa, S. O., and Ellithy, A. S. (2008). Pitting Corrosion of Al and Al-Cu Alloys by ClO4− Ions in Neutral Sulphate solutionsPitting Corrosion of Al and Al-Cu Alloys by ClO4 Ions in Neutral Sulphate Solutions. Electrochim. Electrochimica Acta 53, 5644–5652. doi:10.1016/j.electacta.2008.03.010
Ares, A. E., Caram, R., and Schvezov, C. E. (2003a). “Analysis of Grain Size Obtained during Directional Solidification of Aluminum Based Alloys,” in The Light Metals 2003: Proceedings of the technical sessions presented by the TMS Aluminium Committee at the 132nd TMS Annual Meetings, Warrendale, PA (The Minerals, Metals and Materials Society), 1055–1061. 087339531X.978-087339531-1.
Ares, A. E., Caram, R., and Schvezov, C. E. (2003b). “Columnar to Equiaxed Transition Studies in Aluminum-Magnesium and Aluminum-Zinc Alloys,” in The Light Metals 2003: Proceedings of the technical sessions presented by the TMS Aluminium Committee at the 132nd TMS Annual Meetings, Warrendale, PA (The Minerals, Metals and Materials Society), 1047–1054. 087339531X.978-087339531-1.
Ares, A. E., Caram, R., and Schvezov, C. E. (2004). “The Effect of Solidification Parameters on Dendrite Spacing in Unidirectional Solidification,” in The 2004 TMS Annual Meeting, Warrendale, PA (The Minerals, Metals and Materials Society), 751–765.
Ares, A. E., and Gassa, L. M. (2012). Corrosion Susceptibility of Zn-Al Alloys with Different Grains and Dendritic Microstructures in Nacl Solutions. Corrosion Sci. 59, 290–306. doi:10.1016/j.corsci.2012.03.015
Ares, A. E., Gassa, L. M., Gueijman, S. F., and Schvezov, C. E. (2008). Correlation between Thermal Parameters, Structures, Dendritic Spacing and Corrosion Behavior of Zn-Al Alloys with Columnar to Equiaxed Transition. J. Cryst. Growth 310, 1355–1361. doi:10.1016/j.jcrysgro.2007.11.169
Ares, A. E., Gassa, L. M., Schvezov, C. E., and Gueijman, S. F. (2011). “Relationship between Structure and Properties of Al-Cu Alloys,” in The Shape Cast. 4th International Symposium, Warrendale, PA (The Minerals, Metals and Materials Society), 207–214. doi:10.1002/9781118062050.ch25
Ares, A. E., Gueijman, S. F., and Schvezov, C. E. (2010). An Experimental Investigation of the Columnar-To-Equiaxed Grain Transition in Aluminum-Copper Hypoeutectic and Eutectic Alloys. J. Cryst. Growth 312, 2154–2170. doi:10.1016/j.jcrysgro.2010.04.040
Ares, A. E., Ramos, S. G., and Méndez, C. M. (2018). “Electrochemical Characterization of Al–Li–Cu–Mg Alloys,” in The Minerals, Metals and Materials Series, Part F4, Warrendale, PA (The Minerals, Metals and Materials Society), 983–989. doi:10.1007/978-3-319-72284-9_128
Ares, A. E., and Schvezov, C. E. (2015). “Columnar-to-equiaxed Transition in Zn-27wt.%Al Alloys: A Comparation between Vertical and Horizontal Directional Solidifications,” in The TMS Annual Meeting, Warrendale, PA (The Minerals, Metals and Materials Society), 93–100. doi:10.1002/9781119093367.ch12
Ares, A. E., and Schvezov, C. E. (2007). Influence of Solidification Thermal Parameters on the Columnar-To-Equiaxed Transition of Aluminum-Zinc and Zinc-Aluminum Alloys. Metall. Mat Trans. A. 38, 1485–1499. doi:10.1007/s11661-007-9111-z
Ares, A. E., and Schvezov, C. E. (2000). Solidification Parameters during the Columnar-To-Equiaxed Transition in Lead-Tin Alloys. Metall. Mat Trans. A. 31, 1611–1625. doi:10.1007/s11661-000-0171-6
Ares, A. E., and Schvezov, C. E. (2011). The Effect of Structure on Tensile Properties of Directionally Solidified Zn-Based Alloys. J. Cryst. Growth 318, 59–65. doi:10.1016/j.jcrysgro.2010.11.112
Ares, A., Rodriguez, C. M., Méndez, C. M., Schvezov, C. E., and Rosenberger, M. R. (2016). “Microhardness, Corrosion Behaviour and Microstructures of Directionally Solidified Al-Cu Alloys,” in The Minerals, Metals and Materials Series, Warrendale, PA (The Minerals, Metals and Materials Society), 469–473. doi:10.1007/978-3-319-65136-1_81
Arrabal, R., Mingo, B., Pardo, A., Mohedano, M., Matykina, E., and Rodríguez, I. (2013). Pitting Corrosion of Rheocast A356 Aluminium Alloy in 3.5wt.% NaCl Solution. Corros. Sci. 73, 342–355. doi:10.1016/j.corsci.2013.04.023
Barsoukov, E., and Ross McDonald, J. (2005). Impedance Spectroscopy. Theory, Experiment and Applications, John, Wiley & Sons, Inc., Hoboken. New Jersey and Canada.
Boag, A., Taylor, R. J., Muster, T. H., Goodman, N., McCulloch, D., Ryan, C., et al. (2010). Stable Pit Formation on AA2024-T3 in a NaCl Environment. Corrosion Sci. 52, 90–103. doi:10.1016/j.corsci.2009.08.043
Boyer, H. E., and Gall, T. L. (1990). Metals Handbook, Desk Edition. American Society for Metals, 35–18.
Canales, A. A., Carrera, E., Silva, J. T., Valtierra, S., and Colás, R. (2012). Mechanical Properties in As-Cast and Heat Treated Al-Si-Cu Alloys. Ijmmp 7 (4), 281–300. doi:10.1504/ijmmp.2012.048518
Chen, L.-Y., Zhang, H.-Y., Zheng, C., Yang, H.-Y., Qin, P., Zhao, C., et al. (2021). Corrosion Behavior and Characteristics of Passive Films of Laser Powder Bed Fusion Produced Ti-6Al-4V in Dynamic Hank's Solutionfilms of Laser Powder Bed Fusion Produced Ti–6Al–4V in Dynamic Hank’s Solution. Mater. Des. 208, 109907. doi:10.1016/j.matdes.2021.109907
Frankel, G. (2008). Electrochemical Techniques in Corrosion: Status, Limitations and Needs. J. ASTM Int. 5, 1–27. doi:10.1520/jai101241
Gauto, E., Kramer, G. R., Méndez, C. M., and Ares, A. E. (2018). Effects of the Use of Support Electrolytes in Electrochemical Tests of Al-4wt.% Mg alloy Exposed to Bioethanol Fuel. Revista Materia 23 (22018), e-12050. doi:10.1590/S1517-707620180002.0386
Geng, Y., Panchenko, I., Chen, X., Ivanov, Y., and Konovalov, S. (2021b). Investigation of Microstructure and Fracture Mechanism of Al-5.0Mg Alloys Fabricated by Wire Arc Additive Manufacturing. J. Materi Eng. Perform. 30 (10), 7406–7416. doi:10.1007/s11665-021-05973-0
Geng, Y., Panchenko, I., Konovalov, S., Chen, X., and Ivanov, Y. (2021a). Effect of Electron Beam Energy Densities on the Surface Morphology and Tensile Property of Additively Manufactured Al-Mg alloy. Nucl. Instr. Methods Phys. Res. Section B: Beam Interactions Mater. Atoms 498, 15–22. doi:10.1016/j.nimb.2021.04.008
Gueijman, S. F., Schvezov, C. E., and Ares, A. E. (2010). Vertical and Horizontal Directional Solidification of Zn-Al and Zn-Ag Diluted Alloys. Mater. Trans. 51, 1861–1870. doi:10.2320/matertrans.M2010036
Jayalakshmi, S., Dezhi, Q., Sankaranarayanan, S., and Gupta, M. (2013). Microstructure and Mechanical Properties of Mg-Al Alloys with In Situ Al4C3 Phase Synthesised by CO2 Incorporation during Liquid State Processing. Ijmmp 8 (4/5), 283–298. doi:10.1504/ijmmp.2013.057066
Kaygisiz, Y., and Marasli, N. (2015). Microstructural, Mechanical and Electrical Characterization of Directionally Solidified Al–Si–Mg Eutectic alloy. J. Alloys Compd. 618, 197–203. doi:10.1016/j.jallcom.2014.08.056
Kociubczyk, A. I., Desrosin, W., Boycho, L. M., Schvezov, C. E., and Ares, A. E. (2015). “Interphase Evolution and Defect Formation during Horizontally Directional Solidification Process of Sn-Zn Alloys,” in The EPD Congress 2015Warrendale, PA (The Minerals, Metals and Materials Society), 57–64. doi:10.1007/978-3-319-48214-9_7
Kociubzyk, A. I., Rozicki, R. S., and Ares, A. E. (2018). Movement of the Interphases during the Horizontal Solidification of Tin-Zinc Alloys. Revista Materia 23 (2), e-11993. doi:10.1590/s1517-707620180002.0330
Kramer, G. R., Gauto, E., Rozicki, R. S., Méndez, C. M., and Ares, A. E. (2017). “Corrosion of Al–Mg Alloys in Ethanol,” in The Minerals, Metals and Materials Series, Warrendale, PA (The Minerals, Metals and Materials Society), 455–461. doi:10.1007/978-3-319-51541-0_57
Kramer, G. R., Méndez, C. M., and Ares, A. E. (2016). “Corrosion Resistance of Different Aluminum Alloys in Ethanol,” in The Light Metals 2016, Warrendale, PA (The Minerals, Metals and Materials Society), 265–270. doi:10.1002/9781119274780.ch44
Kramer, G. R., Méndez, C. M., and Ares, A. E. (2018). Evaluation of Corrosion Resistance of Commercial Aluminum Alloys in Ethanol Solutions. Mater. Res. 21 ((62018)), e20170272. doi:10.1590/1980-5373-MR-2017-0272
Kro´l, M., Tan´ski, T., Matula, G., Snopin´ski, P., and Tomiczek, A. E. (2015). Analysis of Crystallisation Process of Cast Magnesium Alloys Based on thermal Derivative Analysis. Arch Metall Mater. 2015 60 (4), 2993–3000. doi:10.1515/amm-2015-0478
Krupin´ski, M., Labisz, K., Tan´ski, T., Krupin´ska, B., Kro´l, M., and Polok Rubiniec, M. (2016). Influence of Mg Addition on Crystallisation Kinetics and Structure of the Zn–Al–Cu alloy. Arch. Metall. Mater. 61 (2), 785–790. doi:10.1515/amm-2016-0132
Liu, D.-R., Wang, S., and Yan, W. (2020). Grain Structure Evolution in Transition-Mode Melting in Direct Energy Deposition. Mater. Des. 194, 108919. doi:10.1016/j.matdes.2020.108919
Liu, J., and To, A. C. (2017). Quantitative Texture Prediction of Epitaxial Columnar Grains in Additive Manufacturing Using Selective Laser Melting. Additive Manufacturing 16, 58–64. doi:10.1016/j.addma.2017.05.005
Liu, S., Zhu, H., Peng, G., Yin, J., and Zeng, X. (2018). Microstructure Prediction of Selective Laser Melting AlSi10Mg Using Finite Element Analysis. Mater. Des. 142, 319–328. doi:10.1016/j.matdes.2018.01.022
Ma, Y., Liu, Y., and Wang, M. (2022). Microstructures and Corrosion Resistances of Hypoeutectic Al-6.5Si-0.45 Mg Casting alloy with Addition of Sc and Zr. Mater. Chem. Phys. 276, 125321. doi:10.1016/j.matchemphys.2021.125321
Maruschak, P. O., Okipnyi, I. B., PoberezhnyiYa, L., and Maruschak, E. V. (2012). Study of Heat-Resistant Steel Strain Hardening by Indentation. Metallurgist 56 (11–12), 946–951.
Méndez, C. M., Scheiber, V. L., Rozicki, R. S., Kociubczyk, A. I., and Ares, A. E. (2018). Electrochemical Behavior of Sn-Zn Alloys with Different Grain Structures in Chloride-Containing Solutions. Arabian J. Chem. 11 (7), 1084–1096. doi:10.1016/j.arabjc.2016.12.019
Oliveira, J. P., LaLonde, A. D., and Ma, J. (2020). Processing Parameters in Laser Powder Bed Fusion Metal Additive Manufacturing. Mater. Des. 193, 108762. doi:10.1016/j.matdes.2020.108762
Orazem, M., and Tribollet, B. (2008). Hoboken. Wiley, 157–159. doi:10.1002/9780470381588 Electrochemical Impedance Spectroscopy
Osório, W. R., Freitas, E. S., and Garcia, A. (2013). EIS and Potentiodynamic Polarization Studies on Immiscible Monotectic Al-In Alloys. Electrochimica Acta 102, 436–445. doi:10.1016/j.electacta.2013.04.047
Román, A. S., Méndez, C. M., and Ares, A. E. (2014). Corrosion Resistance of Al-Cu Alloys in Function of the Microstructure. Msf 783-786, 100–107. doi:10.4028/www.scientific.net/msf.783-786.100
Román, A. S., Méndez, C. M., Gervasi, C. A., Rebak, R. B., and Ares, A. E. (2021). Corrosion Resistance of Aluminum-Copper Alloys with Different Grain Structures. J. Materi Eng. Perform. 30 (1), 131–144. doi:10.1007/s11665-020-05344-1
Román, A. S., Méndez, C. M., Schvezov, C. E., and Ares, A. E. (2015). “Electrochemical Properties of Al-Cu Alloys in NaCl Solutions,” in The TMS 2015, Characterization of Minerals, Metals, and Materials 2015, Warrendale, PA (The Minerals, Metals and Materials Society), 727–734. doi:10.1007/978-3-319-48191-3_92
Rozicki, R. S., Kociubczyk, A. I., Kramer, G. R., and Ares, A. E. (2018). “Observations of Microhardness and Evolution of Constituents in Al–Zn and Zn–Al Specimens with Columnar-To-Equiaxed Grain Transition,” in The Minerals, Metals and Materials Series, Part F4, Warrendale, PA (The Minerals, Metals and Materials Society), 1081–1088. doi:10.1007/978-3-319-72284-9_141
Satizabal, L. M., Costa, D., Moraes, P. B., Bortolozo, A. D., and Osório, W. R. (2019). Microstructural Array and Solute Content Affecting Electrochemical Behavior of Sn Ag and Sn Bi Alloys Compared with a Traditional Sn Pb alloyMicrostructural Array and Solute Content Affecting Electrochemical Behavior of SnAg and SnBi Alloys Compared with a Traditional SnPb alloy. Mater. Chem. Phys. 223, 410–425. doi:10.1016/j.matchemphys.2018.11.003
Sekularac, G., and Milosev, I. (2018). Corrosion of Aluminium Alloy AlSi7Mg0.3 in Artificial Sea Water with Added Sodium Sulphide. Corros. Sci. 144, 54–73. doi:10.1016/j.corsci.2018.08.038
Shokuhfar, A., and Nejadseyfi, O. (2014). A Comparison of the Effects of Severe Plastic Deformation and Heat Treatment on the Tensile Properties and Impact Toughness of Aluminum alloy 6061. Mater. Sci. Eng. A 594, 140–148. doi:10.1016/j.msea.2013.11.067
Shu-qing, Y., and Xing-fu, L. (2014). The Effect of Si Morphology on the Microstructure and Wear Property of ZA48 alloy. Int. J. Microstruct Mater. Prop 9 (1), 88–96.
Song, D., Sang, P., Chen, L., Zhao, C., Wang, Z., Wang, H., et al. (2019). Particle Size-dependent Microstructure, Hardness and Electrochemical Corrosion Behavior of Atmospheric Plasma Sprayed NiCrBSi Coatings. Metals 9, 1342. doi:10.3390/met9121342
Song, J., Chew, Y., Bi, G., Yao, X., Zhang, B., Bai, J., et al. (2018). Numerical and Experimental Study of Laser Aided Additive Manufacturing for Melt-Pool Profile and Grain Orientation Analysis. Mater. Des. 137, 286–297. doi:10.1016/j.matdes.2018.11.01410.1016/j.matdes.2017.10.033
Spittle, J. A. (2006). Columnar to Equiaxed Grain Transition in as Solidified Alloys. Int. Mater. Rev. 51, 247–269. doi:10.1179/174328006X102493
Szklarska-Smialowska, Z. (1999). Pitting Corrosion of Aluminum. Corrosion Sci. 41, 1743–1767. doi:10.1016/j.corsci.2011.11.01010.1016/s0010-938x(99)00012-8
Totten, G. E., Xie, L., and Funatani, K. (2004). Handbook of Mechanical Alloy Design. 6000 Broken Sound Parkway NW, USA: Taylor & Francis.
Wang, X.-h., Wang, J.-h., and Fu, C.-w. (2014). Characterization of Pitting Corrosion of 7A60 Aluminum Alloy by EN and EIS Techniques. Trans. Nonferrous Met. Soc. China 24, 3907–3916. doi:10.1016/s1003-6326(14)63550-0
Wei, B., Cheng, Y., Liu, Y., Zhu, Z., and Cheng, Y. (2021). Corrosion and Wear Resistance of AZ31 Mg alloy Treated by Duplex Process of Magnetron Sputtering and Plasma Electrolytic Oxidation. Trans Nonferrous Met Soc China. Trans. Nonferrous Met. Soc. China 31, 2287–2306. doi:10.1016/S1003-6326(21)65655–65658
Xia, S. L., Ma, M., Zhang, J. X., Wang, W. X., and Liu, W. C. (2014). Effect of Heating Rate on the Microstructure, Texture and Tensile Properties of Continuous Cast AA 5083 Aluminum alloy. Mater. Sci. Eng. A 609, 168–176. doi:10.1016/j.msea.2014.05.002
Xiang, S., Li, J., Luan, H., Amar, A., Lu, S., Li, K., et al. (2019). Effects of Process Parameters on Microstructures and Tensile Properties of Laser Melting Deposited CrMnFeCoNi High Entropy Alloys. Mater. Sci. Eng. A 743, 412–417. doi:10.1016/j.matdes.2020.10926210.1016/j.msea.2018.11.110
Xu, C., Chen, L.-Y., Zheng, C.-B., Zhang, H.-Y., Zhao, C.-H., Wang, Z.-X., et al. (2021). Improved Wear and Corrosion Resistance of Microarc Oxidation Coatings on Ti-6Al-4V Alloy with Ultrasonic Assistance for Potential Biomedical Applications. Adv. Eng. Mater. 23, 2001433. doi:10.1002/adem.202001433
Yasakau, K. A., Zheludkevich, M. L., and Ferreira, M. G. S. (2018). “Role of Intermetallics in Corrosion of Aluminum Alloys,” in Smart Corrosion Protection (Amsterdam: Elsevier). doi:10.1016/b978-0-85709-346-2.00015-7
Zhang, X., Chen, H., Xu, L., Xu, J., Ren, X., and Chen, X. (2019). Cracking Mechanism and Susceptibility of Laser Melting Deposited Inconel 738 Superalloy. Mater. Des. 183, 108105. doi:10.1016/j.matdes.2019.108105
Zhao, X.-h., Zuo, Y., Zhao, J.-m., Xiong, J.-p., and Tang, Y.-m. (2006). A Study on the Self-Sealing Process of Anodic Films on Aluminum by EIS. Surf. Coat. Tech. 200, 6846–6853. doi:10.1016/j.surfcoat.2005.10.031
Keywords: Al-Mg diluted alloys, corrosion resistance, directional solidification, thermal parameters, structures, microhardness
Citation: Román AS, Ibañez ER, Méndez CM, Pedrozo M, Kramer GR, Zadorozne NS, Alonso PR and Ares AE (2022) Electrochemical Properties of Diluted Al-Mg Alloys With Columnar-To-Equiaxed Transition. Front. Mater. 9:857671. doi: 10.3389/fmats.2022.857671
Received: 18 January 2022; Accepted: 17 February 2022;
Published: 08 March 2022.
Edited by:
Liang Wu, Chongqing University, ChinaReviewed by:
Sheng Lu, Jiangsu University of Science and Technology, ChinaCopyright © 2022 Román, Ibañez, Méndez, Pedrozo, Kramer, Zadorozne, Alonso and Ares. This is an open-access article distributed under the terms of the Creative Commons Attribution License (CC BY). The use, distribution or reproduction in other forums is permitted, provided the original author(s) and the copyright owner(s) are credited and that the original publication in this journal is cited, in accordance with accepted academic practice. No use, distribution or reproduction is permitted which does not comply with these terms.
*Correspondence: Alicia Esther Ares, YWFyZXNAZmNlcXluLnVuYW0uZWR1LmFy
†These authors have contributed equally to this work and share first authorship
Disclaimer: All claims expressed in this article are solely those of the authors and do not necessarily represent those of their affiliated organizations, or those of the publisher, the editors and the reviewers. Any product that may be evaluated in this article or claim that may be made by its manufacturer is not guaranteed or endorsed by the publisher.
Research integrity at Frontiers
Learn more about the work of our research integrity team to safeguard the quality of each article we publish.