 Gang Yao1,2
 Yang Yang
- 1School of Civil Engineering, Chongqing University, Chongqing, China
- 2Key Laboratory of New Technology for Construction of Cities in Mountain Area, Ministry of Education, Chongqing, China
Chromatic aberration is one of the quality defects in the appearance of fair-faced concrete (FFC). The mainly surface chromatic aberration identification (CAI) method being applied is manual observation, which is subjective and time-consuming. A multi-scale lightweight structured data algorithm (MSLSDA) for CAI in FFC is proposed in this manuscript. An unmanned aerial vehicle (UAV) is used for image acquisition. 2368 FFC sample images are collected to build the datasets. The FFC chromatic aberration features are identified by the improved Residual Network Convolutional Neural Network (CNN) framework to achieve chromatic aberration samples quantitative analysis. The method proposed in this manuscript can verify the generalization prediction ability of the MSLSDA for different building samples by generalization prediction set. The results show that the accuracy in CAI samples and chromatic aberration generalization prediction samples can achieve 92.1 and 99.6%, respectively. The FFC chromatic aberration detection platform (FFC-CADP) built by color space conversion, histogram equalization, image color recognition, image noise reduction and image mask algorithm is able to calculate boundary features, geometric parameter features (length and width), chromatic aberration ratio features, total chromatic aberration ratio and number of chromatic aberration.
Introduction
Architects believe that FFC reveals the most essential architectural aesthetics (Coburn et al., 2019). Compared with ordinary concrete, FFC has been widely used in domestic and international buildings for its natural surface as a decorative surface, which has a high-quality appearance while satisfying mechanics and durability. The decorative surface of FFC reduces the increased costs associated with additional decorative surfaces, so the probability of budget changes during construction is low (Miranda et al., 2020). FFC has been applied and achieved positive results not only in transportation centers and commercial buildings such as Chongqing West Station, Raffles Chengdu and Raffles Chongqing, but also in modern religious buildings (Ribeiro and Xavier, 2019). The chromatic aberration control on the FFC decorative surface affects the overall effect of the building, so chromatic aberration is a key point in the control of FFC appearance. At present, the research on the appearance quality of FFC is divided into two main directions, one is to study the factors affecting chromatic aberration and their improvements, and the other is to study the evaluation method of the FFC appearance quality.
The appearance quality of FFC is directly influenced by its own factors such as mix ratio and saturation. Studies have shown that the increase in cement saturation is beneficial to the appearance quality of FFC, but the mechanical properties of concrete decrease (Ajtayne Karolyfi and Papp, 2021). The self-compaction and appearance quality of FFC can be improved via adjusting the coarse aggregate gradation, but its application is limited due to the complex processes and high costs (Wu et al., 2021). The surface color and brightness of FFC are influenced by the cement content, water-cement ratio and sand ratio in that order (Mohammed et al., 2021). In the field of FFC apparent quality identification, there are more studies on crack identification and bubble identification. The diagnosis and repair of FFC surfaces can be performed by collecting images of the original FFC structure and combining them with machine vision techniques (Piferi, 2018), but there are still irreparable defects in the concrete appearance quality, and the diagnosis and repair work will be resource-intensive. This manuscript designs an experimental data acquisition method for FFC surface chromatic aberration based on UAV technology, it can rapidly acquire large area sample images, reduce the interference factors of image data, and improve the efficiency and quality of data acquisition. In addition, this method reduces the risk factor for staff.
The appearance quality of FFC is also indirectly influenced by factors in the production environment. Studies have shown that the effects of acid rain, haze, freeze-thaw and carbonation can cause significant chromatic aberrations in the facade of FFC buildings (Zhang et al., 2013). The dark chromatic aberration will destroy the surface appearance of FFC, and the dark chromatic aberration is more serious in the production process of outdoor FFC in winter (Chang et al., 2021). The process of removing the surface coating of FFC and mismatched release agents can lead to defects in the FFC appearance quality (Strehlein and Schiessl, 2008; Shyha et al., 2016). FFC buildings produce new chromatic aberrations in use, so it is necessary to study the identification and quantification of FFC chromatic aberration. The existing studies on the FFC surface CAI are few and cannot effectively quantify the FFC chromatic aberration.
Image processing technique can provide objective results quickly (Abouhamad et al., 2017; Mohan and Poobal, 2018; Payab et al., 2019; Chen et al., 2019; Tang et al., 2019). The identification and quantification of FFC by multi-intelligent body fuzzy systems (Payab and Khanzadi, 2021), the defects identification in the FFC appearance quality by laser point thermography (Scalbi et al., 2019), and the recording of the cracks beginning and development in combination with timelines (Prasanna et al., 2016) have been implemented. Scholars have identified the bubble contours on the FFC surface by extracting the grayscale values of the concrete surface images (Liu and Yang, 2017; Yoshitake et al., 2018). Scholars avoid the influence of subjectivity by predicting concrete performance through machine learning methods (Feng et al., 2022). This manuscript builds a FFC chromatic aberration identification model based on the optimized MSLSDA, avoids the problem of subjectivity in image processing techniques.
At present, the evaluation of the appearance quality of FFC is mainly through the image processing method (Liu et al., 2019), and the image data is segmented by selecting the appropriate threshold value (Yao et al., 2021). Therefore, the image processing process can only be applied to the current experimental data and lacks the ability to generalize to similar data (Li et al., 2020). Unlike cracks and bubbles on the surface of FFC, chromatic aberrations do not have clear boundaries and a fixed range of grayscale values, which cannot be quantified directly. This manuscript implements the FFC chromatic aberration quantization function through color space conversion, histogram equalization, image color recognition, image noise reduction and image mask operation.
A MSLSDA for FFC surface CAI is proposed in this manuscript. Firstly, the problem of subjectivity in CAI is solved by learning chromatic aberration features and classifying chromatic aberration by MSLSDA. Then, the surface chromatic aberration of FFC is quantitatively segmented by means of image processing, boundary features, geometric parameter features (length and width), chromatic aberration ratio features, total chromatic aberration ratio and number of chromatic aberration are calculated. Finally, the FFC-CADP is built to realize the prediction function and quantitative segmentation function of the FFC chromatic aberration.
Chromatic Aberration Image Acquisition Method for FFC Based on UAV
FFC buildings often have a large project volume, making it difficult for inspectors to take samples and test them. Therefore, UAV is used for image acquisition in this study (Siebert and Teizer, 2014), as shown in Figure 1. The China Overseas HuanYu Art Center and Rail Transit R1 in Jinan are identified as sample buildings for experimental data through fieldwork, as shown in Figure 2. The image acquisition device is DJ Mavic two Pro, and the performance parameters are shown in Table 1. UAV has high vertical hovering accuracy and horizontal hovering accuracy, L1D-20c Hasselblad camera lens angle can reach 84°, the nearest focus point 1m, the lens can achieve autofocus, can meet the observation requirements of 5 m from the wall. The photo resolution can reach 5,472*3,684, and the high pixel can meet the requirements of the experiment on the data amount. Positive endurance and stable flight speed can ensure the efficiency of image acquisition.
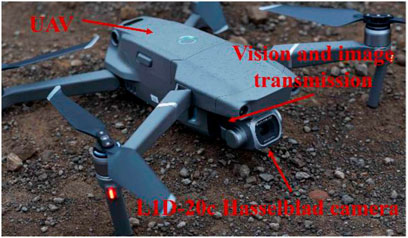
FIGURE 1. The experimental data acquisition UAV of FFC surface chromatic aberration.
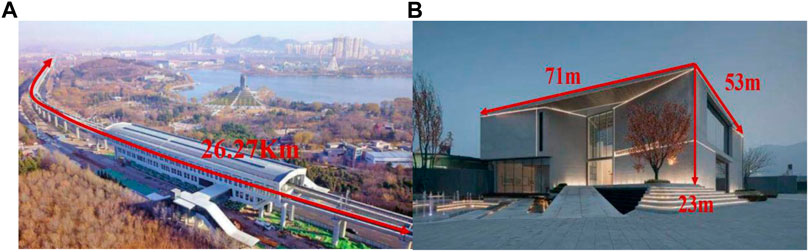
FIGURE 2. Sample buildings of FFC chromatic aberration experimental data: (A) Rail Transit R1 (sub-sample) (B) China Overseas HuanYu Art Center (main sample).
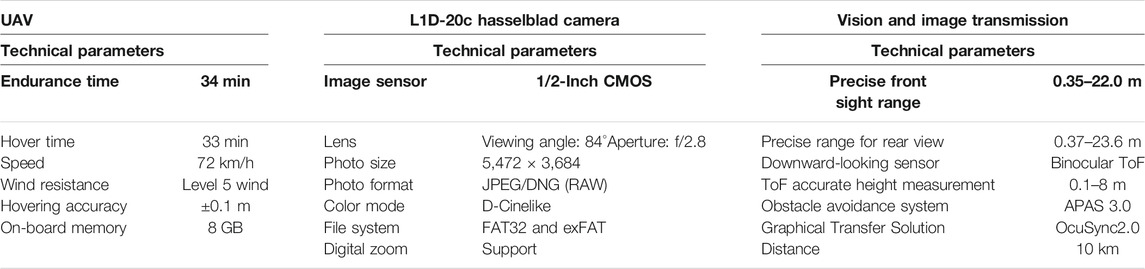
TABLE 1. UAV flight system and image transmission system configuration.
According to the current Technical Specification for Fair-faced Concrete Construction JGJ169-2009, the identification method for the FFC appearance quality shall conform to the provisions of Table 2 (Kang and Cha, 2018). To ensure the consistency of the experimental data, the UAV is 5.0 m away from the target plane, the lens normal direction is always perpendicular to the target plane, and the shooting environment is naturally illuminated under normal weather. The combination of shooting angle and plane to be photographed include vertical flat surfac, vertical curved surface, non-vertical flat surfac and non-vertical curved surface. Currently, this study addresses the chromatic aberration identification in the FFC vertical flat surfac. The cases of vertical curved surface, non-vertical flat surfac and non-vertical curved surface will be considered in further studies to improve the generalizability of the FFC chromatic aberration identification method.

TABLE 2. FFC appearance quality and testing methods (chromatic aberration).
The original image is taken by UAV at a distance of 5 m from the FFC vertical flat surfac. Obstructions obscuring light rarely occurs during the original images acquisition. And we consciously avoid shooting original images with obstructions obscuring them. In the process of dataset production, we carefully screen and remove the sample images with obstructions obscuring them. However, the phenomenon of obstructions obscuring light and creating shadow area on the FFC does exist. The pixel value of the shadow area is affected by the light intensity and obstruction position, which we will try to solve in further studies.
In order to test the ability of the MSLSDA to generalize the FFC chromatic aberration problem, chromatic aberration data were collected from China Overseas HuanYu Art Center and Rail Transit R1 during the period of 12:30–14:30 on 22 March 2021, with 13:10–14:00 as the site transition period. China Overseas HuanYu Art Center is the main sample building, and Rail Transit R1 is the sub-sample building. According to the sample buildings, 410 original images of the main sample buildings are used for the training set and validation set, and 102 original images of the sub-sample buildings are used for the generalized prediction set (Cha et al., 2017).
FFC Image Pre-processing
In order to improve the training efficiency of MSLSDA, the original data is pre-processed in this study. The original image with a resolution of 5,472 × 3,684 is segmented into 306 sample images with a resolution of 256 × 256. After excluding the images with non-chromatic appearance quality indicators from the segmented sample images, a total of 2,368 experimental sample images are obtained, as shown in Figure 3.
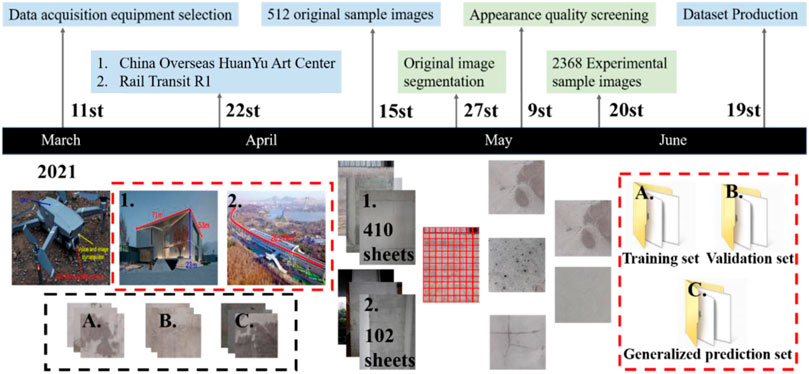
FIGURE 3. FFC chromatic aberration experimental data acquisition, pre-processing and dataset production timeline.
Among them, 1894 experimental sample images are selected from 410 original images of the main sample buildings, accounting for 80% of the total number of experimental sample images. The 474 experimental sample images are selected from the original images of 102 sub-sample buildings, accounting for 20% of the total number of experimental sample images. The 474 experimental sample images include 237 sample images without chromatic aberration and 237 sample images with chromatic aberration. 80% of the 1894 experimental sample images are randomly selected as the training set and the remaining 20% as the validation set. The validation set consists of 189 sample images without chromatic aberration and 189 sample images with chromatic aberration. The training set consists of 758 sample images without chromatic aberration and 758 sample images with chromatic aberration.
In this manuscript, generalization prediction experiments are designed to enhance the generalization ability of the MSLSDA for the FFC surface CAI problem. The optimized and trained MSLSDA will sequentially predict each experimental sample image in the generalized prediction set and output the identification result and probability value prod. The identification results are compared with the actual results to quantitatively evaluate the generalization prediction ability of the MSLSDA. The probability value prod can quantitatively evaluate the probabilistic reliability of the identification results.
Labeling and path standardization of the experimental samples are crucial to the process of producing the dataset. Firstly, input the experimental sample images and save the structured data into fixed channels and fixed dimensions. Then, the dataset form is saved as Numpy form and the dataset is reordered. Finally, the 2,368 experimental sample images in the dataset are written to the corresponding paths in the images folder to complete the dataset.
MSLSDA Hyperparameter Optimization
Residual Network CNN’s lightweight residual network structure allows for deeper learning of more features layer by layer, making the forward and backward propagation process smooth, and it is more suitable for mobile terminal environments. Therefore, the Residual Network CNN lightweight structured data algorithm framework is used to identify the surface chromatic aberration of FFC. The Residual Network CNN framework accomplishes two main tasks, including qualitative and confidence evaluation of classification accuracy on structured data. The goal of structured data qualitative is to classify the color status of sample images. Confidence is a criterion to judge whether the classification results satisfy the probability requirement or not.
Network Framework Construction
FFC-F is the first stage of Residual Network CNN framework, and its main function is to pre-process the input structured data. Same as the remaining four stages, FFC-F consists of bottleneck, but the number of bottleneck units is different. When the input channel, height and width are 3, 244 and 244, the 64 convolution kernels of FFC-F with 7 × 7 size will implement the convolution operation in step of/2. Then the 3 × 3 kernel max-pooling layer will also process the data further in step of/2. The input structured data will go through convolution layer, batch normalization layer, ReLU and max-pooling layer to get 64, 56, 56 output shapes. Where the 64 channel represents the number of convolutional kernels in the first convolutional layer, and 56 is the quotient of the input value and the corresponding step size, as in Figure 4.
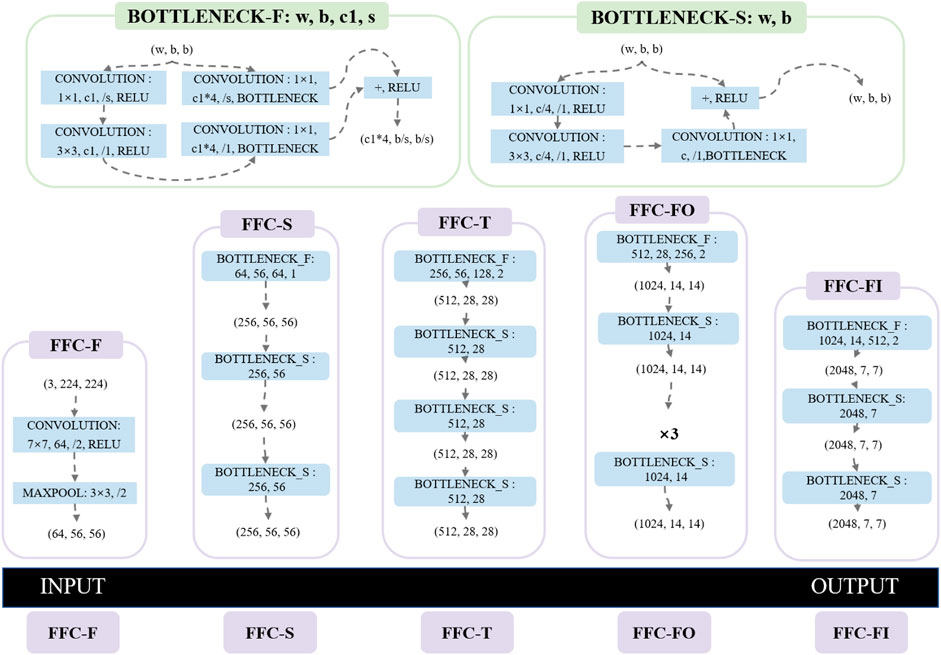
FIGURE 4. Residual Network CNN framework and structured data propagation process.
Bottleneck is divided into Bottleneck-F and Bottleneck-S, the input channel is equal to output channel in Bottleneck-S, the input channel is unequal to output channel in Bottleneck-F. Bottleneck-F has four variable parameters, including the number of input channels
The convolution layer enables the forward propagation process of input samples and the backward propagation process of parameter estimation. The forward propagation of the convolution process starts when the samples
After the convolution MSLSDA is constructed, the parameters can be estimated from back to front by the gradient descent strategy and the chain derivation rule, as shown in Eq. 6.
Max-Pooling Layer and Fully Connected Layer Settings
The max-pooling layer enables the dimensionality reduction of structured data, greatly reducing the number of parameters while retaining the main features, as shown in Eq. 7.
Where
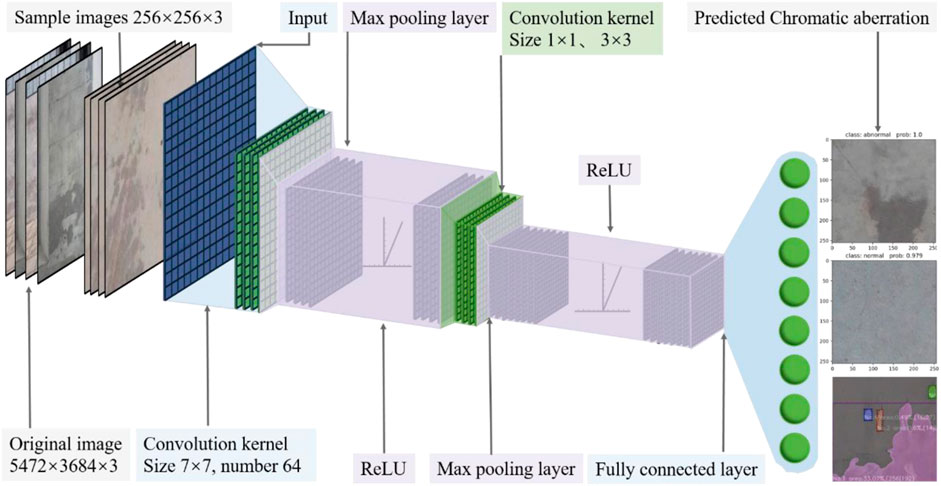
FIGURE 5. Training process of FFC chromatic aberration experimental data in MSLSDA network.
Hyperparameter Optimization
The system environment configuration for the workstation includes Python 3.7, Pytorch 1.7.1 and Anaconda3-5.3.1. Write training code, validation code, prediction code and algorithm code for MSLSDA via PyCharm. The MSLSDA uses a joint training strategy with a full training process of 230 epochs, including 30 epochs to tune the algorithm network head, 30 epochs to optimize the Batch Size hyperparameters, 80 epochs to optimize the learning rate (LR) hyperparameters, 40 epochs to optimize the Epoch hyperparameters, 20 epochs to train the test set, and 30 epochs to train the generalized prediction set and evaluate the MSLSDA generalization capability.
Hyperparameters including LR, Batch Size, Epoch, number of hidden layers, number of neurons and ReLU can control and influence the final parameters
Batch Size is the total number of structured sample data contained in a batch. Due to the large amount of data in the FFC chromatic aberration dataset, the dataset is divided into multiple batches to pass the algorithm in order. Since the larger Batch Size value is, the higher GPU performance is required, and the value is an integer multiple of 8 (Dong et al., 2021). Therefore, the experiments set the Batch Size values to 1, 8, 16, 24, 32, 40, 48, 56, and 64 based on the actual workstation configuration. To ensure the reliability of the Batch Size hyperparameter optimization, the LR uniformly set to 0.001 and Epoch uniformly set to 50. Each Batch Size generates a different number of weight files during training, and each weight file contains information on the loss function value, Epoch, and the weight value. To avoid duplicate recording of the same weight file, the basis for weight file generation is encoded as an increase in verification accuracy (Val_acc). The relationship between the Epoch, Val_acc and Batch Size is depicted in Figure 6. The results show that only one Val_acc peak for different Batch Size within a finite epoch. The weight file corresponding to the Val_acc peak point is the optimal weight file under each Batch Size. For a more visual representation of the Val_acc sensitivity to different Batch Size, Table 3 shows the statistical data.
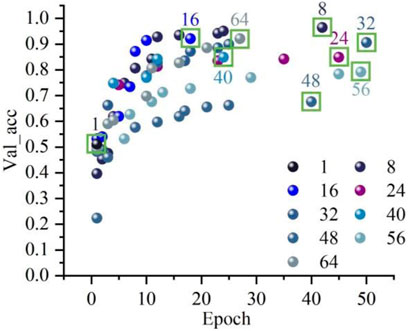
FIGURE 6. The Val_acc optimization process with fixed Batch Size.
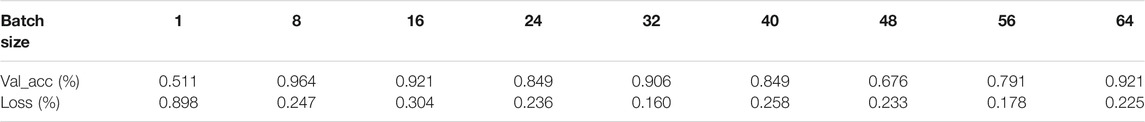
TABLE 3. Batch Size optimization process with different loss function values.
Since the number of Batch Size_1 datasets is equal to the number of experimental sample images in the training set, Val_acc does not converge in the range of 50 epochs, as in Figure 7. As the predicted probability of the validation set deviates from the actual labels, the loss function gradually increases. Therefore, the loss function value 0.160 corresponding to Batch Size_32 shows a high match between the predicted probability and the actual label.
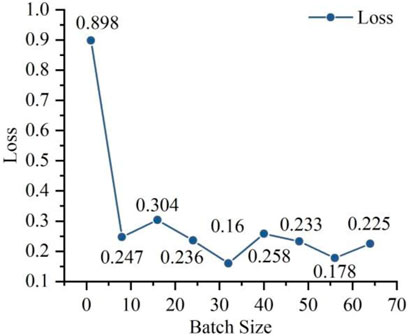
FIGURE 7. The loss function optimization process with fixed Batch Size.
The LR affects the convergence speed of structured data algorithms to regional minima. A suitable LR enables the algorithm to descend in the largest gradient direction with suitable step, and the LR value can be effectively optimized by the descending gradient of the loss function. In this manuscript, the LR range from 10−6.0 to 10−1.0, and the LR values are set sequentially in step of 10−0.2 (Mayr et al., 2018). The Batch Size follows the optimal solution of the previous experiment three2 and the Epoch is set to 100, because the optimization of the LR needs to be performed when the loss function converges. Figure 8 shows the convergence of the loss function for all LR values. The loss function curves with LR values in the range of 10−3.2 to 10−1.0 are initially agitated due to excessive LR values. When the LR takes the value of 10−3.6, the loss function decreases significantly faster than the other curves in the early stage, and it cannot be converged in the later stage due to the large LR. Although the loss functions with LR taking values of 10−3.4 and 10−3.8 converge in the later stages, there are clearly multiple oscillation points in the earlier stages. The loss function converges to larger values for LR ranging from 10−4.2 to 10−6.0, because of the small LR. The loss function with LR taking the value of 10−4.0 shows a uniform sliding decline. It means that the learning performance is better in less time.
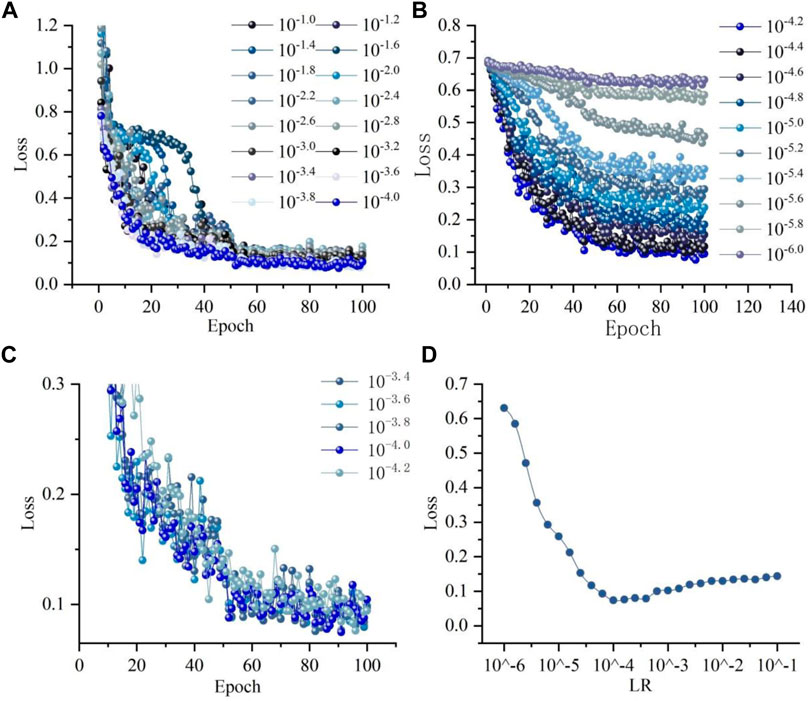
FIGURE 8. MSLSDA LR optimization results of FFC chromatic aberration experimental data: (A) Experimental results before optimal LR (B) Experimental results after optimal LR (C) Experimental results near optimal LR (D) Optimization process of LR versus loss function on logarithmic scale.
Figure 8 plots the optimization process of LR versus loss function on logarithmic scale, and it shows the effect of LR on loss function convergence speed. The LR takes values from 10−6.0 to 10−1.0 asymptotically, and the loss function value stops decreasing and slowly increases at 10−4.0. With a fixed Epoch of 100, a small LR can slow down the training process by a factor proportional to the amount of LR reduction. This typical relationship between the training loss and the LR is expressed as an increasing trend of the loss function value when the LR is greater than the optimal value, and a decreasing trend vice versa. Therefore, the optimal LR in this study takes the value of 10−4.0.
The epoch indicates all batches of single training process in forward and backward propagation. In each epoch, all samples of the training set participating in training process. After each epoch, all the sample data need to be shuffled to the next epoch. In the Residual Network CNN framework, several epochs are performed to update the weight parameters of the structured data algorithm using a limited number of data and gradient descent. In order to find suitable epoch for the FFC chromatic aberration dataset, the epoch is set to 2000, the LR and Batch Size follow 10−4.0 and 32 from the previous experiment. The results of the loss, Val_acc, recall and F1 parameters are shown in Figure 9.
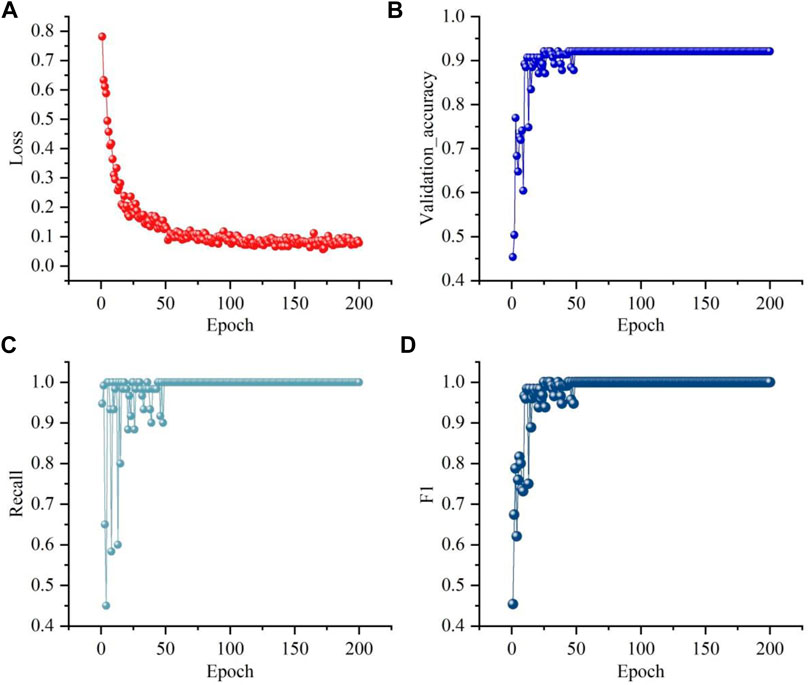
FIGURE 9. The indices of optimized MSLSDA model for FFC chromatic aberration experimental data: (A) Experimental results of loss (B) Experimental results of Val_acc (C) Experimental results of recall (D) Experimental results of F1.
A key metric for deep learning is to compare the gap between the learning results and the actual sample labels. During the whole training process, the loss function value starts to converge around 100 epochs, and reaches the minimum value of 0.061 for the first time in the whole learning process at the 755th epoch, and the Val_acc has converged to 0.921 at this time. Recall is the ratio of correctly identified number as chromatic samples in the validation set to all chromatic samples number in the validation set. As the epoch increases, recall finally converges to 0.990, which indicates that the MSLSDA has positive identification performance on the validation set. The equilibrium mean F1 integrates the calculation results of precision and recall, and the F1 value finally converges to 0.990 in the experiment, which indicates that this MSLSDA has positive accuracy in FFC surface CAI.
The traditional method of FFC surface CAI is observed by human eyes, which is subjective. Therefore, it is not easy to judge the chromatic aberration in Figure 10A by the human eyes. The coordinate axes of the sample images are in px. Compared with the traditional method, the FFC surface CAI method in this study can objectively identification chromatic aberration that are not easily judged by the human eyes, as shown in Figure 10B.
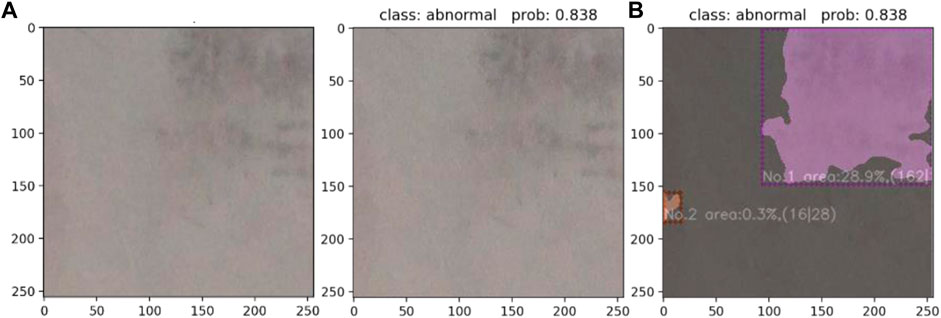
FIGURE 10. Prediction and quantification results for mild chromatic aberration: (A) Original image (B) Prediction and quantification results.
FFC Chromatic Aberration Generalization Analysis
In order to test the generalization ability of the MSLSDA for FFC surface CAI, 474 sample images of sub-sample buildings are performed full-sample identification. The output sample images include light color without chromatic aberration (LW) output, dark color without chromatic aberration (DW) output, light color complete chromatic aberration (LCC) output, light color incomplete chromatic aberration (LIC) output, dark color complete chromatic aberration (DCC) output and dark color incomplete chromatic aberration (DIC) output, as shown in Figure 11. The first index is the result of CAI, abnomal indicates chromatic aberration in sample image and nomal indicates uniform color of the sample image. The second index indicates the probability value prod of the target dimension, which illustrates the confidence of the CAI results.
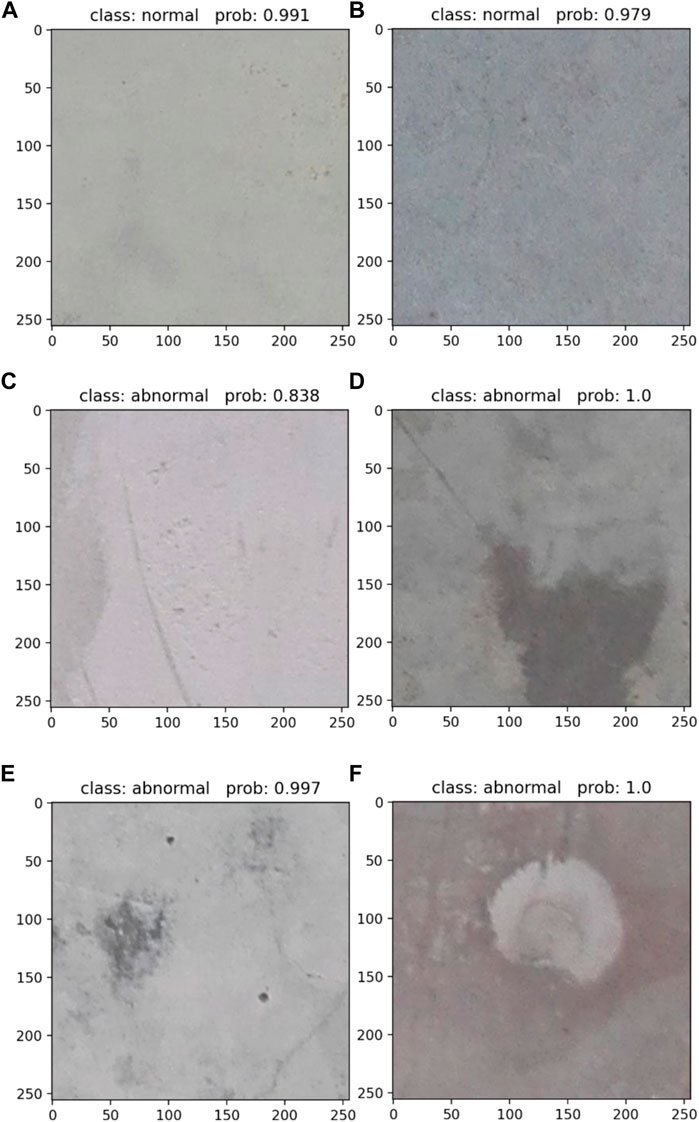
FIGURE 11. Prediction results of different FFC chromatic aberration defects categories: (A) Light color without chromatic aberration output (B) Dark color without chromatic aberration output (C) Light color incomplete chromatic aberration output (D) Dark color incomplete chromatic aberration output (E) Light color complete chromatic aberration output (F) Dark color complete chromatic aberration output.
The generalized prediction set contains four defect categories of light FFC, dark FFC, complete chromatic aberration and incomplete chromatic aberration. And it contains four comprehensive defect categories of LCC sample images, DCC sample images, LIC sample images and DIC sample images, but the MSLSDA is still able to accomplish the CAI task. The two indexes show positive performance of FFC surface CAI. To represent the results of the generalization prediction experiments, the confidence data for the chromatic aberration and without chromatic aberration samples are labeled in Figure 12. It can be seen that the confidence range of the generalized prediction samples with chromatic aberration is almost between 0.88 and 1.00, and the confidence range of the generalized prediction samples without chromatic aberration is almost between 0.86 and 1.00. The accuracy of the chromatic aberration generalization prediction reaches 99.6%, which reflects the positive generalization prediction ability of the MSLSDA.
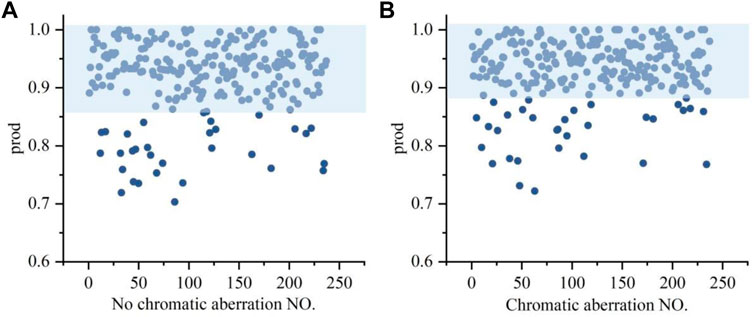
FIGURE 12. Generalization prediction prod statistics results of FFC chromatic aberration experimental data: (A) No chromatic aberration prod (B) Chromatic aberration prod.
Quantification of Chromatic Aberration in FFC
Through color space conversion, histogram equalization, image color recognition, image noise reduction and image mask operation, the multi-scale feature fusion of structured data is realized. The boundary features, geometric parameter features (length and width) and chromatic aberration ratio features of structured data are identified, as shown in Figure 13.
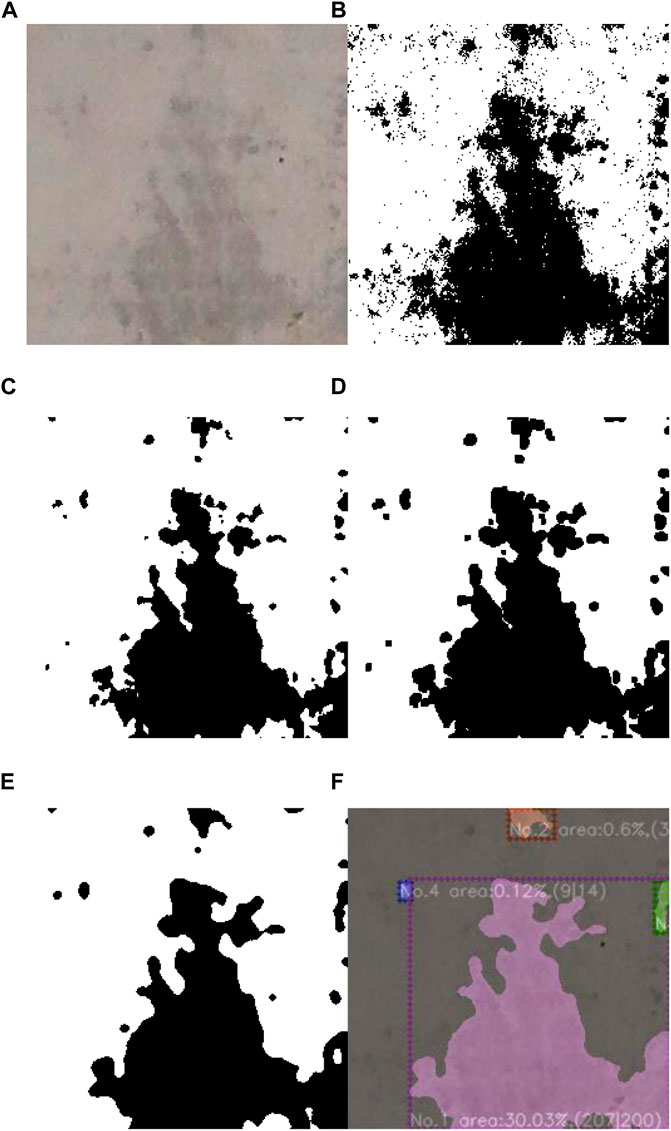
FIGURE 13. Quantification process of FFC chromatic aberration experimental data: (A) Input (B) Color space recognition (C) Median filter noise reduction (D) Data open operation (E) Data closure operation (F) Quantitative segmentation.
In order to perform histogram equalization of color sample images, the RGB color space of the structured data (shown in Figure 13A) is converted into an HSV color space that enables efficient image processing. Then the Void InRange function is used to identification whether each pixel point of src image is between lowerb value and upperb value. The pixel points between lowerb value and upperb value are set to 255, and the rest of the pixel points are set to 0. The pixel values are finally saved in the dst image, which gives a binary image corresponding to the target color, as shown in Figure 13B.
To remove the pretzel noise points in the binary image, a median filter method is used, as shown in Figure 13C. To remove the scattered distribution of noisy pixel points from the binary image, an open operation of erosion followed by expansion is used, as shown in Figure 13D. In order to reduce the independence of chromatic aberration areas and enhance the connectivity of individual chromatic aberration blocks, a closed operation of expansion followed by erosion is used, as shown in Figure 13E. In order to extract structural features of chromatic aberration in sample images, similarity variables are used to detect structural features similar to image masks, as shown in Figure 13F.
As can be seen in Figure 14, the sample image can be calculated by the masking algorithm and output the chromatic aberration mask index. The dimensional pixel values of the FFC chromatic aberration are more informative than the millimeter values during the inspection. Therefore, the mask algorithm trained in this manuscript directly outputs the pixel values of the chromatic aberration size. The index contains the chromatic aberration block number, chromatic aberration ratio features and geometric parameter features (length and width), these three parts listed in order from left to right. The chromatic aberration block number is based on chromatic aberration ratio features, and each chromatic aberration block is coded in order from the largest to the smallest, which is helpful for the inspector to quickly determine the largest chromatic aberration block. The chromatic aberration ratio features represent the proportion of a single chromatic aberration to the sample image, and further the total chromatic aberration ratio of the whole sample image can be obtained, which provides an accurate quantitative evaluation basis for inspectors. The geometric parameter features (length and width) are also expressed as pixel values in parentheses at the end of the index, the chromatic aberration block length pixel value on the right and the width pixel value on the left, which provides the inspector with information on the degree of chromatic aberration coverage.
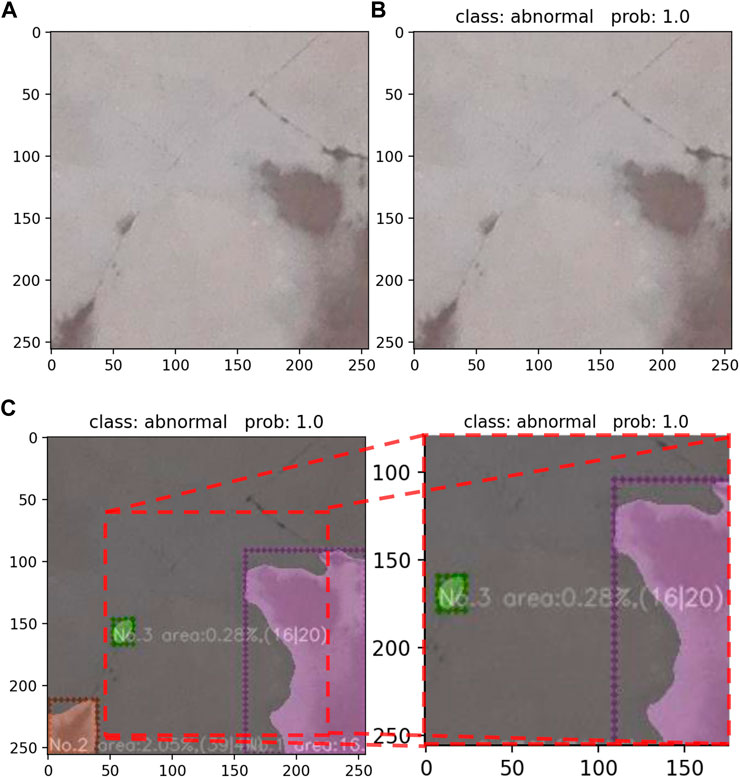
FIGURE 14. Identification and quantification of FFC chromatic aberration experimental data: (A) Input (B) Experimental results of projection (C) Experimental results of quantitative segmentation.
As shown in Figure 15, all chromatic aberration blocks in the figure are identified and quantified. It can be seen that the Residual Network CNN framework and the chromatic aberration mask algorithm have positive identification and quantization performance not only for LCC sample images (shown in Figure 15A), but also for LIC sample images (shown in Figure 15B), DCC sample images (shown in Figure 15C) and DIC sample images (shown in Figure 15 (d)).
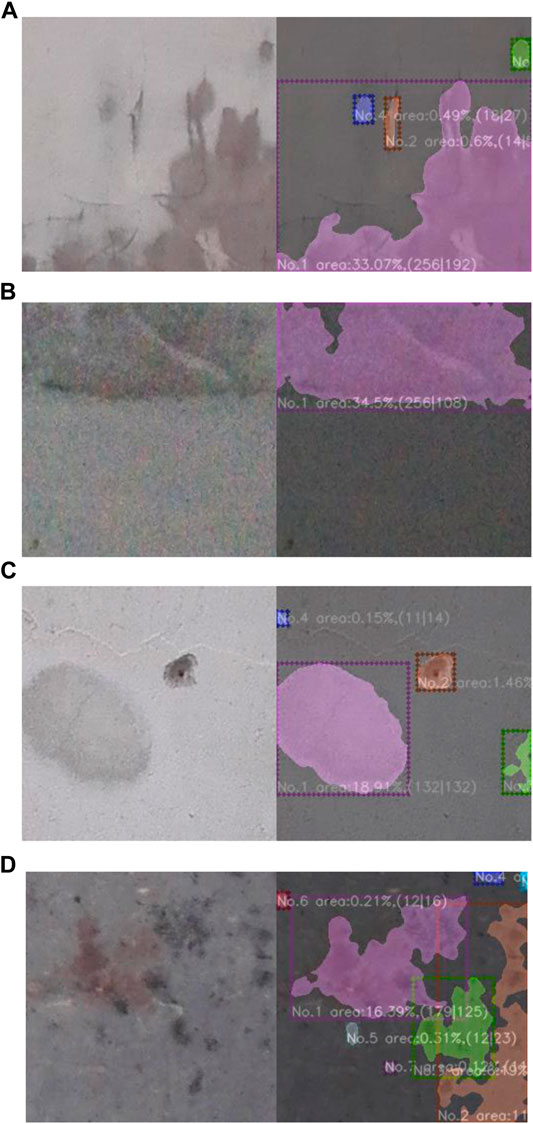
FIGURE 15. Quantification results of different FFC chromatic aberration defect categories: (A) Light color incomplete chromatic aberration input and output (B) Dark color incomplete chromatic aberration input and output (C) Light color complete chromatic aberration input and output (D) Dark color complete chromatic aberration input and output.
In order to illustrate the results of FFC identification and quantification in different states, The information of identification and quantification for different classes of experimental sample images in Figure 15 is listed in Table 4.
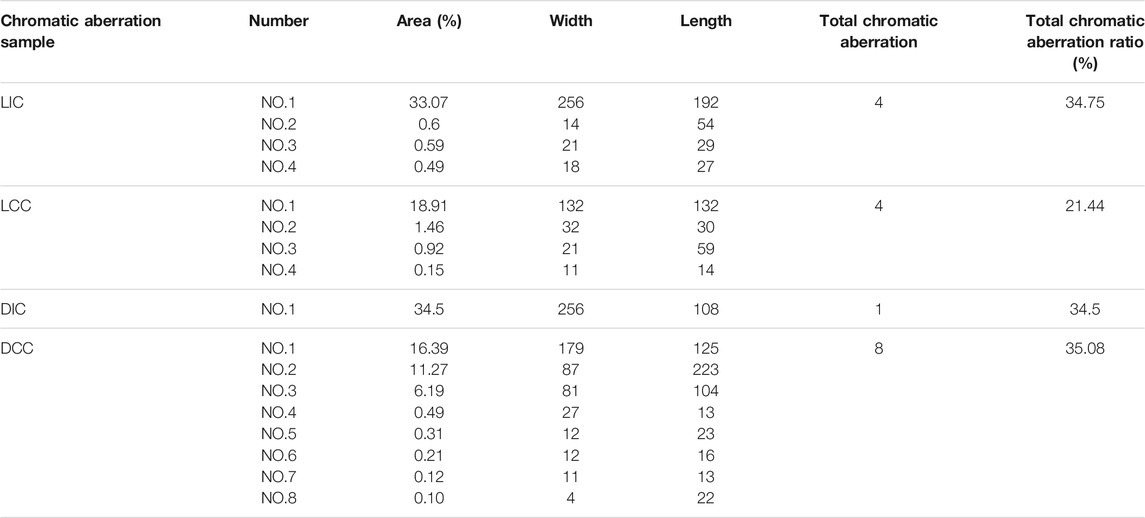
TABLE 4. FFC chromatic aberration data of different defect categories.
The FFC-CADP (shown in Figure 16) implements an automated procedure for identification and quantification of chromatic blocks on the surface image of FFC. The hardware environment for developing platform includes Core I7 8750h, 6 GB of gtx1060 and 16 GB of RAM. The operating system used to develop platform is Windows 10 × 64. The environment used to develop platform is Anaconda3 and Pycharm. To improve the applicability of platform, it is coded to apply to Windows 10 × 64 and ubuntu 18.04 × 64 operating system. The supporting environment for platform operation includs Pytorch 1.7.1, Opencv4, Numpy and Matplotlib. This study builds platform through Python 3.7 programming language.
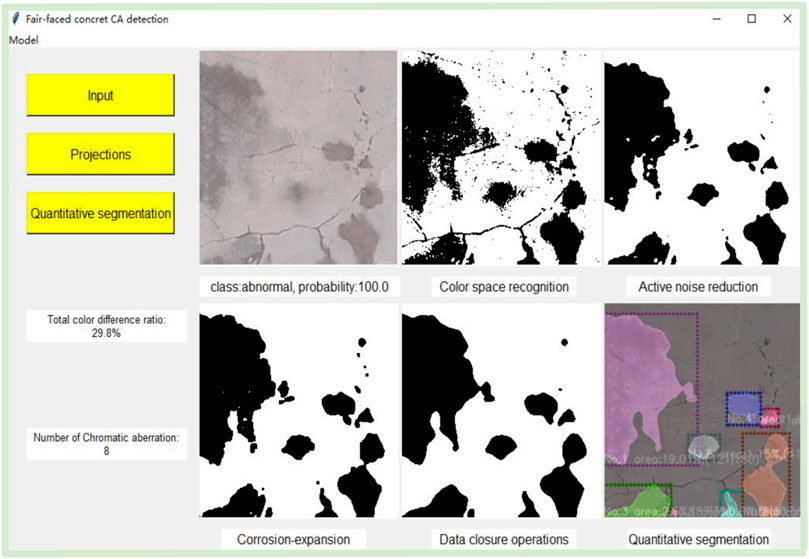
FIGURE 16. FFC chromatic aberration detection platform.
Click the input button to switch the interface to the images folder path, and select the sample images to be identified and quantified to complete the input operation. The sample image after input is displayed in the first output box in the first line for comparison with the quantized output results. Click the projections button, the CAI result and prod will be output below the input sample image. Click the quantitative segmentation button to get color space recognition output, active noise reduction output, corrosion-expansion output, data closure operations output and quantitative segmentation output in sequence. The quantitative segmentation output contains the boundary features, geometric parameter features (length and width), chromatic aberration ratio features, total chromatic aberration ratio and number of chromatic aberration.
Conclusion
According to the actual working environment of FFC inspectors and combined with the demand of FFC surface CAI, the experimental data acquisition method of FFC surface chromatic aberration based on UAV technology is designed. Compared with traditional data acquisition methods, this method can quickly collect sample images in a large area, and reduce the interference factors in image data. Besides it can reduce the risk factor of staff, improve the efficiency and quality of data acquisition.
Based on the optimized MSLSDA, a FFC chromatic aberration identification model is built. The model can complete the quantization of FFC chromatic aberration quickly and accurately, and the quantization accuracy of the target reaches 92.1%.
The FFC-CADP is built to visualize the operation of identification and quantization on the FFC surface sample images. The calculations of the platform include image category return value, prod, boundary features, geometric parameter features (length and width), chromatic aberration ratio features, total chromatic aberration ratio and number of chromatic aberration.
Aiming at the problems of low efficiency and strong subjectivity in the quality inspection of FFC surface CAI, a method based on MSLSDA for FFC surface CAI is proposed. The method achieves the FFC chromatic aberration prediction function by FFC chromatic aberration identification model. The FFC chromatic aberration quantization function achieves by color space conversion, histogram equalization, image color recognition, image noise reduction and image mask operation.
This project will further investigate the performance and generalization prediction ability of different weight structured data algorithms for the FFC chromatic aberration dataset, and obtain the FFC surface CAI models suitable for different application scenarios.
Data Availability Statement
The raw data supporting the conclusions of this article will be made available by the authors, without undue reservation.
Author Contributions
Conceptualization, GY and WS; methodology, WS and YY; software and formal analysis, WS and YY; writing—original draft preparation, WS and YS; review and editing, WS and JZ. All authors have read and agreed to the published version of the manuscript.
Funding
This work was supported by the National Natural Science Foundation of China (51608076, 51808074), the Fundamental Research Funds for the Central Universities (2020CDJQY-A067).
Conflict of Interest
The authors declare that the research was conducted in the absence of any commercial or financial relationships that could be construed as a potential conflict of interest.
Publisher’s Note
All claims expressed in this article are solely those of the authors and do not necessarily represent those of their affiliated organizations, or those of the publisher, the editors and the reviewers. Any product that may be evaluated in this article, or claim that may be made by its manufacturer, is not guaranteed or endorsed by the publisher.
References
Abouhamad, M., Dawood, T., Jabri, A., Alsharqawi, M., and Zayed, T. (2017). Corrosiveness Mapping of Bridge Decks Using Image-Based Analysis of Gpr Data. Automation in Construction 80, 104–117. doi:10.1016/j.autcon.2017.03.004
Ajtayné Károlyfi, K., and Papp, F. (2021). Laboratory Study of the Effect of Saturation Degree on Quality of Fair-Faced concrete Surfaces. Epitoanyag - JSBCM 73, 115–118. doi:10.14382/epitoanyag-jsbcm.2021.17
Cha, Y.-J., Choi, W., and Büyüköztürk, O. (2017). Deep Learning-Based Crack Damage Detection Using Convolutional Neural Networks. Computer-Aided Civil Infrastructure Eng. 32, 361–378. doi:10.1111/mice.12263
Chang, H. L., Jin, Z. Q., Wang, P. G., Wang, J. H., and Liu, J. (2021). Comprehensive Resistance of Fair-Faced concrete Suffering from Sulfate Attack under marine Environments. Construction Building Mater. 277, 122312. doi:10.1016/j.conbuildmat.2021.122312
Chen, M., Tang, Y., Zou, X., Huang, K., Li, L., and He, Y. (2019). High-Accuracy Multi-Camera Reconstruction Enhanced by Adaptive Point Cloud Correction Algorithm. Opt. Lasers Eng. 122, 170–183. doi:10.1016/j.optlaseng.2019.06.011
Coburn, A., Kardan, O., Kotabe, H., Steinberg, J., Hout, M. C., Robbins, A., et al. (2019). Psychological Responses to Natural Patterns in Architecture. J. Environ. Psychol. 62, 133–145. doi:10.1016/j.jenvp.2019.02.007
Dong, X., Shen, J., Wang, W., Shao, L., Ling, H., and Porikli, F. (2021). Dynamical Hyperparameter Optimization via Deep Reinforcement Learning in Tracking. IEEE Trans. Pattern Anal. Mach. Intell. 43, 1515–1529. doi:10.1109/TPAMI.2019.2956703
Feng, W., Wang, Y., Sun, J., Tang, Y., Wu, D., Jiang, Z., et al. (2022). Prediction of Thermo-Mechanical Properties of Rubber-Modified Recycled Aggregate concrete. Construction Building Mater. 318, 125970. doi:10.1016/j.conbuildmat.2021.125970
Kang, D., and Cha, Y.-J. (2018). Autonomous Uavs for Structural Health Monitoring Using Deep Learning and an Ultrasonic beacon System with Geo-Tagging. Computer-Aided Civil Infrastructure Eng. 33, 885–902. doi:10.1111/mice.12375
Li, D., Liu, J., Feng, L., Zhou, Y., Liu, P., and Chen, Y. F. (2020). Terrestrial Laser Scanning Assisted Flatness Quality Assessment for Two Different Types of concrete Surfaces. Measurement 154, 107436. doi:10.1016/j.measurement.2019.107436
Liu, B., and Yang, T. (2017). Image Analysis for Detection of Bugholes on Concrete Surface. Construction Building Mater. 137, 432–440. doi:10.1016/j.conbuildmat.2017.01.098
Liu, J., Li, D., Feng, L., Liu, P., and Wu, W. (2019). Towards Automatic Segmentation and Recognition of Multiple Precast concrete Elements in Outdoor Laser Scan Data. Remote Sensing 11, 1383. doi:10.3390/rs11111383
Mayr, A., Klambauer, G., Unterthiner, T., Steijaert, M., Wegner, J. K., Ceulemans, H., et al. (2018). Large-Scale Comparison of Machine Learning Methods for Drug Target Prediction on Chembl. Chem. Sci. 9, 5441–5451. doi:10.1039/c8sc00148k
Miranda, J., Valença, J., Costa, H., and Júlio, E. (2020). Chromatic Design and Application of Restoration Mortars on Smooth Surfaces of white and GRAY concrete. Struct. Concrete 22, E535–E548. doi:10.1002/suco.202000054
Mohammed, A., Rafiq, S., Sihag, P., Kurda, R., and Mahmood, W. (2021). Soft Computing Techniques: Systematic Multiscale Models to Predict the Compressive Strength of Hvfa concrete Based on Mix Proportions and Curing Times. J. Building Eng. 33, 101851. doi:10.1016/j.jobe.2020.101851
Mohan, A., and Poobal, S. (2018). Crack Detection Using Image Processing: A Critical Review and Analysis. Alexandria Eng. J. 57, 787–798. doi:10.1016/j.aej.2017.01.020
Payab, M., and Khanzadi, M. (2021). State of the Art and a New Methodology Based on Multi-Agent Fuzzy System for concrete Crack Detection and Type Classification. Arch. Computat Methods Eng. 28, 2509–2542. doi:10.1007/s11831-020-09465-7
Payab, M., Abbasina, R., and Khanzadi, M. (2019). A Brief Review and a New Graph-Based Image Analysis for Concrete Crack Quantification. Arch. Computat Methods Eng. 26, 347–365. doi:10.1007/s11831-018-9263-6
Piferi, C. (2018). Materials and Innovative Methodologies for Restoring Fair Faced Concrete. Techne-J. Technol. Architecture Environ. 16, 258–269. doi:10.13128/Techne-23013
Prasanna, P., Dana, K. J., Gucunski, N., Basily, B. B., La, H. M., Lim, R. S., et al. (2016). Automated Crack Detection on concrete Bridges. IEEE Trans. Automat. Sci. Eng. 13, 591–599. doi:10.1109/TASE.2014.2354314
Ribeiro, C. M., and Xavier, D. J. (2019). The Revealing Role of Modern Religious Architecture in Sao Paulo: Fair-Faced concrete Finish in Religious Architecture and its Symbology of the Sacred. Rever 19, 25–41. doi:10.23925/1677-1222.2018vol19i1a3
Scalbi, A., Olmi, R., and Inglese, G. (2019). Evaluation of Fractures in a Concrete Slab by Means of Laser-Spot Thermography. Int. J. Heat Mass Transfer 141, 282–293. doi:10.1016/j.ijheatmasstransfer.2019.06.082
Shyha, I., Richardson, A., Coventry, K., and Ponton, H. (2016). Mould Release Technologies with Regard to Concrete Surface Finish. Mag. Concrete Res. 68, 87–98. doi:10.1680/macr.15.00067
Siebert, S., and Teizer, J. (2014). Mobile 3d Mapping for Surveying Earthwork Projects Using an Unmanned Aerial Vehicle (Uav) System. Automation in Construction 41, 1–14. doi:10.1016/j.autcon.2014.01.004
Strehlein, D., and Schiessl, P. (2008). Dark Discoloration of Fair-Face Concrete Surfaces-Transport and Crystallization in Hardening Concrete. J. Adv. Concrete Technol. 6, 409–418. doi:10.3151/jact.6.409
Tang, Y., Li, L., Wang, C., Chen, M., Feng, W., Zou, X., et al. (2019). Real-Time Detection of Surface Deformation and Strain in Recycled Aggregate Concrete-Filled Steel Tubular Columns via Four-Ocular Vision. Robot. Comput. Integr. Manuf. 59, 36–46. doi:10.1016/j.rcim.2019.03.001
Wu, M., Xiong, X., Shen, W., Huo, X., Xu, G., Zhang, B., et al. (2021). Material Design and Engineering Application of Fair-Faced Self-Compacting concrete. Construction Building Mater. 300, 123992. doi:10.1016/j.conbuildmat.2021.123992
Yao, G., Sun, Y., Wong, M., and Lv, X. (2021). A Real-Time Detection Method for Concrete Surface Cracks Based on Improved Yolov4. Symmetry 13, 1716. doi:10.3390/sym13091716
Yoshitake, I., Maeda, T., and Hieda, M. (2018). Image Analysis for the Detection and Quantification of concrete Bugholes in a Tunnel Lining. Case Stud. Construction Mater. 8, 116–130. doi:10.1016/j.cscm.2018.01.002
Keywords: multi-scale feature fusion, structured data algorithm, fair-faced concrete chromatic aberration, algorithm hyperparameter optimization, lightweight algorithm
Citation: Yao G, Sun W, Yang Y, Sun Y, Xu L and Zhou J (2022) Chromatic Aberration Identification of Fair-Faced Concrete Research Based on Multi-Scale Lightweight Structured Data Algorithm. Front. Mater. 9:851555. doi: 10.3389/fmats.2022.851555
Received: 10 January 2022; Accepted: 08 February 2022;
Published: 11 March 2022.
Edited by:
Fangying Wang, University of Nottingham, United KingdomCopyright © 2022 Yao, Sun, Yang, Sun, Xu and Zhou. This is an open-access article distributed under the terms of the Creative Commons Attribution License (CC BY). The use, distribution or reproduction in other forums is permitted, provided the original author(s) and the copyright owner(s) are credited and that the original publication in this journal is cited, in accordance with accepted academic practice. No use, distribution or reproduction is permitted which does not comply with these terms.
*Correspondence: Yang Yang, MjAxMjE2MDEwMDlAY3F1LmVkdS5jbg==