 Jinlong Guo
 Guoping Jiang1
 Zhengyu Wu
 An He
An He
94% of researchers rate our articles as excellent or good
Learn more about the work of our research integrity team to safeguard the quality of each article we publish.
Find out more
ORIGINAL RESEARCH article
Front. Mater., 14 March 2022
Sec. Structural Materials
Volume 9 - 2022 | https://doi.org/10.3389/fmats.2022.851301
This article is part of the Research TopicAdvanced Concretes and Their Structural ApplicationsView all 23 articles
During the period of service, the infrastructure is subjected to various forms of impact. To investigate the impact responses of a reinforced concrete (RC) beam, a numerical model of the RC beam under impact was developed by the finite element package LS-DYNA in this study. The numerical model was verified by using the drop hammer test on the RC beam. Using the numerical model, the midspan displacement of the RC beam is analyzed under the interaction of impact mass and impact velocity. The results show that the response surface of midspan displacement can be fitted as a binary power function of impact mass and impact velocity. The midspan displacement under various impact conditions with equal impulse or equal impact energy is different. Within the scope of a low-speed impact, the midspan displacement decreases with an increase in the impact mass under the equal impulse, while it increases with an increase in the impact mass under the equal impact energy. In addition, the impact failure of the RC beam is judged by the deformation criterion. The threshold value of the ductility coefficient is recommended to be set as 15 in the impact-resistant design for RC beams in civil engineering structures within the scope of a low-speed impact.
Compared with the static load, an impact releases a large amount of energy in a short period time, which often results in serious damage to structures. In recent years, dynamic responses of reinforced concrete (RC) members under impact have drawn much more attention. Some researchers have used the drop hammer device or the lateral impact device to carry out impact tests on reinforced concrete members (Fujikake et al., 2009; Sha and Hao, 2013; Zhao et al., 2017; Ye et al., 2021), and other researchers have used numerical simulation methods to carry out impact analysis on reinforced concrete members (Cai et al., 2017; Saleh et al., 2019; He et al., 2020; Tran et al., 2021). Several impact tests have primarily been performed to study the dynamic responses of RC beams under impact. Tachibana et al. (2010) carried out a drop hammer test on eight RC beams to investigate the influence of various beam spans, cross-sectional dimensions, and reinforcement ratios with characteristic values like the impact force and the energy absorbed by the beams. Zeng and Xu (2012), Xu and Zeng (2014) carried out a drop hammer test on six RC beams to investigate the effects of different impact masses and initial impact velocities on the dynamic responses. Some basic results have been obtained in these research studies, and the impact force is the main analysis content of the dynamic response. The impact force versus displacement curves are always analyzed to obtain the energy absorption of the RC members, and the peak impact force or the peak reaction force caused by the impact force is considered as the bearing capacity for the impact design of RC beams. However, these views would not be appropriate for RC members under impact. Ohnuma (1987) found that the peak impact force is considerably larger than the ultimate static bearing capacity of RC beams. From this result, we may deduce that the cross section would be unusually large if the impact force is taken as the design value. The reason may be that the inertial effect on the RC beam is significant, and a large portion of the impact force is applied to accelerate the beam and overcome the inertial force (Guo et al., 2017). In addition, the drop hammer test on 10 RC beams conducted by Soleimani et al. (2007) showed a time lag between the peak impact force and the peak support reaction, which means the force-based structural impact design is not suitable, and the peak impact force or the peak reaction force may not be directly used as the bearing capacity for the impact design of RC beams. Comparatively, a displacement-based design could be suitable for the impact design. Furthermore, the existing studies almost consider the effects of impact mass and impact velocity on dynamic responses of RC beams independently. Therefore, it is of great significance to further analyze the impact responses of RC beams under the interaction of impact mass and impact velocity. A more reasonable failure criterion of the RC beam under impact is necessary, instead of the bearing force.
A displacement-based design is an effective design method, especially when the structure has large deformation. In this study, the displacement response of RC beams under impact, which provides a theoretical basis for the displacement-based structural impact design, is mainly analyzed under the interaction of impact mass and impact velocity. In order to achieve it, a numerical model is developed by the finite element package LS-DYNA. The numerical model is calibrated with the testing results of the drop hammer impact on the RC beam specimen. Using the calibrated numerical model, the midspan displacement of RC beams under equal impulse or equal impact energy, in which the impact condition, the impact mass, and impact velocity are varied simultaneously, is analyzed. In addition, the failure of RC beam is judged according to the deformation criterion.
In the drop hammer impact test on the RC beam conducted by the authors, the beam specimen had 1,800 mm length, with a cross section of 250 mm in depth and 150 mm in width. As shown in Figure 1, the longitudinal reinforcements at both top and bottom sides were 16 mm, with the yield strength of 430 MPa and the ultimate strength of 578 MPa. The thickness of the longitudinal reinforcement protection layer was 35 mm, and the reinforcement ratio was 1.25%. The 10-mm bars spaced at 100 mm apart with the yield strength of 407 MPa and the ultimate strength of 594 MPa were used as stirrups. The stirrup reinforcement ratio was 1.05%. To avoid the measurement error caused by the concrete spalling, a flat steel plate with a size of 5 × 50×150 was welded on the steel cage at the bottom of the midspan to measure the displacement response. The hinge supports were arranged at both ends of the beam. Each support was composed of an upper cover plate, a lower bottom plate, and two pull rods between them, and the beam was clamped between the upper and lower plates. The beam specimen was impacted at the midspan by the impact mass, m, of 400 kg and the impact velocity, v, of 6 m/s.
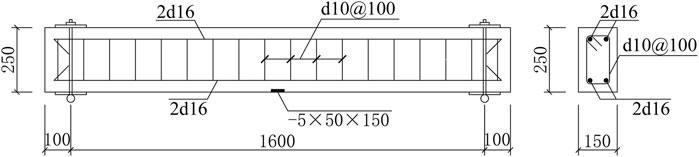
FIGURE 1. Specimen dimensions and reinforcement layout of the beam (mm).
A 3D numerical model of the RC beam is developed by the finite element package LS-DYNA to simulate the drop hammer impact test. To save the calculation cost, only half of the midspan symmetry specimen is established, and the span displacement of the node on the symmetric plane is constrained. As shown in Figure 2, the model is mirrored by the midspan plane.
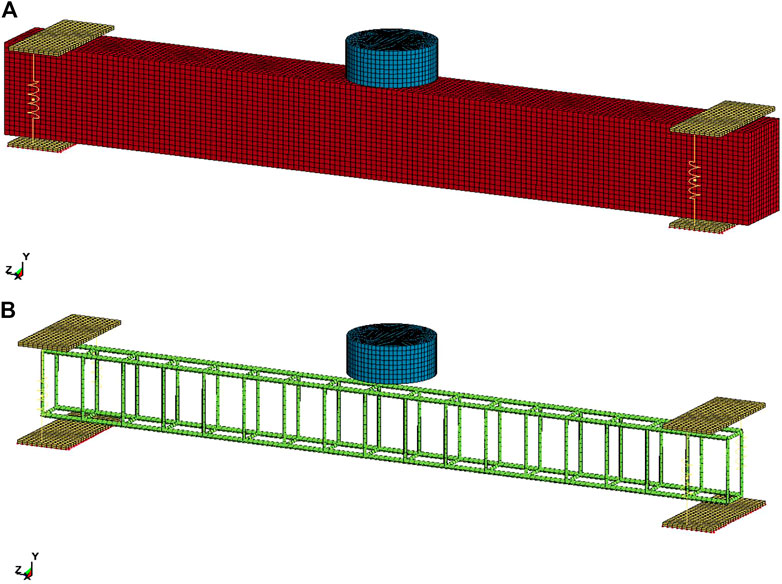
FIGURE 2. 3-D numerical model of RC beam.
The model consists of concrete, a reinforcement cage, a hinged support, and a drop hammer. The concrete is discretized into eight-node solid elements with one-point Gauss integration and viscous hourglass control. The longitudinal and transverse reinforcement bars are discretized into truss elements. The perfect bond between reinforcement and adjacent concrete is assumed, and common nodes are defined between the reinforcement elements and the concrete elements. Because of their small thickness, the upper and lower plates of the hinged supports are discretized into eight-node solid elements with complete integration to avoid the hourglass model. The pull rods are modeled by two-node discrete spring elements. The drop hammer is simplified and modeled as a cylinder, and the eight-node constant stress solid element is used to model it.
The material model plays an essential role when undertaking non-linear finite element analysis. A number of material models available in LS-DYNA can be used to model the behavior of the concrete material, of which the continuous surface cap model is commonly used in the analysis of concrete structures under low-speed impact. Both elastic deformation and failure of concrete used in structures when involved in a collision with an impactor have been implemented into the CSCM model (Murry, 2007). In this study, the CSCM model with a strain rate effect is used to predict the concrete performance. The dynamic compressive strength fd can be expressed as follows:
where fs is the unconfined static compression strength, E is the elastic modulus,
In the previous equation,
Ductile damage, d (τc), and brittle damage, d (τt), are introduced into the CSCM model to simulate the damage of a concrete element. Ductile damage accumulates when the pressure is compressive, which is defined as follows:
where the parameters A and B set the shape of the softening curve plotted as stress–displacement or stress–strain, dmax is the maximum damage level, and τc is an energy-type term, which is defined as follows:
where σij and εij are the elasto-plastic stresses and strain. Ductile damage initiates when τd exceeds the initial threshold τ0c.
Brittle damage accumulates when the pressure is tensile, which is defined as follows:
where the parameters C and D set the shape of the softening curve; energy-type term τt accumulation depends on the maximum principal strain, εmax, as follows:
The concrete element erodes when the damage parameter d > 0.99, which means it loses all its strength and stiffness. The detailed parameters of the CSCM model are shown in Table 1.
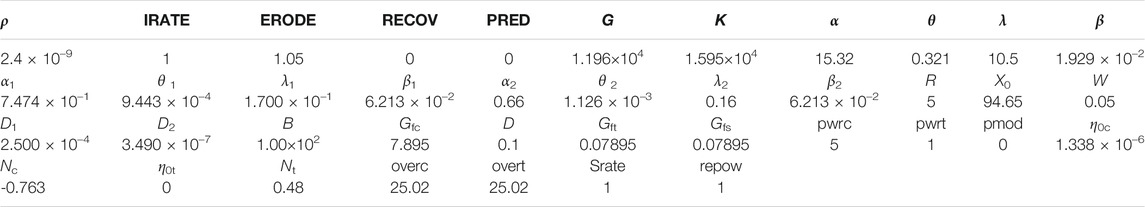
TABLE 1. Material parameters for concrete.
The elastic–plastic model with kinematic hardening is employed for the reinforcement. The plastic hardening modulus is assumed as 1% of the elastic modulus, which is 2.1 × 10⁵ MPa. The Poisson ratio is 0.3. The strain rate effect is taken into account by using the Cowper–Symonds model with the parameters given as C = 40 and p = 5 (Cowper and Symonds, 1957). Thus, the yield stress of reinforcement can be expressed as follows:
where σ0 is the initial yield stress and
The strain failure criterion is adopted to simulate the failure of reinforcement elements. It means the reinforcement element erodes when it exceeds the strain threshold value, εf, which is taken as 0.1 according to the percentage elongation of this material.
The elastic model with elastic modulus 2.1 × 10⁵ MPa is employed for the upper and lower plates of hinged support. The elastic spring model is employed for the pull rod between the upper and lower plates. Based on the geometry dimension of the pull rod with 18 mm in the cross-sectional diameter and 250 mm in length, the elastic stiffness of the spring is taken as follows:
The drop hammer is assumed as a rigid body due to its much higher stiffness than the beam specimen, and the total mass of the drop hammer is 400 kg by controlling its density in the numerical simulation.
Considering the form of hinged support, all the nodes at the bottom of the lower plate are bound to the point 45 mm directly below the bottom side by using a NODAL_RIGID_BODY constraint. The point is located at the midpoint of the central axis of the bolt passing through the ear plate, as shown in Figure 3.
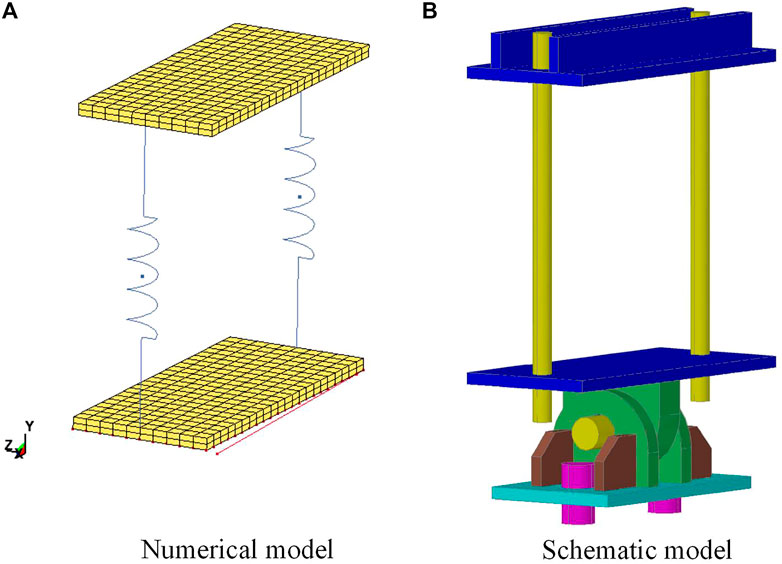
FIGURE 3. Model of hinged support.
The automatic surface-to-surface contact with the default setting of the parameters, based on the penalty method, is employed to simulate the contacts between the beam specimen and the cover plates of the hinged support, and between the drop hammer and the beam specimen. The beam is defined as a slave segment, and the cover plates and the drop hammer are defined as a master segment, respectively. No friction is assumed in the contact between the slave and master segments. The impact velocity of the drop hammer is taken as 6 m/s, and the initial distance between the drop hammer and the top surface of the beams is set as 10 mm to save computational cost. The hourglass mode is controlled by the Flanagan–Belytschko stiffness form.
The explicit integration method based on the central difference method is used to solve the motion equation of the structure. Considering the central difference method is conditionally stable, the time step should be smaller than the critical step, and the critical step of the model is as follows:
where C is the stress wave velocity of the element, which depends on the material properties of the element, and l is the geometric size of the element, that is, the minimum height for the 8-node element and the length for the two-node element. It can be seen that if the model mesh is too fine and the value of l is small, the model critical step length Δt will be reduced, thereby increasing the computational cost. If the mesh of the model is too thick, it may cause the model stiffness to be too large, and the simulation result would be seriously inconsistent with the actual.
For the beam specimen, a mesh convergence test is carried out by reducing the mesh size. Three element sizes of 25 mm, 12.5 mm, and 10 mm are used in the main region of the concrete and reinforcement. The mesh convergence test results are listed as 56.5, 64.2, and 64.2 mm of the peak midspan displacement, correspondingly. It can be found that the results of midspan displacement for element sizes of 12.5 and 10 mm are quite close. Furthermore, element refinement will not improve the accuracy significantly, while the computational efficiency will largely decrease. Therefore, the optimum element size of 12.5 mm is adopted as the main element size in this study. In total, the total semi-structural model consists of 21,232 solid elements, 632 truss elements, and two discrete spring elements.
To verify the numerical model, the damage pattern of the beam specimen under the drop hammer test is compared with the numerical result. The test result is shown in Figure 4A. The cracks of the beam are concentrated in the middle of the span, and the bending cracks in the middle of the span are well developed and close to the top of the beam. Obvious shear cracks are developed near the center of the span, and a local concrete crashing occurs on the upper surface of the beam, which is in contact with the drop hammer. The simulation failure mode is shown in Figure 4B. The numerical contour plots are indicated by the damage level ranging from 0 to 1. Flexural failure for the specimen is observed, and the eroded concrete element is mainly concentrated in the midspan of the beam, and results in vertical and oblique cracks at the bottom of the beam and local damage at the top. The numerical model can simulate the damage pattern of the beam under impact accurately.
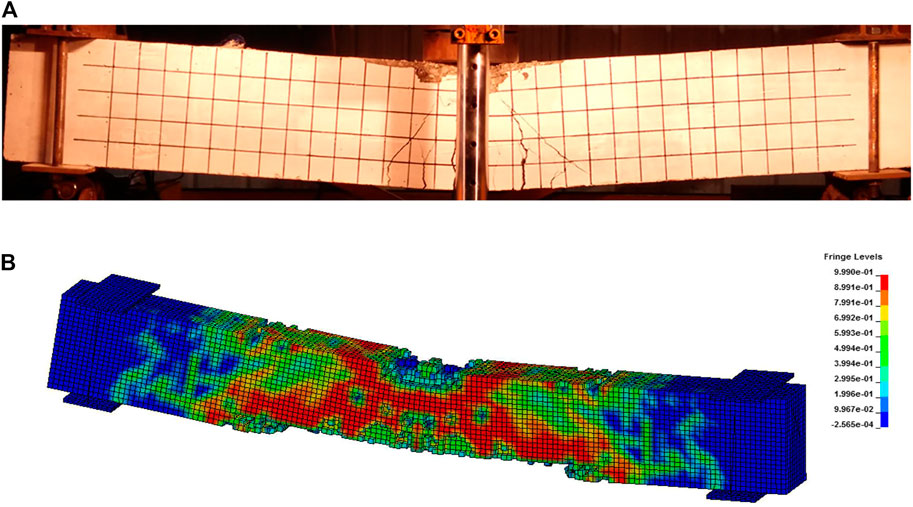
FIGURE 4. Damage patterns of the beam.
Figures 5, 6 present the comparisons between the numerical and the test results in terms of the impact force and the midspan displacement curves of the specimen. As shown in Figure 5, the peak impact force, Fd, and its duration time are simulated with accuracy. When the contact takes place, the drop hammer penetrates the beam immediately and causes the peak impact force. Following the peak impulse, the curve vibrates around the plateau value. This phenomenon may be attributed to the interaction between the drop hammer and the beam. Then, the beam deflects downward and tends to depart from the drop hammer; hence, the interaction between the two components decreases, and the impact force descends simultaneously. As shown in Figure 6, the curve of midspan displacement rises to the peak value, dp, when the contact takes place, and then turns to descend to a residual value, dr. As shown in Table 2, the results of dynamic responses between the test and the numerical simulation agree quite well.
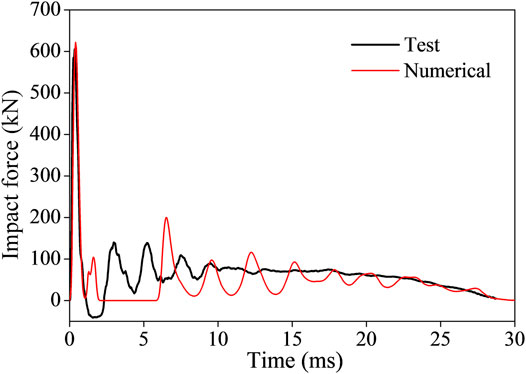
FIGURE 5. Time history curves of impact force.
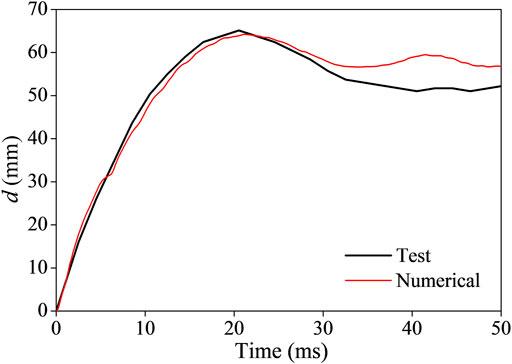
FIGURE 6. Time history curves of midspan displacement.
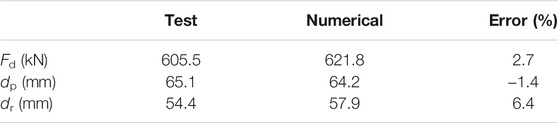
TABLE 2. Comparison of dynamic responses.
Comparing the damage pattern, impact force, and midspan displacement response obtained from the test and numerical simulation, it is found that the numerical model in this study can provide an accurate simulation of impact responses of the RC beam.
Using the verified numerical model, the midspan displacement of the RC beam under the same impact velocity v = 6 m/s and different impact masses m is analyzed. The results are shown in Figure 7. It can be seen that the peak midspan displacement of the RC beam increases with the impact mass in a certain range. Beyond the range, the beam fractures are as shown in Figure 8. The residual displacement dr also increases with the impact mass, and the value of dr is relatively lower than dp.
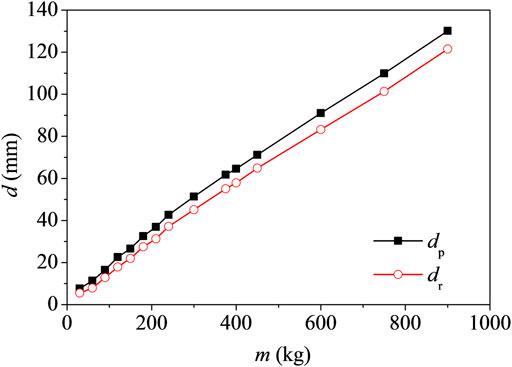
FIGURE 7. Midspan displacement vs impact mass.
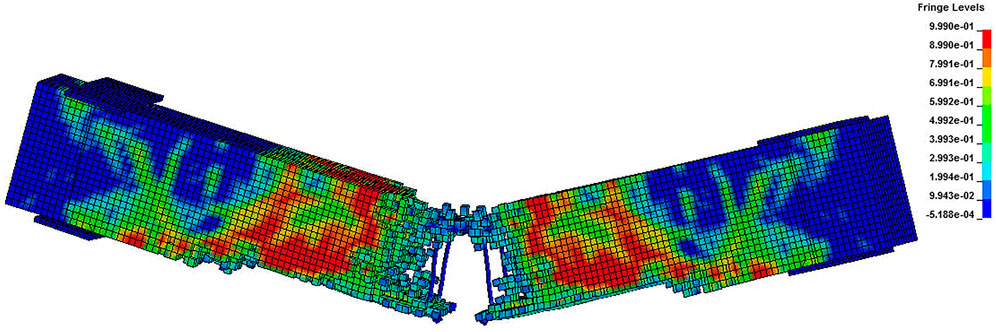
FIGURE 8. Fracture of beam.
The midspan displacement of the RC beam under the same impact mass m = 400 kg and different impact velocities v is analyzed. The results are shown in Figure 9. It can be seen that similar to the variation law reflected in Figure 7, the peak and residual midspan displacements of the RC beam increase with the impact velocity in a certain range. Beyond the range, the beam fractures.
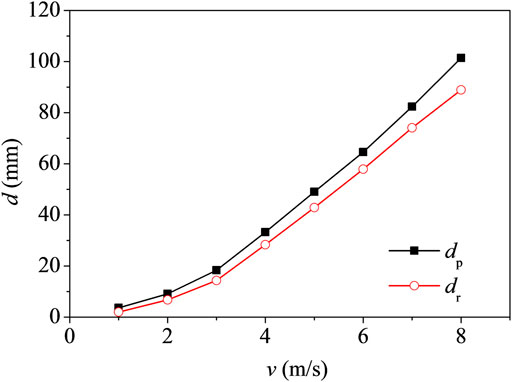
FIGURE 9. Midspan displacement vs impact velocity.
Based on the previous analysis, it can be concluded that both the impact mass and the impact velocity have effects on the midspan displacement of the RC beam. To investigate the integrated effects, the midspan displacement of the RC beam under the impact mass and impact velocity varies at the same time. The results are shown in Figure 10.
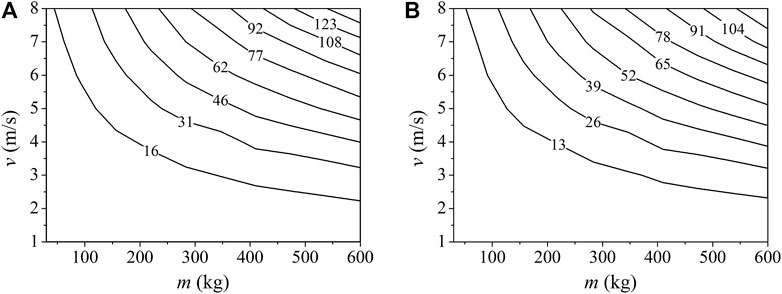
FIGURE 10. Response surface of midspan displacement: (A) Peak value dp; (B) Residual value dr.
The power function is used to fit the response surface of midspan displacement, as shown in Figure 10. Thus, dp and dr can be expressed asEq. 10 and Eq. 11, in which the dimension is mm for dp and dr, and is kg and m/s for m and v, respectively. As shown in Figure 11, the analytical solution results ofEq. 10 and Eq. 11 are compared with the numerical results with the correlation coefficient R is 0.997 and 0.999, respectively. Therefore, it can be concluded that the impact mass and the impact velocity have integrated effects on the midspan displacement of the RC beam, and the response surface of the midspan displacement can be fitted as the binary power function of impact mass and impact velocity.
where the units of m, v, and d are kg, m/s, and mm, respectively.
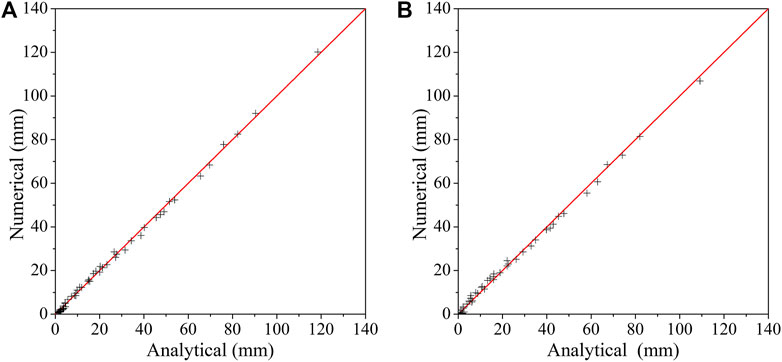
FIGURE 11. Comparison of analytical and numerical simulation: (A) Peak value dp; (B) Residual value dr.
With the change in the RC beam parameters, such as the dimensions, the strengths of the reinforced bar and concrete, and the reinforcement ratio, the impact response surface of midspan displacement would be fitted as binary power functions with other constants.
The point on the response surface shown in Figure 10 represents the midspan displacement of the RC beam under various impact mass and impact velocity combinations, and the isoline represents various impact combinations with the same midspan displacement response.
In the drop hammer test mentioned earlier, the RC beam specimen is subjected to the impact with the impulse p = mv = 400 × 6 = 2400 N/s. The peak and residual displacement of the RC beam under various impact combinations with the equal impulse, 2,400 N/s, are analyzed within the scope of low-speed impact, in which the velocity is no more than 20 m/s. The value scope is on the basis of the impact accident occurring in structural engineering (Perry and Burns, 1965; Mainstone, 1966; Struck and Voggenreiter, 1975). From the analysis results shown in Figure 12, it can be seen that the midspan displacement response of the RC beam is different under various impact combinations, and it decreases with an increase in the impact mass under an equal impulse.
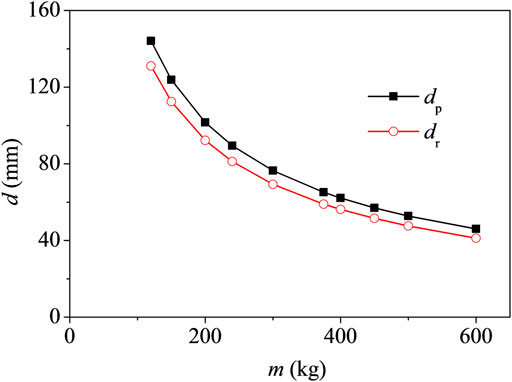
FIGURE 12. Midspan displacement under various impact with the equal impluse.
In the test, the RC beam specimen is subjected to the impact with the impact energy E = 1/2mv2 = 1/2 × 400×62 = 7,200 J. The peak and residual displacement of the RC beam under various impact combinations with the equal impact energy, 7,200 J, are analyzed within the scope of a low-speed impact, and the results are shown in Figure 13. From the figure, it can be seen that the midspan displacement response of the RC beam increases with an increase in the impact mass under an equal impact energy.
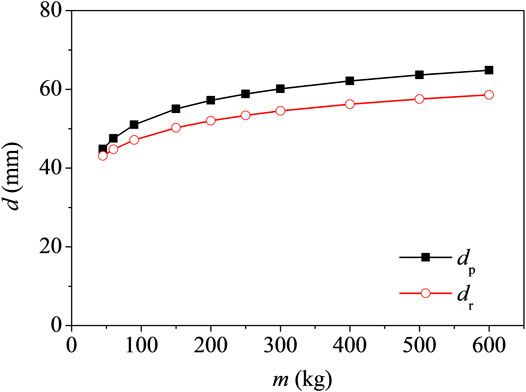
FIGURE 13. Midspan displacement under various impact with the equal impact energy.
From the aforementioned analysis, it can be concluded that the impulse or impact energy could not be used as an independent indicator of the impact.
The deformation criterion can well reflect the main failure reason of the RC element in the non-linear stage, and it can concisely reflect the failure degree of the element (Moehle, 1992; Kowalsky et al., 1995; Chopra and Goel, 2001). Therefore, the deformation criterion is suggested to be used to judge the impact failure of the RC beam.
The deformation criterion takes the deformation exceeding the threshold value of the element as the criterion of failure and is usually expressed in the form of ductility coefficient μ as follows:
where [μ] is the threshold value of ductility coefficient, and μ can be expressed as follows:
where d is the displacement of the RC beam and dy is the yield one.
According to the section analysis, the yield displacement of the RC beam in the drop hammer test is 5 mm, and the residual displacement is dr = 54.4 mm under the impact with the impact mass of 400 kg and the impact velocity 6 m/s. It is suggested that the threshold ductility coefficient, [μ], of the bending element in the protective structure under the chemical explosion should not exceed 10 referring to the literature (Tsinghua University, 1982). Thus, the RC beam failures under the impact based on the ductility coefficient μ = dr/dy = 54.4/5 = 10.88 ≥ [μ].
However, considering that the importance of common civil engineering structures is lower than the protective structures and that the adverse social effects caused by the soft impact are also relatively lower than those caused by the chemical explosion, the threshold value of ductility coefficient is set as 15 in this research. Thus, it can be concluded that the RC beam can resist the impact based on the ductility coefficient μ = 10.88 ≤ [μ]. Compared to the literature (Tsinghua University, 1982), the threshold value used in this research would be more applicable for the RC beam because of the general integrity of the beam shown in Figure 4. Based on [μ] = 15, the maximum allowable residual midspan displacement of the beam specimen in this study can be calculated as 75 mm. The beam specimen does not fracture and can resist the impact within the scope of a low-speed impact, while the larger residual midspan displacement would mean the beam fracture.
This study presents a numerical model to simulate the impact responses of the RC beam. The numerical model is calibrated using the drop hammer test on the RC beam specimen. Using the verified numerical model, the displacement response of the RC beam is analyzed by considering the incorporation of the impact mass and impact velocity, and the impact failure of the RC beam is judged by the deformation criterion. The results are summarized as follows.
1) The impact mass and the impact velocity have integrated effects on the midspan displacement of the RC beam, and the response surface of the midspan displacement can be fitted as a binary power function of impact mass and impact velocity.
2) The midspan displacement response of the RC beam is different under various impact combinations with equal impulse, and it decreases with an increase in the impact mass, while it increases with an increase in the impact mass under various impact combinations with equal impact energy. The impulse or impact energy could not be used as an independent indicator of the impact.
3) The deformation criterion is recommended to be used to judge the impact failure of the RC beam, and the threshold value of the ductility coefficient is suggested to set as 15 in the impact-resistant design for RC beams in civil engineering structures within the scope of a low-speed impact.
The original contributions presented in the study are included in the article/Supplementary Material, further inquiries can be directed to the corresponding author.
JG performed the test and the data analyses and wrote the manuscript. GJ contributed to the data analyses. ZW contributed significantly to manuscript preparation. AH helped to perform the analysis with constructive discussions. JC contributed to the conception of the study.
The authors declare that the research was conducted in the absence of any commercial or financial relationships that could be construed as a potential conflict of interest.
All claims expressed in this article are solely those of the authors and do not necessarily represent those of their affiliated organizations, or those of the publisher, the editors, and the reviewers. Any product that may be evaluated in this article, or claim that may be made by its manufacturer, is not guaranteed or endorsed by the publisher.
The authors would like to acknowledge Fujian Province Natural Sciences (2019J01885 and 2019J01884), and the Fujian Jiangxia University Scientific Foundation (JXZ2019003) for financial support to carry out this study.
Cai, J., Ye, J., Wang, Y., and Chen, Q. (2017). Numerical Study on Dynamic Response of Reinforced concrete Columns under Low-Speed Horizontal Impact Loading. Proced. Eng. 210, 334–340. doi:10.1016/j.proeng.2017.11.085
Chopra, A. K., and Goel, R. K. (2001). Direct Displacement-Based Design: Use of Inelastic vs. Elastic Design Spectra. Earthquake Spectra 17, 47–64. doi:10.1193/1.1586166
Cowper, G. R., and Symonds, P. S. (1957). Strain-hardening and Strain-Rate Effects in the Impact Loading of Cantilever Beams. Providence: Brown University.
Fujikake, K., Li, B., and Soeun, S. (2009). Impact Response of Reinforced concrete Beam and its Analytical Evaluation. J. Struct. Eng. 135, 938–950. doi:10.1061/(asce)st.1943-541x.0000039
Guo, J., Cai, J., and Chen, W. (2017). Inertial Effect on RC Beam Subjected to Impact Loads. Int. J. Str. Stab. Dyn. 17, 1750053. doi:10.1142/s0219455417500535
He, Q. F., Li, J., Yue, L. Y., and Mao, J. W. (2020). Numerical Simulation on Impact Test of CFRP Strengthened Reinforced Concrete Beams. Front. Mater. 7, 252. doi:10.3389/fmats.2020.00252
Kowalsky, M. J., Priestley, M. J. N., and Macrae, G. A. (1995). Displacement-based Design of RC Bridge Columns in Seismic Regions. Earthquake Engng. Struct. Dyn. 24, 1623–1643. doi:10.1002/eqe.4290241206
Mainstone, R. (1966). Structural Tests on an Experimental Helicopter Platform. Proc. Inst. Civil Eng. 33, 65–91. doi:10.1680/iicep.1966.8959
Moehle, J. P. (1992). Displacement-based Design of RC Structures Subjected to Earthquakes. Earthquake spectra 8, 403–428. doi:10.1193/1.1585688
Murray, Y. D. (2007). Users Manual for LS-DYNA concrete Material Model 159. Available at: https://www.fhwa.dot.gov/publications/research/infrastructure/pavements/05062/index.cfm (Accessed 27.2.2022).
Ohnuma, H. (1987). Dynamic Response and Local Rupture of Reinforced concrete Beam and Slab under Impact Loading. Tokyo: Transactions of the Japan Concrete Institute.
Perry, E. S., and Burns, N. H. (1965). Simple Set up for Applying Impact Loads. Mater. Res. Stand. 5, 515–516.
Saleh, Z., Sheikh, M. N., Remennikov, A. M., and Basu, A. (2019). Numerical Analysis of Behavior of Glass Fiber-Reinforced Polymer Bar-Reinforced concrete Beams under Impact Loads. ACI Struct. J. 116, 151–160. doi:10.14359/51715658
Sha, Y., and Hao, H. (2013). Laboratory Tests and Numerical Simulations of Barge Impact on Circular Reinforced concrete Piers. Eng. structures 46, 593–605. doi:10.1016/j.engstruct.2012.09.002
Soleimani, S. M., Banthia, N., and Mindess, S. (2007). Behavior of RC Beams under Impact Loading: Some New Findings. London: Taylor & Francis.
Struck, W., and Voggenreiter, W. (1975). Examples of Impact and Impulsive Loading in the Field of Civil Engineering. Mat. Constr. 8, 81–87. doi:10.1007/bf02476326
Tachibana, S., Masuya, H., and Nakamura, S. (2010). Performance Based Design of Reinforced concrete Beams under Impact. Nat. Hazards Earth Syst. Sci. 10, 1069–1078. doi:10.5194/nhess-10-1069-2010
Tran, D. T., Pham, T. M., Hao, H., and Chen, W. (2021). Numerical Study on Bending Response of Precast Segmental concrete Beams Externally Prestressed with FRP Tendons. Eng. Structures 241, 112423. doi:10.1016/j.engstruct.2021.112423
Tsinghua University (1982). Underground Protective Structure. Beijing: China Architecture and Building Press.
Xu, B., and Zeng, X. (2014). Experimental Study on the Behaviors of Reinforced concrete Beams under Impact Loadings. China Civil Eng. J. 47, 41–51. doi:10.15951/j.tmgcxb.2014.02.010
Ye, J.-B., Cai, J., Liu, X., Chen, Q.-J., Zuo, Z.-L., and He, B.-Q. (2021). Experimental Investigation of Inclined RC Pile Groups under Horizontal Static and Impact Loads. Eng. Structures 233, 111846. doi:10.1016/j.engstruct.2020.111846
Zeng, X., and Xu, B. (2012). Experimental Study on the Impact-Resistant Behavior of RC Beams without Shear-Resistant Rebar. China Civil Eng. J. 45, 63–73. doi:10.15951/j.tmgcxb.2012.09.022
Keywords: RC beam, impact response, midspan displacement, response surface, failure criterion
Citation: Guo J, Jiang G, Wu Z, He A and Cai J (2022) Numerical Investigation on the Dynamic Responses and Failure Criterion of RC Beam Under Impact. Front. Mater. 9:851301. doi: 10.3389/fmats.2022.851301
Received: 09 January 2022; Accepted: 17 February 2022;
Published: 14 March 2022.
Edited by:
Fangying Wang, University of Nottingham, United KingdomReviewed by:
Guan Lin, Hong Kong Polytechnic University, Hong Kong SAR, ChinaCopyright © 2022 Guo, Jiang, Wu, He and Cai. This is an open-access article distributed under the terms of the Creative Commons Attribution License (CC BY). The use, distribution or reproduction in other forums is permitted, provided the original author(s) and the copyright owner(s) are credited and that the original publication in this journal is cited, in accordance with accepted academic practice. No use, distribution or reproduction is permitted which does not comply with these terms.
*Correspondence: Zhengyu Wu, emhlbmd5dV93dUBmamp4dS5lZHUuY24=
Disclaimer: All claims expressed in this article are solely those of the authors and do not necessarily represent those of their affiliated organizations, or those of the publisher, the editors and the reviewers. Any product that may be evaluated in this article or claim that may be made by its manufacturer is not guaranteed or endorsed by the publisher.
Research integrity at Frontiers
Learn more about the work of our research integrity team to safeguard the quality of each article we publish.