 Yamei Zhang1
 Xiaoyu Bai
 Xiaoyu Chen
 Mingyi Zhang
94% of researchers rate our articles as excellent or good
Learn more about the work of our research integrity team to safeguard the quality of each article we publish.
Find out more
ORIGINAL RESEARCH article
Front. Mater. , 09 March 2022
Sec. Polymeric and Composite Materials
Volume 9 - 2022 | https://doi.org/10.3389/fmats.2022.849114
The glass fiber-reinforced polymer (GFRP) anchor, a new type of composite material anchor, has been widely used in foundation engineering of coastal areas. This study investigated the feasibility of applying the fiber Bragg grating (FBG) sensing technology to monitor the strain of the GFRP anchor during the pull test. Based on an advanced method, the FBG strain sensors were installed in GFRP anchors during the anchor manufacturing process. Then, GFRP anchors were installed into the pre-created borehole with an M30 cement mortar. Meanwhile, the FBG temperature sensors were installed next to the GFRP anchors to monitor the temperature change during the test. The axial force and average shear stress of GFRP anchors along depth during the pull test were analyzed, and the influence of temperature change on strain measurement was studied. The test results showed that the FBG sensing technology and the installation method of FBG strain sensors used in the test were feasible to monitor the mechanical properties of the GFRP anchor during the pull test. Moreover, the effect of temperature change on strain monitoring of FBG strain sensors was negligible.
In coastal areas, the traditional steel anti-floating anchors are prone to corrosion due to the high chlorine content within the underground water. The advantage in the application of inorganic–organic composite has promoted in engineering and geological systems (Hou et al., 2019; Hou et al., 2020a), which has affected the service life of the anti-floating anchor and the safety of buildings. The glass fiber-reinforced polymer (GFRP) anti-floating anchor is a new type of anchor made of resin and glass fiber (Toutanji and Saafi, 2000; Won et al., 2008). Compared with the reinforced anchor, the GFRP anchor has the advantages of high strength, strong corrosion resistance, and low electromagnetic properties (Ahmed et al., 2008; Robert and Benmokrane, 2010). At present, the GFRP anchor has been widely used in foundation engineering of coastal areas (Larralde and Silva–Rodriguez, 1993; Pecce et al., 2001; Lee et al., 2009; Sebastian et al., 2013).
Tensile strength is one of the most important mechanical properties of the anti-floating anchor. In the pullout test of the GFRP anchor, the stress and strain of anchors were generally measured by electrical sensors, such as wire strain gauge and dial gauge (Ashford and Jakrapiyanun, 2001; Ozkal et al., 2018). In general, the strain gauges are directly adhered to the surface of the anchor body or embedded into a pre-created groove to monitor the strain of the anchor (Liu and Yuan, 2010; Li et al., 2013a). Due to the uneven surface of the GFRP anchor, it is necessary to polish the surface of anchor before adhering the strain gauges, which damages the anchor structure and reduces the tensile strength of anchor (Chaallal and Benmokrane, 1993; Kilic et al., 2002). Moreover, the strain gauges installed in this way are easy to fall off and the survival rate is low, resulting in the loss of test data. However, there are more studies on the molecular dynamics of composite materials (Hou et al., 2017; Hou et al., 2020b).
The fiber Bragg grating (FBG) sensor system provides a new monitoring method in civil engineering. Compared with the traditional testing technologies, FBG technology has the advantages of high precision and sensitivity, easy installation, anti-electromagnetic interference, and remote monitoring (Rao, 1999; Hong et al., 2010; Li et al., 2014; Kou et al., 2018; Leal–Junior et al., 2018; Min et al., 2021). At present, fiber Bragg grating sensing technology has been applied in the construction and health detection of highways, bridges and tunnels, strain monitoring of deep foundation pit support, and pile stress tests (Kim et al., 2010; Zhu et al., 2010; Hassan et al., 2012; Wang et al., 2015; Barrias et al., 2016). For the GFRP anchor, Zhu et al. (2011), Li et al. (2013a) and Jin et al. (2014) all used the method of grooving on the surface of GFRP anchor, then adhering the FBG strain sensors along the groove to measure the strain of GFRP anchor. However, this method not only damages the structure of the GFRP anchor but also impacts the bearing capacity of the anchor. Therefore, it is important to find an advanced method to monitor the strain of the GFRP anchor without damaging the structure.
In this study, the feasibility of installing FBG sensors in GFRP anchor in the process of anchor manufacturing was investigated. To study the effect of temperature change on strain monitoring results, the FBG temperature sensors were installed close to the GFRP anchors on this basis of the axial force and average shear stress of the GFRP anchors were investigated through field pull test.
Adding elements such as germanium (Ge), stannum (Sn), and boron (B) in optical fibers can improve the photosensitivity of the fiber. The Bragg grating is permanently photoetched into the core of an optical fiber by exposure to a two-beam ultraviolet (UV) interference pattern (Lee et al., 2004). This method can make the refractive index of the fiber change periodically along its length direction, thus forming a permanent phase Bragg grating. By injecting continuous incident light from one end into the fiber, the Bragg grating acts as a narrowband reflection filter. The wavelength satisfying the Bragg diffraction condition will be reflected by the Bragg grating, and the rest of the incident light will continue to transmit through the grating (Kou et al., 2018). The working principle of FBG sensing technology is shown in Figure 1. The Bragg resonance is determined using the following equation (Zhou et al., 2015):
where λ is the wavelength of reflected light, neff is effective refractive index of the fiber core, and Λ is the spatial pitch of the grating. The wavelength of reflected light is affected by the strain and temperature. If the stress or temperature changes, the central wavelength of reflected light will change. Information on strain and temperature can be calculated (Lee et al., 2004) as follows:
where Δλ is the wavelength change, Kε is the strain sensitivity coefficient, KT is the temperature sensitivity coefficient, λ0 is the initial wavelength, Δε is the strain change, and ΔT is the temperature change. When the temperature change is small, Eq. 2 can be simplified as follows:
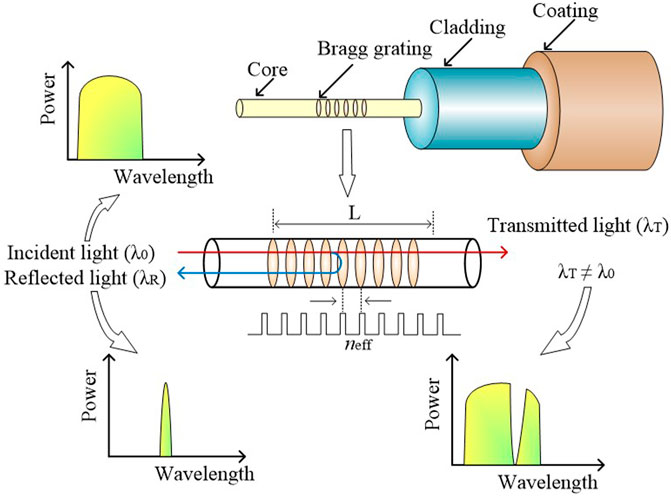
FIGURE 1. Working principle of FBG sensing technology.
In this test, the GFRP anchors were produced by a manufacturing company in Nanjing, China. Two GFRP anchors, GFRP1 and GFRP2, with a length of 8,000 mm and a diameter of 28 mm, were studies. The resin volume fraction of the GFRP anchors is 25%, and the glass fiber volume fraction is 75%. The mechanical parameters of the GFRP anchor used in the test are shown in Table 1.

TABLE 1. Mechanical parameters of the GFRP anchor.
The bare fiber is an SMF28-C fiber with a diameter of 900 μm, and the gratings were etched on the fiber at a certain distance to form a line of bare FBG sensors, as shown in Figure 2A. The grating length is 10 mm, with the central wavelength range of 1,510–1,590 nm, and the wavelength interval is greater than 5 nm, the reflectivity is greater than 80%, the 3 dB bandwidth is less than 0.3 nm, and the side-mode suppression ratio is greater than 15 dB. During the production of GFRP anchors, the bare FBG sensor line was fixed at the axis position of anchor mold, while resins and fibers were injected into the anchor mold. Then the anchor was put into the curing room, cured at 60°C for 24 h, and then at 85°C for 24 h. The bare fiber is fragile and easy to be damaged, which needs specific protection. Therefore, the outside bare fiber was threaded into a polytetra fluoroethylene tube with an inner diameter of 2 mm and an outer diameter of 4 mm, and then epoxy resin was injected in the tube by using a needle, as shown in Figure 2B. Data of the FBG sensor were collected by the FS 2200RM-rack-mountable Bragg meter demodulator manufactured in Portugal. The acquisition frequency was set at 1 Hz associated with the measurement band between 1,500 nm and 1,600 nm, the wavelength resolution in 1 p.m., and the instrument accuracy in ±2 p.m.
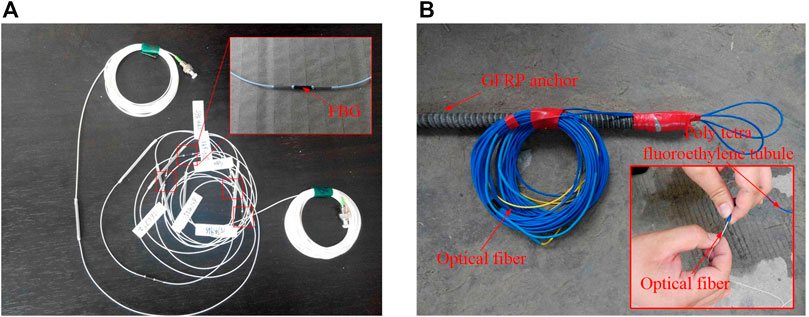
FIGURE 2. FBG strain sensors and GFRP anchor: (A) FBG strain sensors and (B) GFRP anchor with FBG sensors.
In order to study the influence of temperature change on the monitoring results of the FBG strain sensor, five FBG temperature sensors were embedded along the depth beside the test anchor. The length of the FBG temperature sensor is 18 mm, with a diameter of 2.0 mm and an interval distance of 1.0 m. Before the construction of the anchor, the temperature sensors were installed on a thin steel wire, then placed into the borehole along with the GFRP anchor, and the mortar was poured into the borehole. The installation location of FBG sensors is shown in Figure 3.
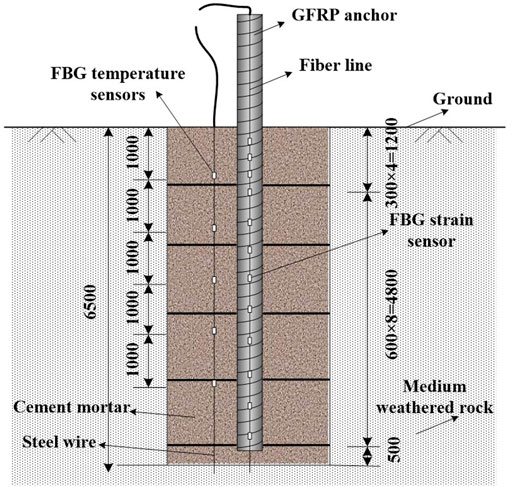
FIGURE 3. Diagram of installation of FBG sensors.
1) Drilling and GFRP anchor installation: After land leveling, the hole drill was used to drill holes, and the direction of drilling is vertical to the ground (Figure 4A). The diameter of the drill borehole is 110 mm, and the depth of the drill borehole exceeds 0.5 m of the effective length of the anchor. After that, the test anchor was tied to the bracket and put into the borehole (Figure 4B). Then, the M30 cement mortar was injected into the borehole in the ordinary grouting method, and the mortar was cured for 28 days (Figure 4C).
2) Loading and test system: The installations of the test system include steel sleeve (the steel sleeve contact with the GFRP anchor through structural adhesive), anchorage device, steel plate (the thickness is 30 mm), KQF-60T center hole jack (the stroke of the jack is 20 cm), MGH-500 anchor cable dynamometer, GSJ-2A detector, and SI425 fiber grating demodulator, as shown in Figure 4D.
3) The pullout test was a destructive test, and the whole loading process adopted the gradation method. The first load was 40 kN, which was increased according to the following steps: 0→40 kN→80 kN→120 kN→160 kN→200 kN→240 kN→…, until the anchor was broken. The loading rate was 0.2 kN/s, and the loading time interval between the two adjacent load levels was 15 min. The pullout tests of the GFRP anchor were conducted according to the standard test method for the rock bolt anchor pull test (ASTM D4435-13e1, 2013). When the GFRP anti-floating anchor is broken, the fiber filament of the anchor is broken gradually and the fracture position is 2–3 cm higher than the solid surface of the anchor. During the whole fracture process lasting 2–3 s, 2∼ 3-mm-wide cracks appear in the solid of the anchor. When the GFRP anchor is damaged by shear and slip, the jack pressure cannot be increased, the bolt displacement keeps increasing, the anchor solid has cracks, and the fiber sheet has fractures. When the GFRP anchor is pulled out and destroyed, with a “bang,” the jack pressure gauge instantly becomes 0. Due to the impact of vibration, the dial indicator reading also changes suddenly, causing slippage of the anchor and anchor body. The schematic diagram of the anchor pull test system is shown in Figure 5.
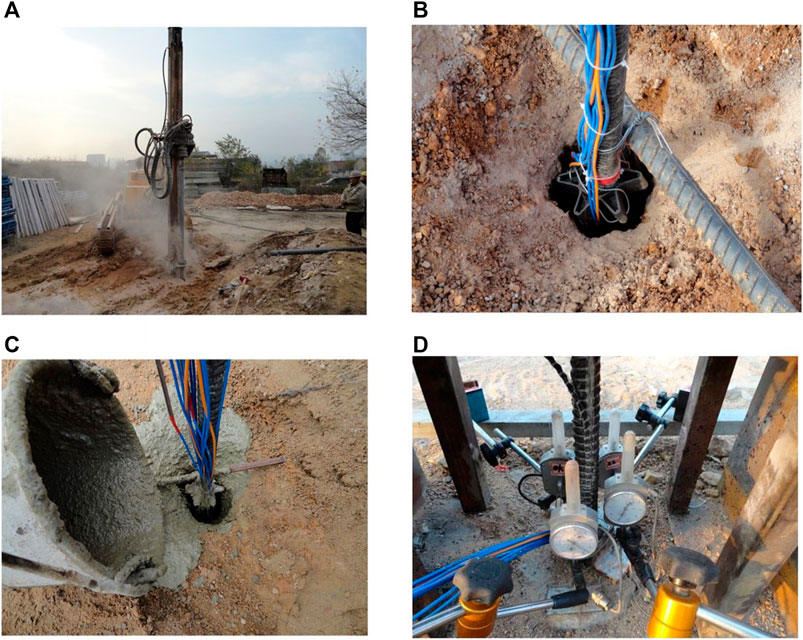
FIGURE 4. Pull test procedure for GFRP anchor: (A) drilling borehole, (B) installing the anchor into the borehole, (C) pouring M30 cement mortar, and (D) pulling test.
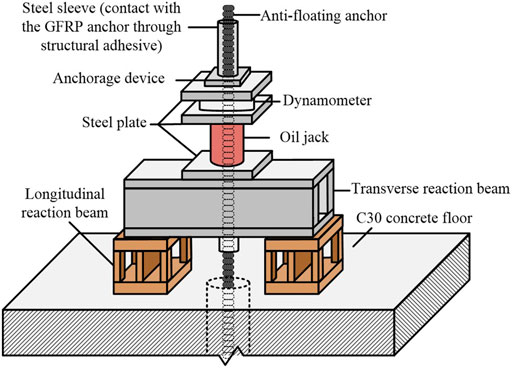
FIGURE 5. Schematic diagram of the anchor pull test system.
The axial strain εi of the GFRP anchors under different pulling forces can be measured by FBG strain sensors, and the axial force Fi can be calculated by using the following equation (Zhu et al., 2011):
where E is Young’s modulus of the GFRP anchor, which is 51.0 GPa, and the A is the cross sectional area of the GFRP anchor, which can be calculated by the diameter D = 28.0 mm.
The relationships between the axial force and depth under different pulling forces are shown in Figure 6. It can be seen that the axial force distribution of the GFRP1 and GFRP2 is almost the same. The axial force at different positions of the anchor increased with the load, and the increased amplitude was different. The increased amplitude was large in the deep part and small in the shallow part of the anchor. The stress was mainly concentrated in the anchor within about 3.0 m from the ground, and no stress was generated at the end of the anchor. With the increase in depth, the amplitude of the axial force decreased. It indicates that the axial force of the GFRP anchor was not distributed uniformly along the depth, but transmitted gradually along the depth (Li et al., 2013b).
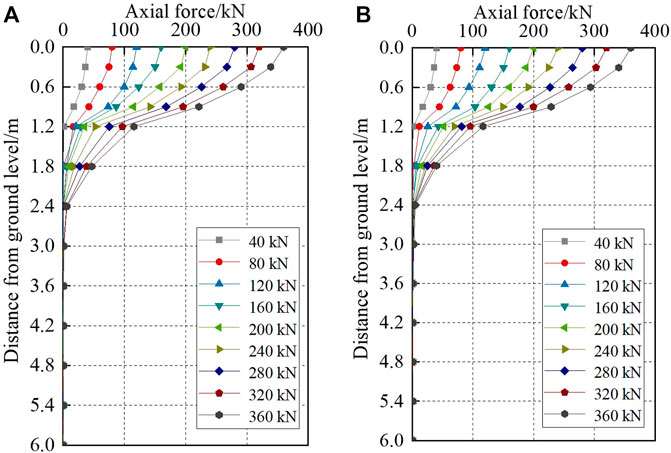
FIGURE 6. Relationships between the axial force and depth: (A) GFRP1 and (B) GFRP2.
When the anchor length was constant, there was a critical value of the anchor length under the pulling forces, according to the references from Jin et al. (2014). Beyond this length, the tangential displacement of the anchor will increase, but the bearing capacity of the anchor will not increase. This length is called the critical anchorage length. Moreover, with the increase in anchor length, the displacement of the anchor head increased, leading to the decrease in surface friction resistance of anchorage body, which was unfavorable to the anti-floating stability of the structure. According to the Zhu et al. (2011), the anchorage length of the anchor should not be too short, and the length should not only ensure the full play of the bonding stress between the surrounding rock and the anchorage body but also ensure the adequate stress reserve of the anchor. It indicates that the stress transfer depth of the GFRP anchor with a diameter of 28 mm was about 3.5 m, and the reasonable anchorage length of the anchor with a diameter of 28 mm GFRP should be 3.5–6.0 m.
The average shear stress can be calculated as follows (Zhu et al., 2011):
where Fi denotes the axial force of GFRP anchor at test section i, Fi-1 is the axial force of GFRP anchor at test section i-1, d is the diameter of GFRP anchor bolt (28.0 mm), and ΔL is the distance between test section i and test section i-1.
The relationships between the average shear stress and depth under different pulling forces are shown in Figure 7. It can be seen that the average shear stress of the GFRP anchor increased at first and then decreased along with depth, and little shear stress could be transferred to the lower anchor. The maximum average shear stress of the GFRP anchor was about 0.8 m below the ground, and with the increase in pulling forces, the peak value of the shear stress curve increased gradually. When the maximum average shear stress reached the ultimate shear capacity of the anchor or the ultimate shear strength between the anchor and anchorage body, shear failure occurred at the maximum shear stress of the anchorage segment, which is consistent with the results of Li et al. (2013b) and Jin et al. (2014). Moreover, the distribution of average shear stress conforms to the theoretical solution derived from the Mindlin displacement solution (Kim et al., 2010). During the GFRP anti-floating anchor test, the damage between the anchor bar and the cement mortar adversely impacts the mechanical properties of the bonding medium. The bond-slip curve not only effectively avoids the difficulties caused by this adverse effect in the analysis of bonding performance but also accurately reflects the relationship between the bond stress and the slip of the GFRP bolt and the cement mortar under the pull-out load. Commonly used analysis models include BPE model, improved BPE model, CRM model, Gao Danying model, and Zheng Universe model. For specific analysis, refer to Kuang et al. (2020) which will not be repeated here.
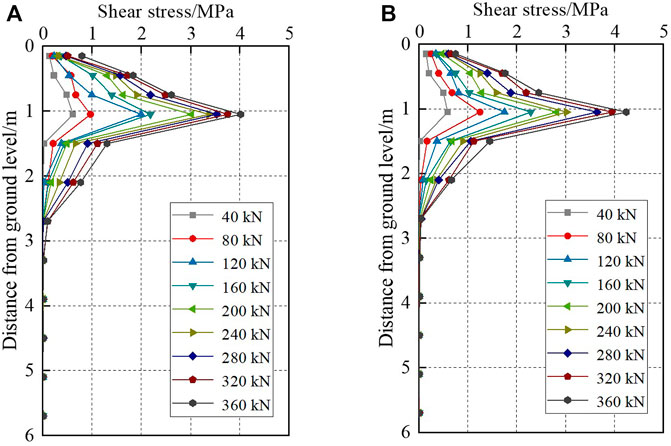
FIGURE 7. Relationships between the average shear stress and depth: (A) GFRP1 and (B) GFRP2.
According to Eq. 2, the wavelength change of FBG temperature sensors during the test was used to calculate the strain value of the anchors caused by temperature change. Once the axial strain is known, the axial force caused by the temperature change can be calculated by Eq. 1, and the result is shown in Figure 8. It can be seen that within the depth range of 2.0–5.0 m, the stress of the anchor caused by the temperature change was 0 in most cases. The stress at the depth of 1.0 m was affected by temperature change, but the axial force caused by temperature change was not more than 0.004 kPa. The influence of temperature on the calculation is lower than 0.001%. This is because the sensors near the ground were subjected to the temperature change of the environment more obviously, and the heat conduction had hysteresis (Zhou et al., 2015). Moreover, the FBG temperature sensors were installed in cement. The thermal conductivity of cement and the GFRP were 1.28 and 0.20, respectively (Kuang et al., 2020). The thermal conductivity of cement was significantly greater than that of GFRP, and the temperature change in the GFRP anchor should be less than that of cement. In summary, due to the short time of this test, the influence of temperature change on strain test results of the GFRP anchor can be ignored.
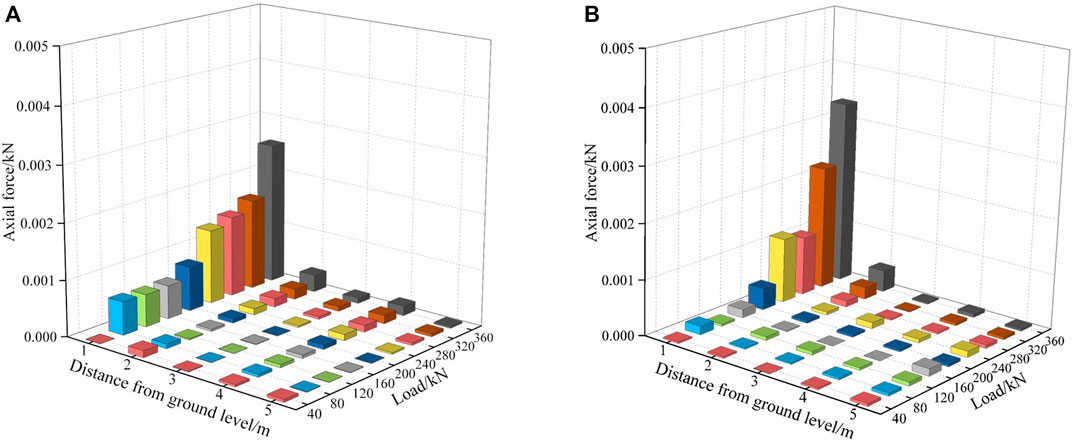
FIGURE 8. Axial force change caused by the temperature change: (A) GFRP1 and (B) GFRP2.
The objective of this study is to validate the feasibility of installing the FBG strain sensors in the GFRP anchor during the anchor manufacturing process. Based on field tests, the axial force, average shear stress, and influence of temperature on strain measurement were studied using the FBG sensor system. Preliminary conclusions and suggestions are summarized as follows:
1) The sensor installation method used in the test can effectively avoid the damage to the GFRP anchor and maintain the structural integrity of the GFRP anchor. The survival rate of 24 FBG strain sensors used in the test was 100%, suggesting the FBG sensing technology suitable for internal force monitoring of the GFRP anchor.
2) With the increase in pull forces, the stress of different position of the GFRP anchor increased significantly, but the increased amplitude was different. The stress transfer depth of the GFRP anchor with a diameter of 28 mm was 3.0–3.5 m, and the axial force of the anchor decreases with the depth.
3) The average shear stress of the GFRP anchor increased first and then decreased along depth, and the maximum shear stress appears at the position of 1.0 m. With the increase in pulling forces, the influence range of the average shear stress along depth expanded continuously.
The original contributions presented in the study are included in the article/Supplementary Material, further inquiries can be directed to the corresponding author.
YZ wrote the manuscript. NY processed the data. XB and SS conducted field tests. DJ typesetted the manuscript. XC revised the manuscript. MZ designed the field test.
This research was financially supported by the Key Program of Natural Science Foundation of Shandong Province (ZR2020KE009), the China Postdoctoral Science Foundation Funding (2018M632641), the Shandong Provincial Postdoctoral Innovation Program of China (201903043), Higher Educational Science and Technology Program of Shandong Province (J16LG02), and Qingdao Postdoctoral Applied Research Program (2018101).
The authors declare that the research was conducted in the absence of any commercial or financial relationships that could be construed as a potential conflict of interest.
All claims expressed in this article are solely those of the authors and do not necessarily represent those of their affiliated organizations, or those of the publisher, the editors, and the reviewers. Any product that may be evaluated in this article, or claim that may be made by its manufacturer, is not guaranteed or endorsed by the publisher.
Ahmed, E. A., El-Salakawy, E. F., and Benmokrane, B. (2008). Tensile Capacity of GFRP Postinstalled Adhesive Anchors in Concrete. J. Compos. Constr. 12, 596–607. doi:10.1061/(asce)1090-0268(2008)12:6(596)
Ashford, S. A., and Jakrapiyanun, W. (2001). Drivability of Glass FRP Composite Piling. J. Compos. Constr. 5, 58–60. doi:10.1061/(asce)1090-0268(2001)5:1(58)
ASTM D4435-13e1 (2013). , “Standard Test Method for Rock Bolt Anchor Pull Test,” ASTM International. USA: West Conshohocken. Available at: www.astm.org (Accessed March 27, 2019).
Barrias, A., Casas, J., and Villalba, S. (2016). A Review of Distributed Optical Fiber Sensors for Civil Engineering Applications. Sensors. 16, 748. doi:10.3390/s16050748
Chaallal, O., and Benmokrane, B. (1993). Physical and Mechanical Performance of an Innovative Glass-Fiber-Reinforced Plastic Rod for concrete and Grouted Anchorages. Can. J. Civ. Eng. 20, 254–268. doi:10.1139/l93-031
Hassan, M., Bakar, M., Dambul, K., and Adikan, F. (2012). Optical-Based Sensors for Monitoring Corrosion of Reinforcement Rebar via an Etched Cladding Bragg Grating. Sensors. 12, 15820–15826. doi:10.3390/s121115820
Hong, C.-Y., Yin, J.-H., Jin, W., Wang, C., Zhou, W.-H., and Zhu, H.-H. (2010). Comparative Study on the Elongation Measurement of a Soil Nail Using Optical Lower Coherence Interferometry Method and FBG Method. Adv. Struct. Eng. 13, 309–319. doi:10.1260/1369-4332.13.2.309
Hou, D., Lu, Z., Li, X., Ma, H., and Li, Z. (2017). Reactive Molecular Dynamics and Experimental Study of Graphene-Cement Composites: Structure, Dynamics and Reinforcement Mechanisms. Carbon. 115, 188–208. doi:10.1016/j.carbon.2017.01.013
Hou, D., Yu, J., and Wang, P. (2019). Molecular Dynamics Modeling of the Structure, Dynamics, Energetics and Mechanical Properties of Cement-Polymer Nanocomposite. Composites B: Eng. 162, 433–444. doi:10.1016/j.compositesb.2018.12.142
Hou, D., Zhang, W., Sun, M., Wang, P., Wang, M., Zhang, J., et al. (2020a). Modified Lucas-Washburn Function of Capillary Transport in the Calcium Silicate Hydrate Gel Pore: A Coarse-Grained Molecular Dynamics Study. Cement Concrete Res. 136, 106166. doi:10.1016/j.cemconres.2020.106166
Hou, D., Zhang, J., Pan, W., Zhang, Y., and Zhang, Z. (2020b). Nanoscale Mechanism of Ions Immobilized by the Geopolymer: A Molecular Dynamics Study. J. Nucl. Mater. 528, 151841. doi:10.1016/j.jnucmat.2019.151841
Jin, Q. P., Zheng, Z. J., Dou, B. Q., and Lei, X. W. (2014). “FBG Sensor Application for GFRP Soil Nailing Pull-Out Test. Appl. Mech. Mater. 477, 539–542. doi:10.4028/www.scientific.net/AMM.477-478.539
Kilic, A., Yasar, E., and Celik, A. G. (2002). Effect of Grout Properties on the Pull-Out Load Capacity of Fully Grouted Rock Bolt. Tunn. Undergr. Sp. Tech. 17, 355–362. doi:10.1016/S0886-7798(02)00038-X
Kim, H. I., Yoon, J. S., Kim, H. B., and Han, J. H. (2010). “Measurement of the thermal Expansion of Space Structures Using Fiber Bragg Grating Sensors and Displacement Measuring Interferometers. Meas. Sci. Technol. 21, 085704. doi:10.1088/0957-0233/21/8/085704
Kou, H.-L., Diao, W.-Z., Liu, T., Yang, D.-L., and Horpibulsuk, S. (2018). Field Performance of Open-Ended Prestressed High-Strength Concrete Pipe Piles Jacked into Clay. Sensors. 18, 4216. doi:10.3390/s18124216
Kuang, Z., Zhang, M.-y., and Bai, X.-y. (2020). Load-Bearing Characteristics of Fibreglass Uplift Anchors in Weathered Rock. Proc. Inst. Civil Eng. - Geotechnical Eng. 173, 49–57. doi:10.1680/jgeen.18.00195
Larralde, J., and Silva‐Rodriguez, R. (1993). Bond and Slip of FRP Rebars in Concrete. J. Mater. Civil Eng. 5, 30–40. doi:10.1061/(asce)0899-1561(1993)5:1(30)
Leal-Junior, A., Frizera, A., Díaz, C., Marques, C., Ribeiro, M., and Pontes, M. J. (2018). Material Features Based Compensation Technique for the Temperature Effects in a Polymer Diaphragm-Based FBG Pressure Sensor. Opt. Express. 26 (16), 20590–20602. doi:10.1364/oe.26.020590
Lee, H. K., Pyo, S. H., and Kim, B. R. (2009). On Joint Strengths, Peel Stresses and Failure Modes in Adhesively Bonded Double-Strap and Supported Single-Lap GFRP Joints. Compos. Structures. 87, 44–54. doi:10.1016/j.compstruct.2007.12.005
Lee, W., Lee, W.-J., Lee, S.-B., and Salgado, R. (2004). Measurement of Pile Load Transfer Using the Fiber Bragg Grating Sensor System. Can. Geotech. J. 41, 1222–1232. doi:10.1139/t04-059
Li, G., Dai, J., Ni, C., Yin, J. H., and Yu, L. (2013a). Bond Behavior between concrete Frame Beam and Large-Diameter Glass Fiber Reinforced Polymer (GFRP) Anchor Rod with Built-In Fiber Bragg Grating Sensor. Chin. J. Rock Mech. Eng. 32, 1449–1457.
Li, G., Pei, H. F., and Hong, C. Y. (2013b). Study on the Stress Relaxation Behavior of Large Diameter B-GFRP Bars Using FBG Sensing Technology. Int. J. Distrib. Sens. Netw. 9, 201767. doi:10.1155/2013/20176
Li, G.-W., Pei, H.-F., Yin, J.-H., Lu, X.-C., and Teng, J. (2014). Monitoring and Analysis of PHC Pipe Piles under Hydraulic Jacking Using FBG Sensing Technology. Measurement. 49, 358–367. doi:10.1016/j.measurement.2013.11.046
Liu, Y. H., and Yuan, Y. (2010). Experimental Research on anchorage Performance of Full-Thread GFRP Bonding Anchor Bolts. Chin. J. Rock Mech. Eng. 29, 394–400.
Min, R., Liu, Z., Pereira, L., Yang, C., Sui, Q., and Marques, C. (2021). Optical Fiber Sensing for marine Environment and marine Structural Health Monitoring: A Review. Opt. Laser Technology. 140 (140), 107082. doi:10.1016/j.optlastec.2021.107082
Özkal, F. M., Polat, M., Yağan, M., and Öztürk, M. O. (2018). Mechanical Properties and Bond Strength Degradation of GFRP and Steel Rebars at Elevated Temperatures. Construction Building Mater. 184, 45–57. doi:10.1016/j.conbuildmat.2018.06.203
Pecce, M., Manfredi, G., Realfonzo, R., and Cosenza, E. (2001). Experimental and Analytical Evaluation of Bond Properties of GFRP Bars. J. Mater. Civ. Eng. 13, 282–290. doi:10.1061/(asce)0899-1561(2001)13:4(282)
Rao, Y. J. (1999). Recent Progress in Applications of In-Fibre Bragg Grating Sensors. Opt. Lasers Eng. 31, 297–324. doi:10.1016/s0143-8166(99)00025-1
Robert, M., and Benmokrane, B. (2010). Physical, Mechanical, and Durability Characterization of Preloaded GFRP Reinforcing Bars. J. Compos. Constr. 14, 368–375. doi:10.1061/(asce)cc.1943-5614.0000104
Sebastian, W., Gegeshidze, G., and Luke, S. (2013). Positive and Negative Moment Behaviours of Hybrid Members Comprising Cellular GFRP Bridge Decking Epoxy-Bonded to Reinforced concrete Beams. Composites Part B: Eng. 45, 486–496. doi:10.1016/j.compositesb.2012.04.063
Toutanji, H. A., and Saafi, M. (2000). Flexural Behavior of concrete Beams Reinforced with Glass Fiber-Reinforced Polymer (GFRP) Bars. ACI Struct. J. 97, 712–719. doi:10.1046/j.0014-2956.2001.02489.x
Wang, Y., Shi, B., Zhang, T., Zhu, H., Jie, Q., and Sun, Q. (2015). Introduction to an FBG-Based Inclinometer and its Application to Landslide Monitoring. J. Civ. Struct. Health Monitor. 5, 1–9. doi:10.1007/s13349-015-0129-4
Won, J.-P., Park, C.-G., Kim, H.-H., Lee, S.-W., and Jang, C.-I. (2008). Effect of Fibers on the Bonds between FRP Reinforcing Bars and High-Strength concrete. Composites Part B: Eng. 39, 747–755. doi:10.1016/j.compositesb.2007.11.005
Zhou, J., Zhang, Y., Mulle, M., and Lubineau, G. (2015). Temperature Sensing of Micron Scale Polymer Fibers Using Fiber Bragg Gratings. Meas. Sci. Technol. 26, 085003. doi:10.1088/0957-0233/26/8/085003
Zhu, H.-H., Yin, J.-H., Yeung, A. T., and Jin, W. (2011). Field Pullout Testing and Performance Evaluation of GFRP Soil Nails. J. Geotech. Geoenviron. Eng. 137, 633–642. doi:10.1061/(asce)gt.1943-5606.0000457
Keywords: GFRP anchor, FBG sensor, strain monitoring, field test, average shear stress
Citation: Zhang Y, Bai X, Yan N, Sang S, Jing D, Chen X and Zhang M (2022) Load Transfer Law of Anti-Floating Anchor With GFRP Bars Based on Fiber Bragg Grating Sensing Technology. Front. Mater. 9:849114. doi: 10.3389/fmats.2022.849114
Received: 05 January 2022; Accepted: 14 February 2022;
Published: 09 March 2022.
Edited by:
Pingan Song, University of Southern Queensland, AustraliaReviewed by:
Carlos Marques, University of Aveiro, PortugalCopyright © 2022 Zhang, Bai, Yan, Sang, Jing, Chen and Zhang. This is an open-access article distributed under the terms of the Creative Commons Attribution License (CC BY). The use, distribution or reproduction in other forums is permitted, provided the original author(s) and the copyright owner(s) are credited and that the original publication in this journal is cited, in accordance with accepted academic practice. No use, distribution or reproduction is permitted which does not comply with these terms.
*Correspondence: Xiaoyu Bai, YmFpeGlhb3l1NTM4QDE2My5jb20=
Disclaimer: All claims expressed in this article are solely those of the authors and do not necessarily represent those of their affiliated organizations, or those of the publisher, the editors and the reviewers. Any product that may be evaluated in this article or claim that may be made by its manufacturer is not guaranteed or endorsed by the publisher.
Research integrity at Frontiers
Learn more about the work of our research integrity team to safeguard the quality of each article we publish.