 Zhaohui Chen
 Jiajie Xing
 Qiwen Luo1,2,3
 Xiaoyue Zhang
94% of researchers rate our articles as excellent or good
Learn more about the work of our research integrity team to safeguard the quality of each article we publish.
Find out more
ORIGINAL RESEARCH article
Front. Mater., 16 March 2022
Sec. Structural Materials
Volume 9 - 2022 | https://doi.org/10.3389/fmats.2022.844393
This article is part of the Research TopicAdvanced Concretes and Their Structural ApplicationsView all 23 articles
The concrete-GFRP composite beams have received extensive attention in civil engineering. However, the ambiguity of the fracture, debonding of the interface, and the GFRP profile limit the precise design of the composite beam. This article presents a comprehensive numerical study for the structural performance of composite pultruded GFRP beams to provide a better understanding of the mechanism of interfacial debonding and GFRP matrix fracture. The failure and delamination process of pultruded GFRP for anisotropy of materials is modeled using the Hashin criteria. The bond–slip behavior between the concrete slab and the top flange of the GFRP I-beam is simulated by the bilinear cohesive interface element. The availability and accuracy of the finite element model are verified by comparison with the four-point bending test results of the pure GFRP I-beam and composite beams as well. Based on the proposed comprehensive finite element model, the effects of the strength, thickness, and width of the concrete slab and the shear-span ratio of the beam on the structural behavior of the composite beam are studied. According to the parametric analysis, the excessive high strength of concrete, the width, and/or thickness of the concrete slab would lead to shear failure of the slab rather than significantly increasing the ultimate load of the composite beam. When having a small shear-span ratio, the matrix fracture and delamination will occur in the web of the GFRP profile. In addition, the height of the I-profile web has a significant effect on the stress and strain distribution of the composite beam. These parametric analyses could provide the numerical basis for the design of the GFRP composite beams.
Nowadays, the fiber-reinforced polymer (FRP) pultruded profiles are widely used in engineering practice (Gand et al., 2013). Among the different kinds of fiber-reinforced polymer, GFRP which is made of glass fiber-reinforced polymer matrix is the most popular one due to its cost-effective, light weight, high strength, and durability compared with the traditional building materials, such as steel and reinforced concrete (Borowicz and Bank, 2009; Borowicz and Bank, 2011). The pultruded GFRP profiles with I- or box-shaped cross sections are commonly used. However, the high deformability of the pultruded GFRP I-beam resulting from low elastic modulus of materials also limits its application in engineering practice and has attracted research interest. In order to prevent the buckling of the GFRP beam and improve the stiffness of the structure, an economical and practical way is to bond the concrete slab at the upper flange of the GFRP profile and form a concrete-GFRP composite beam by means of metallic studs and/or adhesive bonding, such as epoxy resin (Keller, 2001; Correia, et al., 2007; Zou et al., 2018). Lots of experimental and numerical research studies have been carried out on the mechanical performance and failure mechanism of this concrete-GFRP composite beam.
The experimental studies showed that the shear connection between the concrete slab and GFRP profile has a dominant effect on the synergistic of the composite beam (Neagoe et al., 2015). Among the shear connections, adhesive bonding is widely used to improve the bonding performance of the concrete slabs and GFRP profile (Gonilha et al., 2010). Nordin conducted the bending tests to compare the structural performance of the pure GFRP beam and concrete-GFRP composite beam (Nordin and Taeljsten, 2004). It has shown that with the effective adhesive bonding, the composite beam can prevent the premature buckling of the pure pultruded GFRP profile, thereby significantly increasing the ultimate load of the composite beam. However, as the load increases, the concrete debonds from the GFRP profile and the interface slips, resulting in a decrease in the stiffness of the composite beam. On the other hand, the significant increase in the ultimate load of the composite beam also makes the internal stress of the GFRP profile much larger than that of the pure GFRP beam which is prone to premature buckling. As a result, the composite beam will suffer from the matrix fracture of the GFRP profile.
The numerical simulation is also used to study the mechanism and failure process of the pultruded GFRP profile, which is beneficial for the design of the GFRP profile beam. Alnahal et al.( 2008) treated GFRP and concrete as linear materials and assumed that the interface between concrete and GFRP has a perfect bonding performance. They gave the critical load for elastic buckling of the composite structure but failed to predict the ultimate load. According to Kong et al. (Kong et al., 2018), debonding occurs when the connection reaches shear strength. The research of Yuan et al. (Yuan and Hadi, 2017) showed that with the ignorance of the bond–slip of composite beams, the stiffness and ultimate load of the structure will be overestimated. Wang (Wang et al., 2015) highlights the debonding mechanism of the GFRP concrete composite beams theoretically, which is verified by the tests. Furthermore, Umberto (Umberto et al, 2021) used the cohesive model to simulate the bond–slip of FRP-strengthened concrete beams, and the results were in good agreement with the experimental results. Assuming the pultruded GFRP as a linear material, the composite beam would be damaged by the shear cracking of the concrete slab, which is quite different from the experiments. Thus, the fracture models of the composite material such as Tsai-Hill and Tsai-Wu are introduced to simulate the progressive damage of the pultruded GFRP that are prone to interlayer delamination.
In summary, the nonlinearities of the GFRP composite beam investigated through experimental studies are not adequately addressed in numerical analysis. Moreover, regarding the effects of geometric of the composite cross sections on the ultimate load and the mechanical behavior of the composite beam, more experiments are also required to be carried out. Thus, in this article, a comprehensive finite element model is established in order to provide a better understanding of the progressive debonding and fracture of the composite GFRP beam. The numerical model is developed using the Hashin criteria for pultruded GFRP and a bilinear cohesive model for the adhesive interface of the concrete slab to the GFRP flange. The four-point bending experimental results of the pure GFRP I-beam and the concrete-GFRP composite I-beam provided by Nordin (Nordin H, Taljsten B. 2004) were compared with the numerical simulations to verify the accuracy of the FE model. Furthermore, as a complement to the experimental research, the comprehensive FE model, which allows for a more in-depth study in terms of stress and strain distributions of the composite beam, is used for parametric analysis to investigate the effects of the concrete strength and the cross-section geometry of the composite beam on the mechanical performance of the composite beam. These parametric analyses can provide a numerical basis for the design of the concrete-GFRP composite beam in engineering practice.
The pultruded GFRP profile is prone to premature buckling because of the small elastic modulus of the material. One way to improve the stiffness of pultruded GFRP profiles is to make GFRP laminates by gluing several GFRP sheets. In this case, the mechanical properties of the GFRP laminates depend on the fiber lay-up direction of the sheet. When all fiber directions are the same (Figure 1A), the GFRP sheet exhibits anisotropy, and the stress along the sheet thickness direction cannot be ignored. See
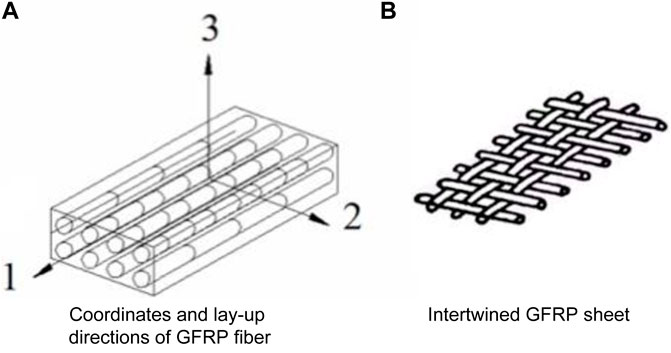
FIGURE 1. Fiber lay-up directions of pultruded GFRP laminates. (A) Coordinates and lay-up directions of GFRP fiber (B) Intertwined GFRP sheet.
If the fibers of each GFRP sheet are intertwined (Figure 1B), the transverse isotropic on a macroscopic scale can be presented. The constitutive relationship can be simplified as follows:
where the flexibility coefficient,
where
According to the principle of symmetry, Eq. 2 can be expressed as follows:
According to the three-dimensional Hashin failure criteria (Hashin and Rotem, 1973; Hashin, 1980; El-Hacha and Chen, 2012; Alnahhal et al., 2008) that can precisely simulate the progressive damage mode of the composite materials by reducing the material engineering elastic constants, the following four failure criteria can be established for the pultruded GFRP (Hashin and Rotem, 1973; Hashin, 1980):
(1) Fiber tensile failure (
(2) Fiber buckling failure (
(3) Matrix tensile failure (
(4) Matrix compression failure (
where f1c and f2c are the compressive strength, f1t and f2t are the tensile strength at directions 1 and 2, σ1, σ2, and σ3 are the principal stresses at directions 1, 2, and 3, respectively, and τij is the shear stress.
In the numerical analysis, the degradation of material stiffness is considered when the failure criteria presented previously are met. The degradation process is simulated by reducing the stiffness coefficient of the material at the finite element integration point. However, the stiffness reduction factors proposed by Tan (Tan, 2016), which are validated by experiments of composite materials (Feng and Aymerich, 2014; Hongliang et al., 2018), are used to model the damage in GFRP laminates, as shown in Table 1, where Q and Qd represent the engineering elastic moduli in undamaged and damaged states, respectively.

TABLE 1. Stiffness degradation model of GFRP.
The concrete slab and the upper flange of the GFRP I-profile are bonded with an adhesive, such as epoxy glue. According to the softening and fracture behavior of the adhesive interface between the concrete and GFRP, the bilinear cohesive model (Blackman et al., 2003; Wang, 2006) is introduced. It can be noticed that based on the cohesive traction–separation law, the mechanical behavior of the adhesive interface includes three stages: 1) Elastic stage: The cohesive stress increases linearly with the displacement until the initial failure criterion is satisfied; 2) Softening stage: After reaching the maximum cohesive strength, the adhesive stress decreases linearly to zero with the increase of the displacement; and 3) Debonding stage: The displacement continues to increase, but the cohesive stress remains zero. In the bilinear cohesive model,
where
The bilinear cohesive model can then be expressed as follows:
where
When the strain energy of the interface reaches the fracture energy, the failure at the interface occurs. The normal and tangential fracture energies are given as follows, respectively:
The damage phenomena of the concrete-GFRP interface are then quantified by the damage factor given as follows:
where
The key parameters of the bilinear cohesive model in the numerical simulation for the bond behavior of the adhesive interface are the initial shear stiffness K0, the maximum shear stress τc, and the interfacial fracture energy Gc. The initial shear stiffness K0 can be modeled as a sequence of the shear stiffness of the adhesive layer and the concrete, expressed as follows:
where the shear stiffness of the adhesive layer is
Comparative static loading tests were carried out by Nordin et al. (Nordin H, Taljsten B. 2004) for a pure GFRP I-beam, Beam A, and a concrete-GFRP composite beam, Beam C. The pure GFRP beam (Beam A) is reinforced with a 3-mm-thick CFRP sheet pasted on the bottom edge. These experiments are the basis for sophisticated numerical simulations and further analysis, to study the effects of material properties and geometric parameters on the mechanical performance of the composite beams. The test specimen subjected to four-point bending is shown in Figure 2, and the elastic moduli and strength of pultruded GFRP profile are represented in Table 1A in the Appendix. The spans for both Beam A and Beam C are l = 3000 mm and the shear span a = 1000 mm, the width and thickness of the concrete slab of Beam C are bc = 120 mm and hc = 115 mm, respectively, the height of the GFRP web is hw = 240 mm, and the total height of Beam C is h. Ribs are added at the loading point to avoid local buckling of GFRP I-profile.
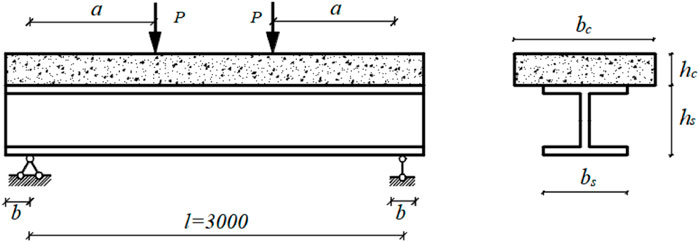
FIGURE 2. Test specimen of the composite beam, Beam C.
In the loading test of Beam A, the concrete began to crack when it was loaded around 80 kN. At 100 kN, local buckling of the upper flange occurred. A strong fracture sound was heard at about 130 kN. Meanwhile, the buckling of the upper flange was increasing. Finally, when the load reached 133 kN, the beam slid off the support. In the loading test of Beam C, when a load of 90 kN was applied, micro cracks were generated at the bottom of the concrete slab, and the cracks were gradually visible as the load increased. At 250 kN, the tension cracks at the bottom of the concrete slab were obvious; when the load reached 292 kN, the concrete slab failed in the shear zone, while two-thirds of the concrete slabs were debonded with GFRP.
The tested beams with the concrete slab, GFRP profile, and adhesive layer between concrete and GFRP are all modeled as different elements in Abaqus. The web and flange of GFRP I-beam are discretized into spatial shell elements (S4R). Considering the anisotropy and softening behavior of pultruded GFRP laminates, the stiffness degradation model based on Hashin failure criteria proposed in Section 2 is implemented by using VUMAT models in Abaqus. In order to simulate the debonding and slipping of the concrete-to-GFRP interface, the interface elements (COH3D8) with zero-thickness by using the bilinear cohesive model are set between the bottom of the concrete slab and the upper flange of the GFRP I-beam. The concrete slab of the composite beam, Beam C, is modeled with linear solid elements (C3D8R), and the plastic damage constitutive model in terms of tensile and compressive damage factors proposed by Oller S, et al. (Oller et al., 1990) is used to simulate the stiffness degradation.
To take into account the contribution of shear deformation to the deflection of the beam, the shear modulus of GFRP, G12 = G13 = 2800MPa, is obtained from the numerical simulation according to the load–displacement response of Beam C.
Obaidat et al. (Obaidat et al., 2010) showed that when CFRP is used for reinforcement, whether the material anisotropy of CFRP was considered or not, it had no significant effect on the results. Therefore, the CFRP reinforcement at the bottom of Beam A is assumed to be isotropic with a modulus of elasticity of 150 GPa. In addition, according to the loading test of Beam A, no damage was observed at the interface of CFRP and CFRP, so GFRP was bound to CFRP in the numerical simulation.
The results of the experimental tests and FE models are shown in Figure 3 and Table 2. In general, the numerical simulations are in good agreement with the experimental tests when considering the softening of GFRP and the bond–slip at the adhesive interface of the composite beam. For the pure GFRP beam, Beam A, the numerical simulations by using the elastic model and fracture model for GFRP are all consistent with the experimental results at the initial stage. As the load increased, the results using the elastic model for GFRP separated from the test result. On the other hand, considering the damage of GFRP and by using the fracture model, the slope of the load–displacement curve decreases slowly, which is still consistent with the experimental phenomenon. It can be seen from Table 2 that when considering the fracture of the GFRP matrix, the relative error of the ultimate load and mid-span deflection with the test results is less than 4%. When ignoring the softening of GFRP, the numerical analysis will overestimate the ultimate load by 23.3% and the mid-span deflection is 7.4% higher than the test results.
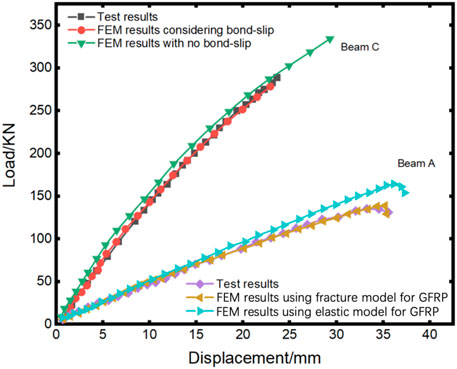
FIGURE 3. Load–displacement curves of Beam A and Beam C.
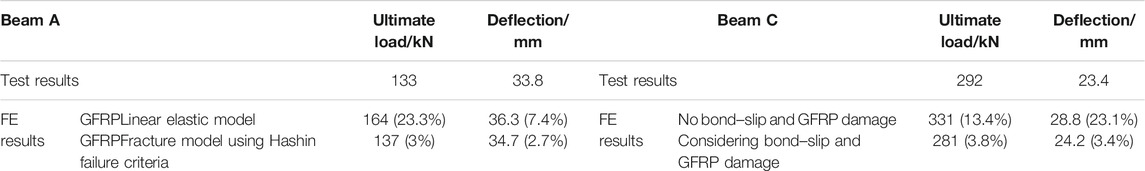
TABLE 2. Comparison of FE results with experimental tests.
Comparing the load–displacement curves for Beam A and Beam C, the flexural stiffness and ultimate load of the beam can be significantly improved by assembling the concrete slabs on the GFRP I-beam. The increase in ultimate load is even around 105%. Neglecting the softening of GFRP, the numerical analysis will overestimate the ultimate load with less effect on the stiffness of the beam. However, ignoring the bond–slip at the interface of the composite beam, Beam C, will overestimate the stiffness of the structure. According to Table 2, the relative error of the mid-span deflection is about 23.1%.
The damaged nephogram of the pure GFRP I-beam (Beam A) is shown in Figure 4A, where SDV2 is the compressive damage factor of the fiber matrix. The numerical analysis shows that the failure mechanism of Beam A is the buckling of the web and upper flange of the GFRP I-profile. The analysis also illustrates that the bottom of the web at middle span of the shear zone of Beam A was in tension when the beam was loaded up to 82.3 kN, and the stress concentration took place at the loading point while the matrix of GFRP was cracking. This is why in the experimental tests, Beam A made a “split” sound when the beam was loaded to about 80 kN. The simulation results are consistent with the experimental phenomenon, that is, when the beam was loaded to about 80 kN, buckling occurred at the GFRP flange.
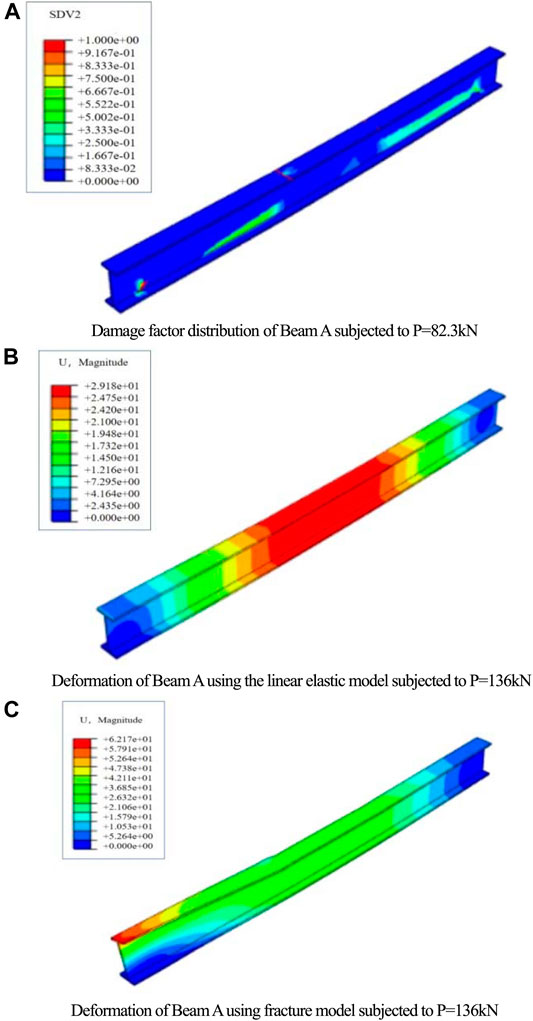
FIGURE 4. Damage and deformation simulations of Beam A, where U is the vertical displacement of the element. (A) Damage factor distribution of Beam A subjected to p = 82.3 kN. (B) Deformation of Beam A using the linear elastic model subjected to p = 136 kN. (C) Deformation of Beam A using the fracture model subjected to p = 136 kN.
Figures 4B,C clarify the influence of the nonlinear damage of GFRP on the deformation of Beam A. When approaching the ultimate load, it can be observed that the deformation of the beam with the considered material damage is no longer symmetric, and local buckling occurs at the loading point, while the deformation of the beam under the linear elastic models remains symmetrical. It can be seen from Figures 3, 4 that the wooden ribs on the beam web strengthen the beam stiffness, resulting in the load still increasing after the upper flange of Beam A buckled.
The numerical analysis of Beam C shows that the micro-cracks appear first at the bottom of the concrete slab in the bending area and support area. As the load increases, concrete cracks continue to expand, as shown in Figure 5. However, few matrix damage of the GFRP web is found in the shear span, which has little effect on the bending stiffness of the composite beam. Figure 6 shows the damage factor distribution at the interface of Beam C where “QUAOSCRT” represents the quadratic traction damage initiation criterion for cohesive surfaces. It can be seen that the interface damage starts from the end of the shearing spans and extends to the mid-span of the beam. When the cracking energy at the interface is reached, the concrete slab and the GFRP flange debonded. The debonding process is simulated using the element killing technology. During the nonlinear analysis, the adhesive element at the interface will be killed when its strain energy met the fracture energy of the bilinear cohesive model. Then, the killed element is removed directly, and the FE model is renumbered. As shown in Figures 6, 7A, the debonding extends from the end of the concrete slab to the mid-span. The simulation results are consistent with the failure phenomena of composite beams observed by Nordin (Figure 7 of Nordin, H., and Taeljsten, B., 2004).
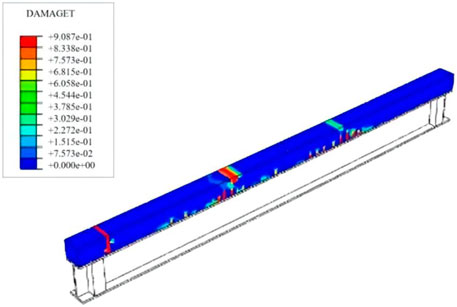
FIGURE 5. Cracking at the concrete slab of Beam C subjected to p = 82 kN, where DAMGET is the tensile damage factor.
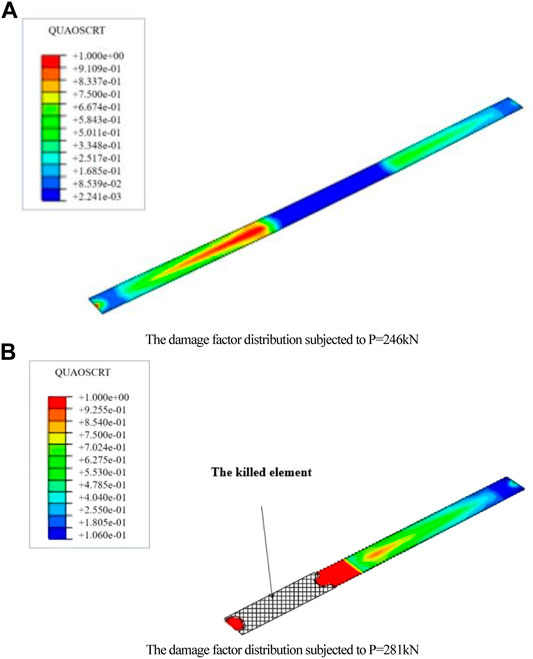
FIGURE 6. Damage factor distribution at the interface of Beam C. (A) Damage factor distribution subjected to p = 246 kN. (B) Damage factor distribution subjected to p = 281 kN
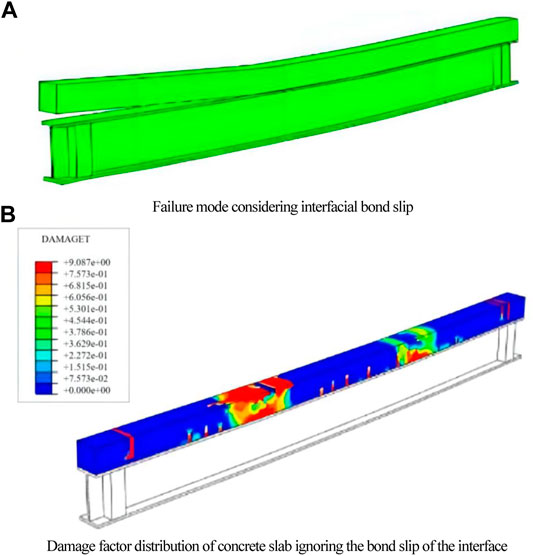
FIGURE 7. Failure mode of Beam C. (A) Failure mode considering interfacial bond–slip. (B) Damage factor distribution of the concrete slab ignoring the bond–slip of the interface.
Ignoring the interfacial bond–slip of the composite beam as well as the softening of GFRP, the damage factor distribution of the concrete slab is shown in Figure 7B. It can be seen that the shear failure occurred in the concrete slab eventually, and there is no debonding at the interface. The simulated result is different from the test.
In conclusion, the softening and nonlinear damage of GFRP and the bond–slip of the interface have significant influence on the numerical simulation of concrete-GFRP composite beams. The good agreement between the aforementioned numerical analysis and the experimental tests indicates that the GFRP damage model used in this study based on the Hashin failure criterion and the cohesive element used for the concrete-to-GFRP interface can well simulate the mechanical properties of the concrete-GFRP composite beam.
The comparison between the numerical simulation and the experimental tests in Section 4 has indicated the accuracy of the finite element models for the composite beam. The parametric analysis, including the effects of the strength and thickness of the concrete slab, the width ratio of the concrete slab to the GFRP flange, the shear-span ratio of the composite beam, and the GFRP web height are further analyzed to provide basis for the design of the composite beam. The diagram of the composite beam for parametric analysis is similar to Figure 2.
A total of five concrete slabs with different compressive strengths of C30 (B1-1), C40 (B1-2), C50 (B1-3), C60 (B1-4), and C70 (B1-5) are selected to analyze the effect of concrete strength on the mechanical properties of the composite beam, and the results are represented in Figure 8. The numerical results show that the increasing of the strength of the concrete slab has a limited influence on the stiffness and ultimate load of composite beams, as shown in Figure 8A. When having a low concrete strength, such as B1-1 with C30 and B1-2 with C40, the bonding stress at the interface between the concrete slab and GFRP flange leads to the bending failure of the concrete slab. Cracking at the bottom of the concrete slab results in an inflection point in the load–displacement curve. However, high compressive strength may change the failure mode of composite beams, as shown in Figure 8B. When the strength of concrete is too high, such as C70, the concrete slab will undergo longitudinal shear failure in the shear-span area. Consequently, the neutral axis of the beam will move up, thereby reducing the ultimate load of the composite beam.
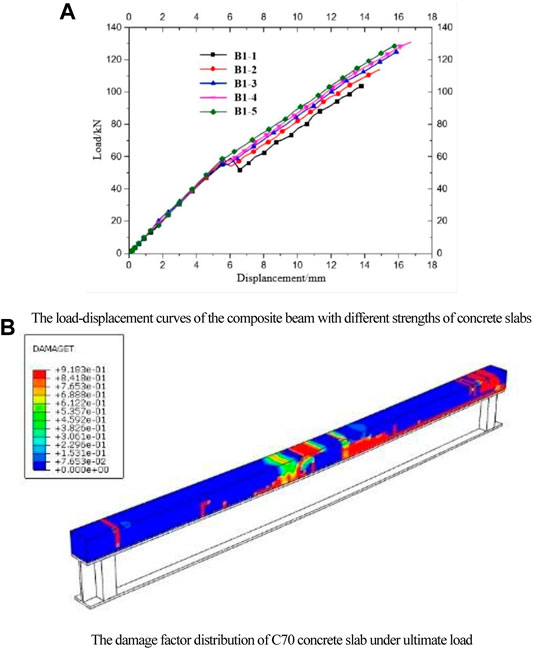
FIGURE 8. Effect of concrete strength on the mechanical properties of the composite beam. (A) Load–displacement curves of the composite beam with different strengths of concrete slabs. (B) Damage factor distribution of the C70 concrete slab under ultimate load.
The influence of the concrete slab thickness on the structural performance of the composite beam is shown in Figure 9A. In this figure, B2-1, 2, 3, and 4 represent slabs with thicknesses of 30, 60, 90, and 115 mm, respectively. It can be found that the thickness of the concrete slab has a significant impact on the flexural stiffness and the ultimate load of the composite beam comparing to the slab strength. In general, the load capacity increases with the thickness of the concrete slab. However, when the thickness of concrete is too large, such as B2-4 being 115 mm, the neutral axis of the cross section will move up to the concrete slab, resulting in the tension cracks in the slab. As a result, the bearing capacity of the composite beam is greatly reduced.
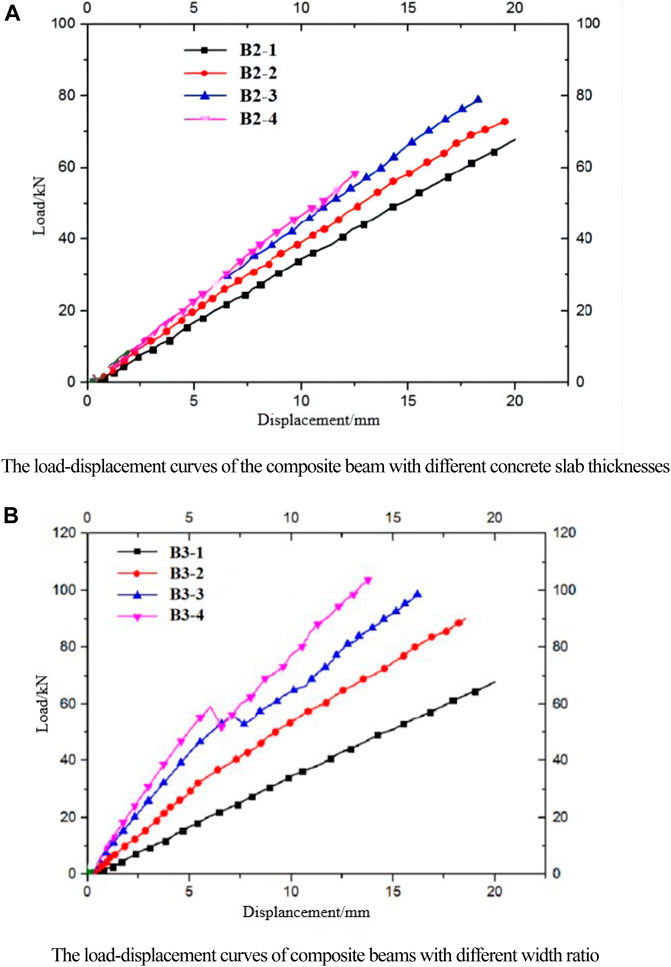
FIGURE 9. Effects of the width ratio and thicknesses of the concrete slab on the load performance of the composite beam. (A) Load–displacement curves of the composite beam with different concrete slab thicknesses. (B) Load–displacement curves of composite beams with different width ratios.
The influence of the width ratio of the concrete slab to the GFRP flange, bc/bw, on ultimate load is also investigated and shown in Figure 9B, where the values of bc/bw are 1, 1.5, 2, and 2.5 for B3-1, B3-2, 2 B3-3, and B3-4, respectively.
In Figure 9B, it can be seen that if bc/bw ≤ 2, as the width ratio increases, the ultimate load and flexural stiffness of composite beams increase. As shown in Figure 10A, the flexural failure of the composite beams can be observed, that is similar to that of over-reinforced beams. If bc/bw > 2, as shown in Figure10B, the transverse shear failure takes place on the concrete slab near the support area, and longitudinal shear failure can be found in the shear span. Compared with the width ratio bc/bw = 2, the ultimate load is reduced by about 7% when bc/bw = 2.5. It can be concluded that the width ratio of the concrete slab to GFRP flange should be controlled within a reasonable range.
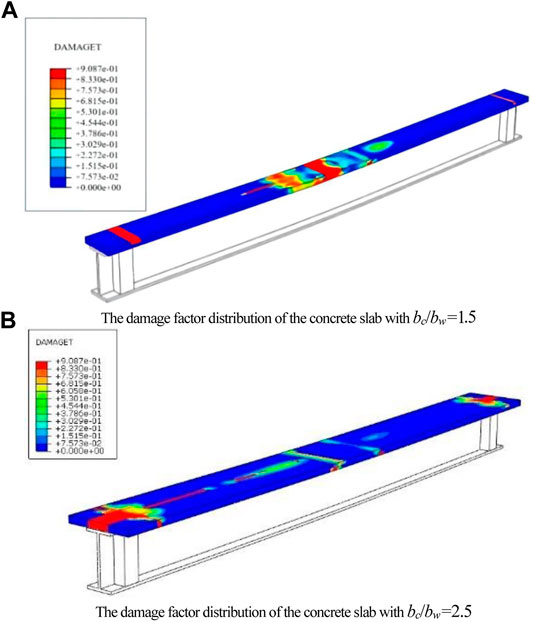
FIGURE 10. Damage factor distribution of the concrete slab with different width ratios. (A) Damage factor distribution of the concrete slab with bc/bw=1.5. (B) Damage factor distribution of the concrete slab with bc/bw=2.5.
The influence of shear-span ratio on the performance of the composite beams is also analyzed by varying the position of loading point a. The results are illustrated in Figure 11. In this figure, B4-1, 2, 3, and 4 represent the shear-span ratios of 0.84, 1.69, 2.52, and 3.36, respectively. It can be found that the ultimate loads of the composite beams decrease with the increase of the shear-span ratio, and there are inflexion points in all load–displacement curves, which express the first bending crack in the concrete slab.
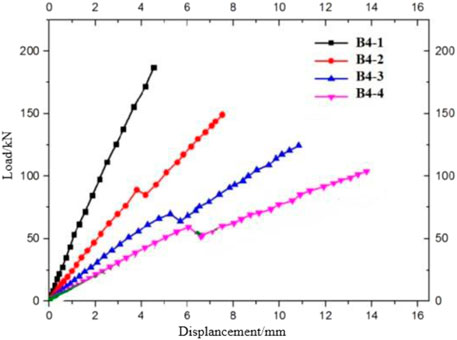
FIGURE 11. Load–displacement curves of composite beams with different shear-span ratios.
As shown in Figure 12, when the composite beams reach the ultimate load, the concrete at the loading point is crushed. With the increase of the shear-span ratio, the failure mode of the composite beam changes from shear failure to bending failure. When the shear-span ratio is 0.84 (B4-1), the concrete slab suffers shear failure, and GFRP webs crack at the supports, as shown in Figure 12A. When the shear-span ratio is 1.69 (B4-2), the composite beam undergoes interlaminar shear failure on the GFRP web, as shown in Figure 12B. Since the shear performance of the GFRP web is crucial for composite beams, it is beneficial in practice to strengthen the web by adding GFRP sheets along the web diagonal. According to Figure 12C, the increase of the shear-span ratio (B4-3) leads to the stress concentration at the connection between the flange and the web of the GFRP I-beam, resulting in the damage of the GFRP matrix in this area. This analysis explains why a continuous sound was heard in the GFRP profile when the load was close to the ultimate value during the experimental test. The sound was caused by the GFRP matrix fracture.
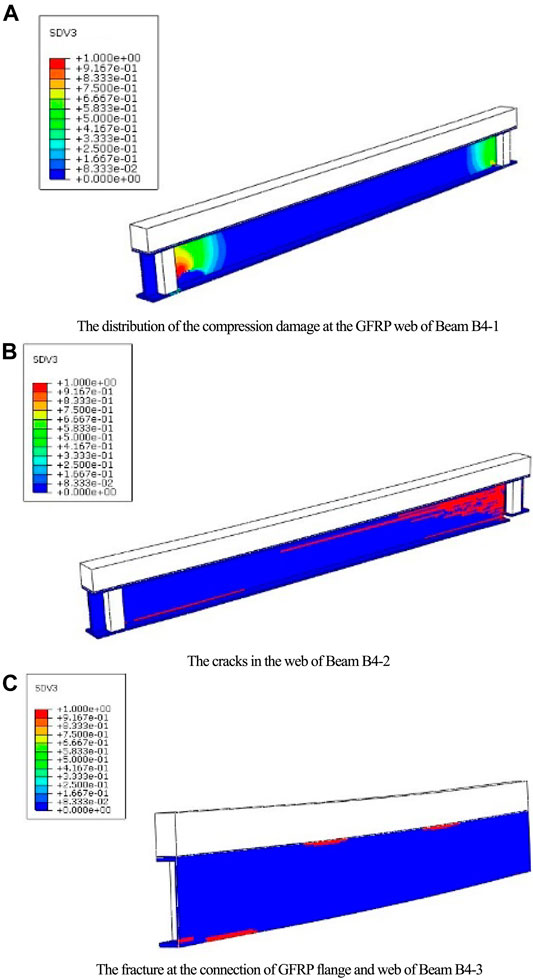
FIGURE 12. Influence of the shear-span ratio on the failure mode of Beam C, where SDV3 is a tensile damage factor of the GFRP matrix. (A) Distribution of the compression damage at the GFRP web of Beam B4-1. (B) Cracks in the web of Beam B4-2. (C) Fracture at the connection of the GFRP flange and web of Beam B4-3.
Keeping the thickness of the concrete slab constant, such as 115 mm, the effect of the height of the GFRP web was investigated. The results are shown in Figure 13, where B5-1 and B5-2 are the composite beams with the web height of 276 and 336 mm, respectively. When the height of the GFRP I-beam web is small, such as B5-1 is 276 mm, with the increase of the load, the concrete slab gradually enters the plasticity, and the neutral axis of the section moves down. In addition, the stress distribution of the concrete slab is changing from linear to rectangular. At the same time, the bond–slip at the interface between the concrete slab and the GFRP flange causes the inflection points in both the stress and strain curves in Figure 13. Moreover, from Figure 13B, it can be inferred that the bending of the concrete slab is similar to that of the GFRP I-profile since the slope of the strain curve on the upper side of the deflection point is close to the lower side. This means that the plane section assumption of the Bernoulli–Euler beam is available for the composite beam with a small web height.
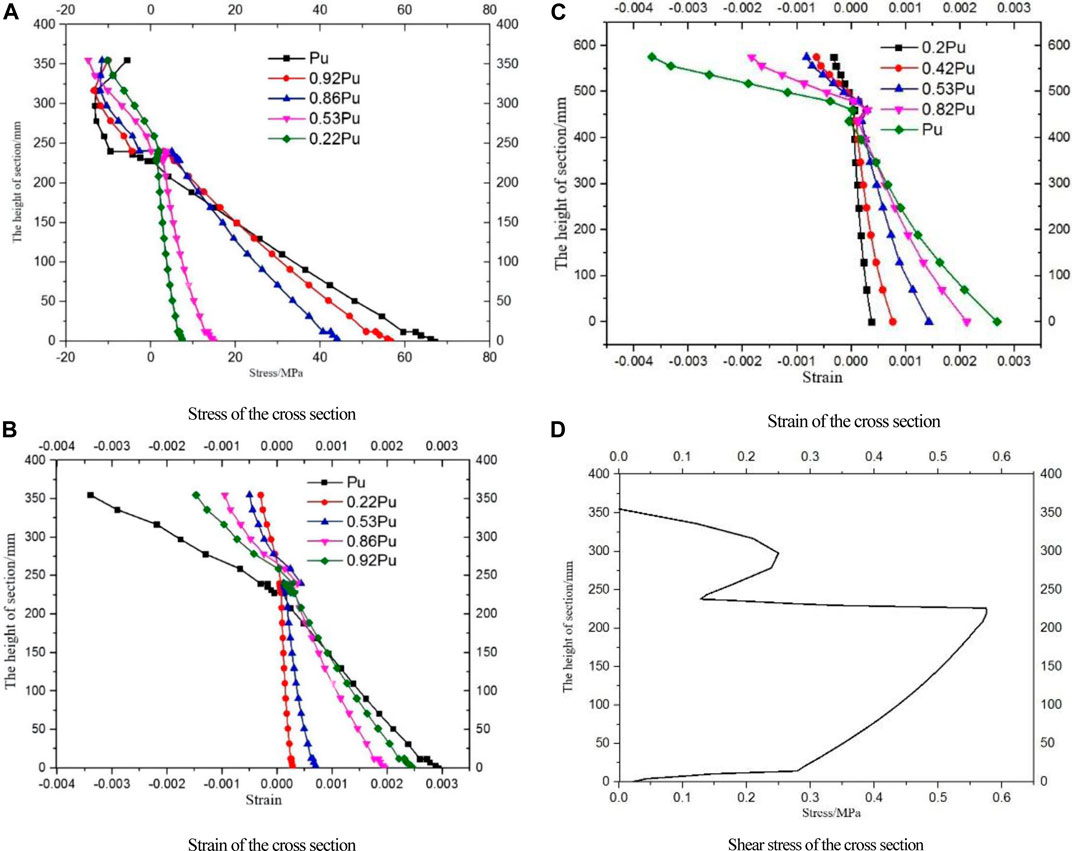
FIGURE 13. Stress and strain of the cross section at the mid-span of Beam B5-2. (A) Stress of the cross section at the mid-span of B5-1. (B) Strain of the cross section at the mid-span of B5-1. (C) Strain of the cross section at the mid-span of Beam B5-2. (D) Shear stress of the cross section at the mid-span of Beam B5-2.
In contrast, the stress–strain distribution of the mid-span section of B5-2 with a web height of 336 mm is quite different from that of B5-1. As shown in Figure 13C, the curvature of the concrete slab is much larger than that of the GFRP I profile, and the plane section assumption no longer applies. As can be seen from Figure 13D, the web of the GFRP I-profile bears most of the shear stress of the entire section. Considering the height of the GFRP web, the additional deflection caused by shear deformation cannot be ignored. In addition, large shear stress will lead to shear failure of the GFRP web. As the shear stress increases, the GFRP web starts to crack from the left end of the support, and the crack expands from the edge of the beam to the mid-span of the beam. The composite beam is damaged due to the shear failure of the web, as shown in Figure 1A in Appendix.
A comprehensive FE model was proposed to investigate the structural behavior of concrete-GFRP composite I-beam. The Hashin failure criteria was used regarding the fracture and delamination of the pultruded GFRP matrix, and the bilinear cohesive model was adopted considering the bond–slip behavior of the interface between the concrete slab and the GFRP flange. The main conclusions can be drawn as follows:
1) The nonlinearities of GFRP and the interface have essential effects on the structural performance of composite beams. The results when considering GFRP as a linear material do not agree with the experimental tests. However, the anisotropy softening and fracture procession of pultruded GFRP and the bond–slip behavior analysis of the concrete-to-GFRP interface developed in this article can effectively simulate the damage of GFRP and the degradation of adhesive interface.
2) Compared with concrete strength, increasing the thickness and width of the concrete slab can significantly improve the stiffness and ultimate load of composite beams. However, when the thickness and width of the concrete slab are too large, the slab will suffer shear failure, thereby reducing the bearing capacity of the composite beam. Therefore, reinforcement in the concrete slab should be considered in practical application.
3) When the shear-span ratio is small, the composite beams will be damaged by the shear failure of the concrete slab. As the shear-span ratio increases, the GFRP web is prone to cracking due to the weak interlaminar shear strength of the GFRP matrix. Therefore, it is recommended to improve the strength of the beam by reinforcing the GFRP web.
4) The height of the web has a significant influence on the shear stress distribution and deformation of the composite beam. The composite beam with smaller height can be considered satisfying the plane-section assumption. While, for beams with large height, the assumption is not applicable, and the additional deflection caused by shear deformation must be considered.
In summary, the numerical studies here have shown that the structural behavior of concrete-GFRP composite beams is related to the nonlinearity of pultruded GFRP and adhesive materials as well as the geometric parameters of the composite section and deserves further study. More experimental tests and comparisons with the numerical results are needed to improve the practical design accuracy of GFRP composite beams.
The raw data supporting the conclusion of this article will be made available by the authors, without undue reservation.
The authors confirm contribution to the article as follows: ZC and XZ: study conception and design; ZC and JX: analysis and interpretation of results; ZC and QL: formula derivation and programming and ZC and XZ: draft manuscript preparation. All authors reviewed the results and approved the final version of the manuscript.
This research was supported by the National Key R and D Program of China (Grant No. 2021YFF0500804).
The authors declare that the research was conducted in the absence of any commercial or financial relationships that could be construed as a potential conflict of interest.
All claims expressed in this article are solely those of the authors and do not necessarily represent those of their affiliated organizations, or those of the publisher, the editors, and the reviewers. Any product that may be evaluated in this article, or claim that may be made by its manufacturer, is not guaranteed or endorsed by the publisher.
Alnahhal, W., Aref, A., and Alampalli, S. (2008). Composite Behavior of Hybrid Frp-concrete Bridge Decks on Steel Girders. Compos. Structures 84 (1), 29–43. doi:10.1016/j.compstruct.2007.06.005
Blackman, B., Hadavinia, H., Kinloch, A. J., and Williams, J. G. (2003). The Use of a Cohesive Zone Model to Study the Fracture of Fiber Composites and Adhesively-Bonded Joints. Int. J. Fracture 119 (1), 25–46. doi:10.1023/A:1023998013255
Borowicz, D. T., and Bank, L. C. (2009). Behavior of Pultruded Fiber-Reinforced Polymer (FRP) Beams Subjected to Concentrated Loads in the Plane of the Web. Second Official International Conference of International Institute for FRP in Construction for Asia-Pacific Region, 13–18. Seoul.
Borowicz, D. T., and Bank, L. C. (2011). Behavior of Pultruded Fiber-Reinforced Polymer Beams Subjected to Concentrated Loads in the Plane of the Web. J. Composites Construction 15 (2), 229–238. doi:10.1061/(ASCE)CC.1943-5614.0000082
Chen, Z., Wei, C., and Luo, Q. (2019). Analysis on Mechanical Properties of FRP Retrofitted concrete Beam-Column Structure Using Cohesive Model[J]. J. Building Structures 201940 (09), 122–130.
Correia, J. R., Branco, F. A., and Ferreira, J. G. (2007). Flexural Behaviour of GFRP-concrete Hybrid Beams with Interconnection Slip. Compos. Structures 77 (1), 66–78. doi:10.1016/j.compstruct.2005.06.003
El-Hacha, R., and Chen, D. (2012). Behaviour of Hybrid FRP–UHPC Beams Subjected to Static Flexural Loading. Composites B: Eng.. doi:10.1016/j.compositesb.2011.07.004
Feng, D., and Aymerich, F. (2014). Finite Element Modelling of Damage Induced by Low-Velocity Impact on Composite Laminates. Compos. Structures 108 (feb.), 161–171. doi:10.1016/j.compstruct.2013.09.004
Gand, A. K., Chan, T.-M., and Mottram, J. T. (2013). Civil and Structural Engineering Applications, Recent Trends, Research and Developments on Pultruded Fiber Reinforced Polymer Closed Sections: a Review. Front. Struct. Civ. Eng. 7 (3), 227–244. doi:10.1007/s11709-013-0216-8
Gonilha, J. A., Aquino, A., Correia, J. R., and Branco, F. A. (2010). Experimental Evaluation of the GFRP/ECC Connection – Shear Connection Tests: Phase 1. ICIST Internal Project Report A5.T4.IST.1. Nanjing, China: Instituto Superior Técnico, Technical University of Lisbon.
Hashin, Z. (1980). Fatigue Failure Criteria for Unidirectional Fiber Composites. J. Appl. Mech. 47. doi:10.1115/1.3153664
Hashin, Z., and Rotem, A. (1973). A Fatigue Failure Criterion for Fiber Reinforced Materials. J. Compos. Mater. 7 (4), 448–464. doi:10.1177/002199837300700404
Hongliang, T., Xiaoping, M. A., Zhixian, L. U., Aeronautics, S. O., University, N. P., and University, N. P. (2018). A Model for Low Velocity Impact Damage Analysis of Composite Laminates Based on Continuum Damage Mechanics. Acta Materiae Compositae Sinica. doi:10.13801/j.cnki.fhclxb.20180103.001
Keller, T. (2001). Recent All-Composite and Hybrid Fiber-Reinforced Polymer Bridges and Buildings. Prog. Struct. Eng. Mater. 3. doi:10.1002/pse.66
Kong, S. Y., Yang, X., and Lee, Z. Y. (2018). Mechanical Performance and Numerical Simulation of GFRP-concrete Composite Panel with Circular Hollow Connectors and Epoxy Adhesion. Construction Building Mater. 184 (SEP.30), 643–654. doi:10.1016/j.conbuildmat.2018.07.008
Neagoe, C. A., Lluis, P., Marco, L., and Pérez, M. A. (2015). Experimental Study of GFRP-concrete Hybrid Beams with Low Degree of Shear Connection. Construction Building Mater. 101 (Dec.30 Pt.1), 141–151. doi:10.1016/j.conbuildmat.2015.10.024
Nordin, H., and Täljsten, B. (2004). Testing of Hybrid FRP Composite Beams in Bending. Composites Part B: Eng. 35 (1), 27–33. doi:10.1016/j.compositesb.2003.08.010
Obaidat, Y. T., Heyden, S., and Dahlblom, O. (2010). The Effect of CFRP and CFRP/concrete Interface Models when Modelling Retrofitted RC Beams with Fem. Compos. Structures 92 (6), 1391–1398. doi:10.1016/j.compstruct.2009.11.008
Oller, S., Onate, E., Oliver, J., and Lubliner, J. (1990). Finite Element Nonlinear Analysis of concrete Structures Using a "Plastic-Damage Model". Eng. Fracture Mech. 35 (1-3), 219–231. doi:10.1016/0013-7944(90)90200-Z
Tan, S. C. (2016). A Progressive Failure Model for Composite Laminates Containing Openings. J. Compos. Mater.. doi:10.1177/002199839102500505
Umberto, D. M., Fabrizio, G, Lorenzo, L, Paolo, N B, and Andrea, P (2021). An Investigation about Debonding Mechanisms in FRP-Strengthened RC Structural Elements by Using a Cohesive/volumetric Modeling Technique. Theor. Appl. Fracture Mech. 117. doi:10.1016/j.tafmec.2021.103199
Wang, J. (2006). Cohesive Zone Model of Intermediate Crack-Induced Debonding of Frp-Plated concrete Beam. Int. J. Sol. Structures 43 (21), 6630–6648. doi:10.1016/j.ijsolstr.2006.01.013
Wang, J., Zou, X., and Feng, Y. (2015). Bilinear Load-Deflection Model of Fiber-Reinforced Polymer–concrete Composite Beam with Interface Slip. Adv. Mech. Eng. 7 (7), 1687814015590312. doi:10.1177/1687814015590312
Yuan, J. S., and Hadi, M. N. S. (2017). Bond-slip Behaviour between GFRP I-Section and concrete. Composites Part B: Eng. 130 (dec.), 76–89. doi:10.1016/j.compositesb.2017.07.060
Zou, X., Feng, P., and Wang, Ji. (2018). Bolted Shear Connection of FRP-concrete Hybrid Beams. J. Composites Construction. doi:10.1061/(asce)cc.1943-5614.0000845
FIGURE A1: Shear failure at the GFRP web of Beam B5-2.
TABLE A1: Elastic modulus and strength of the pultruded GFRP profile for the test beam.

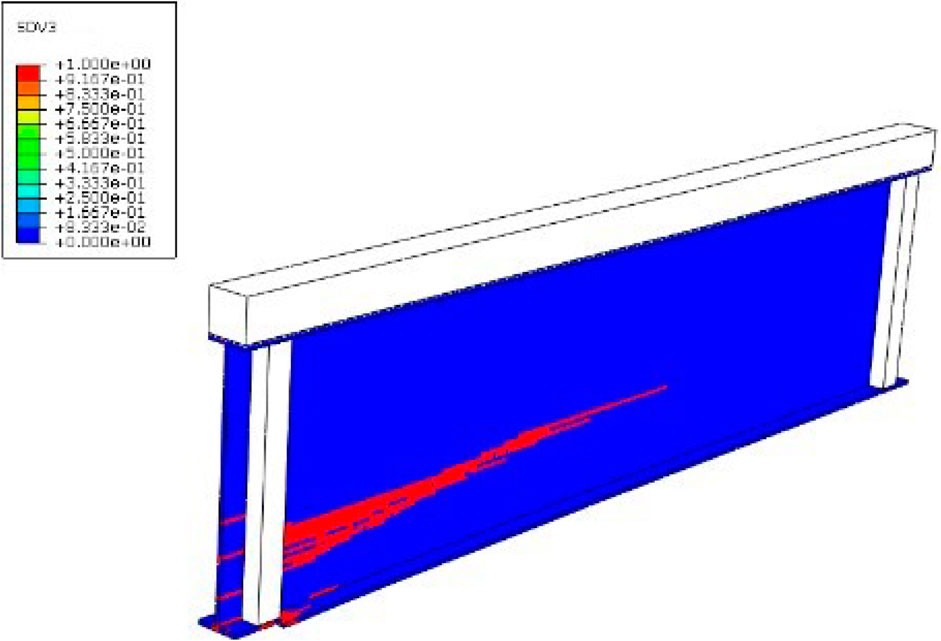
FIGURE A1
Keywords: GFRP-concrete composite beam, Hashin failure criteria, bilinear cohesive model, bond–slip, anisotropy
Citation: Chen Z, Xing J, Luo Q and Zhang X (2022) Numerical Analysis of Structural Performance of Concrete-GFRP Composite I-Beam. Front. Mater. 9:844393. doi: 10.3389/fmats.2022.844393
Received: 28 December 2021; Accepted: 09 February 2022;
Published: 16 March 2022.
Edited by:
Fangying Wang, University of Nottingham, United KingdomReviewed by:
Jian Weng, Building and Construction Authority, SingaporeCopyright © 2022 Chen, Xing, Luo and Zhang. This is an open-access article distributed under the terms of the Creative Commons Attribution License (CC BY). The use, distribution or reproduction in other forums is permitted, provided the original author(s) and the copyright owner(s) are credited and that the original publication in this journal is cited, in accordance with accepted academic practice. No use, distribution or reproduction is permitted which does not comply with these terms.
*Correspondence: Xiaoyue Zhang, eGlhb3l1ZXpoYW5nQGNxdS5lZHUuY24=
Disclaimer: All claims expressed in this article are solely those of the authors and do not necessarily represent those of their affiliated organizations, or those of the publisher, the editors and the reviewers. Any product that may be evaluated in this article or claim that may be made by its manufacturer is not guaranteed or endorsed by the publisher.
Research integrity at Frontiers
Learn more about the work of our research integrity team to safeguard the quality of each article we publish.