- Institute for Chemicals and Fuels from Alternative Resources (ICFAR), Department of Chemical and Biochemical Engineering, Faculty of Engineering, Western University, London, ON, Canada
This study proposes the conversion of waste corn grains contaminated by deoxynivalenol (also known as vomitoxin), a mycotoxin produced by plant pathogens, into a value-added product. Batches of 500 g of contaminated corn grains were pyrolyzed in a batch reactor by thermal treatment at temperatures up to 500°C with a 15°C/min heating rate and generating condensable vapors, gases and solid bio-char. The bio-char produced was subsequently activated in a furnace at 900°C, using CO2 as an activation agent, at different residence times. The effect of activation residence time on the characteristics of the activated bio-char, varying it from 0.5 to 3 h, was investigated. Characterization tests included BET surface area, SEM, TG-FTIR, pH, and XRD on both bio-char and activated bio-char. BET results illustrated a significant increase of the surface area from 63 to 419 m2g−1 and pore volume from 0.04 to 0.23 cm3g−1 by increasing the activation time from 0.5 to 3 h. SEM images visually confirmed a considerable increase in pore development. The pH significantly increased from 6 to 10 after activation, due to the elimination of acidic functional groups. The proximate analysis showed the stable carbon of the activated char reaching approximately 90 wt%, making it promising for catalyst/adsorbent applications. The adsorption performance of activated bio-char was tested by utilizing three different model molecules with different characteristics: methylene blue, methyl orange, and ibuprofen. Among all activated bio-char samples, activated bio-char with 3 h activation time showed the highest adsorption capacity, with a total adsorption (25 mg/g of activated bio-char) of methylene blue after 5 min. The results showed that the adsorption capacity of the activated bio-char was similar to that of valuable commercial activated carbon.
Introduction
Deoxynivalenol (DON) (also called vomitoxin) is a mycotoxin substance caused by pathogens. The contamination of corn grains with DON frequently occurs around the world due to high humidity. It threatens both human and animal health, causing food refusal, vomiting and abdominal pain. It also affects the economy due to large amount of contaminated corn requiring landfill disposal (Karami, 2021). The periodic availability of large quantities of inedible corn grains contaminated by vomitoxin creates an opportunity to investigate alternative value-added uses for this product.
Conversion of contaminated biomass into bio-char via pyrolysis is a well-known technology for solid waste management. Due to its specific physical (e.g. high surface area) and chemical properties (e.g. various functional groups and high stable carbon), bio-char is an excellent candidate for adsorption processes (Enaime et al., 2020; Liang et al., 2021). Bio-char physico-chemical characteristics mainly depend on the type of biomass and pyrolysis process conditions. Pyrolysis is a thermochemical process occurring under anaerobic conditions at temperatures between 300 and 600°C. It is generally classified as slow or fast pyrolysis (Sajjadi et al., 2019). Slow pyrolysis occurs at temperatures lower than 450°C with long feedstock residence times in the reactor (5 min to hours) which favor higher bio-char yields. On the other hand, fast pyrolysis is achieved at short residence times (0.5–3 s) and at temperatures around or higher than 500°C (Papari and Hawboldt, 2015).
Activated bio-char represents one of the most attractive applications of bio-char, due to its high surface area, thermal stability, relatively low cost, and a porous structure with high reactivity with a wide range of surface functional groups (Canales-Flores and Prieto-García, 2016). The activation process can be chemical, physical, or a combination of both (Ioannidou and Zabaniotou, 2007). Studies (Yin et al., 2007; Hadi et al., 2015; Mohammad-Khah and Ansari, 2009; Tan et al., 2017) show the promising application of physically activated bio-char for adsorption processes.
Increased water pollution due to population and industrial growth is becoming one of the main global issues (Liang et al., 2021). Water contaminates are generally categorized into organic and inorganic pollutants, including dyes, phenolic compounds, surfactants, metals (arsenic, cadmium, mercury), nitrates, nitrites and pharmaceuticals. Most of these pollutants are persistent in nature causing environmental and health problems (Enaime et al., 2020). Among wastewater treatment techniques, such as reverse osmosis, advanced oxidation, adsorption, membrane filtration, biodegradation, solvent extraction, and chlorination, adsorption has been considered as an easy, efficient and cost-effective method for decontamination of water (Enaime et al., 2020; Tagliaferro, 2020; Luo et al., 2022).
Traditionally, adsorption has been performed using activated carbon derived chiefly from fossil resources (Ahmed, 2016; Gopu et al., 2018). Although the activated carbons produced from fossil resources are successfully used for their good adsorption performance (Ahmed, 2016; Gopu et al., 2018), using these activated carbons has two downsides: the limitation of fossil resources and the unsustainability of the activated carbon. Recently, adsorption processes using activated carbons from alternative resources have gained special attention.
Table 1 summarizes studies that employed activated carbon sourced from renewable resources for the adsorption of dye and aluminium from aqueous phase. Muhtaseb et al. (Ahmed, 2016) studied the adsorption of aluminum on bio-char produced from date pits and physically activated at 700°C with CO2. The results show the maximum adsorption capacity of 5.83 mg/g of Al from a solution with the initial concentration of 3–390 mg/L, dosing 2 g/L of activated adsorbent at a pH of 4 and for 24 h of contact time. In another study (Gopu et al., 2018), municipal solid waste (MSW) activated bio-char was used for removing methylene blue from water. The material was activated at 900°C with CO2 as activation agent. The maximum adsorption capacity was 327 mgdye/gchar with a 248.4 m2/g activated specific surface area.

TABLE 1. Comparison of adsorption capacity of methylene blue using activated biochar from different types of biomass.
The main objective of this work was to investigate the use of wastes, derived from renewable and sustainable resources, and, specifically, contaminated corn, to produce value-added activated bio-chars offering adsorption performance characteristics similar to those of their fossil-derived counterparts. This study is unique in terms of using a non-edible toxic corn and production of a value-added product which can compete with conventional adsorbents.
Materials and Methods
Feedstock Characterization
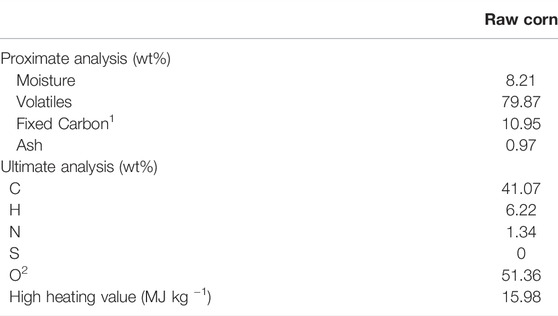
Grain Farmers of Ontario (GFO), Guelph, Ontario, Canada provided field contaminated corn grain as a feedstock for this study. The concentration of deoxynivalenol (DON) in the raw feedstock was measured by SGS Canada Inc., Hensall, Ontario using an Enzyme-Linked Immunoassay (ELISA), Diagnostix, EZ-TOX DON (with a detection limit 0.5 ppm) and was found to be between 5 and 7 ppm. The proximate analysis showed the amount of volatile matter (VM), fixed carbon (FC), and ash content based on ASTM D1762. Ultimate analysis was conducted to determine carbon, hydrogen, nitrogen, and oxygen content, using Thermo Flash EA 1112 elemental analyzer (CHNSO) (Table 2).
Pyrolysis Reactor
Slow pyrolysis experiments were carried out in a batch mechanically mixed reactor equipped with a paddle mixer rotating at 30–40 rpm, as shown in Figure 1. The reactor consists of a 316 stainless steel horizontal cylinder 33 cm long, and 20 cm in internal diameter, with a capacity of 8.5 L. An induction furnace (5–100 kW, Superior Induction Company, CA, United States) with an on-off controller was used to heat the reactor. The pressure inside the reactor was measured using a pressure gauge (max 15 psi) connected to a pressure release valve (McMaster-Carr, Cleveland, OH, United States). A stainless-steel shell and tube condenser kept in a water bath filled with tab water and used to collect condensable vapours (bio-oil). Non-condensable gases exiting the condenser would then pass through a cotton filter to collect the residual mist, and eventually be directed to the exhaust line.
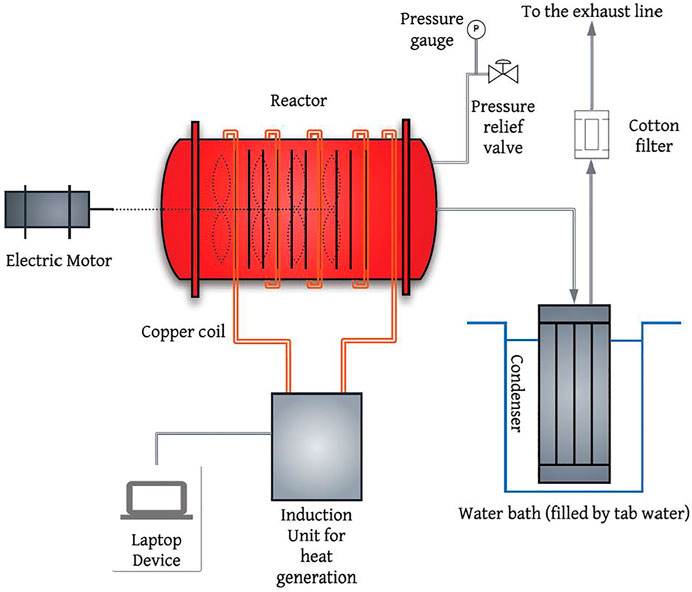
FIGURE 1. Process Flow Diagram (PFD) of mechanically mixed reactor (adapted from (Karami, 2021)).
Activation Furnace
To investigate the adsorption potential of bio-char as an alternative to commercial activated carbons derived from fossil fuels, samples of bio-char were physically activated using an SS316 tubular reactor with 5 cm O.D and 100 cm long. A 240 V electric tube furnace (Lindberg/Blue M, Ashville, United States) was used to heat the activation unit. The reactor was equipped with a built-in temperature control system (Figure 2). The bio-char activation experiments were performed in the tube furnace reactor at 900°C using a sweeping CO2 flowrate of 0.5 L/min, as recommended based on a previous study (Gopu et al., 2018). In each experiment, 50 g of bio-char was loaded into the furnace. Once the furnace reached 900°C, it was maintained at that temperature for holding times of 0.5, 1, 2, or 3 h.
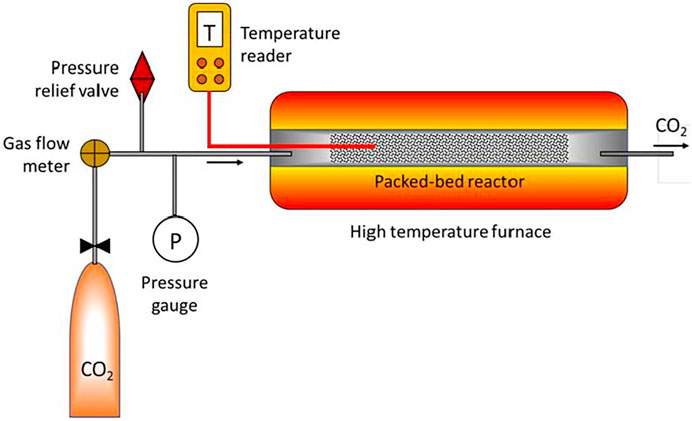
FIGURE 2. Scheme of physical activation unit, activation occurred at 900°C using a sweeping CO2 flowrate of 0.5 L/min for holding times of 0.5, 1, 2, or 3 h (adapted from (Singh, 2019)).
Activated Bio-Char Characterization Methods
Surface Area (BET)
The Brunauer-Emmett-Teller (BET) method was used to evaluate the surface area of bio-char and activated bio-char samples. For this purpose, a Nova 1200e Surface Area and Pore Size Analyzer (Quantachrome Instrument, FL, United States) was used. 0.3 g of each sample were subjected to tests by nitrogen gas sorption at 77.35 K. After that, the samples were degassed at 105°C for 1 h to eliminate any remaining moisture. This was followed by subjecting the samples to elevated temperatures (300°C) and maintaining them for at least 3 h, before analysis.
Scanning Electron Microscopy (SEM) Analysis
SEM-EDX analysis of the activated bio-char samples was performed using a Hitachi SU3500 Scanning Electron Microscope (SEM) combined with an Oxford AZtec X-Max50 SDD energy dispersive X-ray (EDX) detector available at Surface Science Western (Western University). Backscatter Electron (BSE) imaging was used to provide superior analysis of the particles, with variations in greyscale based on the average atomic number of the material. EDX is a semi-quantitative technique that can detect all elements with a minimum detection limit of approximately 0.5 weight percent. For these tests, a 10 kV accelerating voltage was applied. The samples surfaces were coated with a thin layer of gold to reduce any charging effect.
Thermogravimetry–Infrared Spectroscopy (TG-FTIR)
Small portions of the samples were analyzed by Fourier Transform Infrared (FTIR) spectroscopy using the Platinum® attenuated total reflectance (Pt-ATR) attachment equipped with a diamond crystal in the main box of a Bruker Tensor II spectrometer, Coventry, England. This experimental setup allows to analyze an area of approximately of 2 mm × 2 mm to a depth of 0.6–5 microns. The spectra were collected at wavenumbers between 4000–400 cm−1 with a resolution of 4 cm−1 and 32 scans. The spectra were corrected for the contribution from water vapour and carbon dioxide. Some of the spectra were baseline corrected.
X-Ray Diffraction (XRD)
The X-ray diffraction (XRD) analysis was performed within the scanning range of 10–90° 2θ using a Rigaku SmartLab automated multi-purpose XRD system equipped with Cross Beam Optics (CBO) system and a high-precision theta-theta goniometer featuring a horizontal sample mount and a 2D HyPix-3000 detector. Measurements were performed in Bragg-Brentano geometry using Ni-filtered CuKα radiation (λ= 1.54059 Å). SmartLab Studio II software was used to acquire XRD data.
pH
The pH of activated bio-char samples was measured based on the Rajkovich et al. (Singh et al., 2017) procedure. One gram of each sample of bio-char was suspended in 20 ml of deionized water. All the samples were put in the BNIS-100 Bionexus Thermo Incubator Shaker (Oakland, CA, United States) for 1.5 h. The slurry was filtered with Whatman, Grade 1 filter paper, and the pH was measured by the Orion 2 STAR pH meter (Thermo Fisher Scientific, MA, United States).
Adsorption Experiments
Adsorption studies were performed using solutions of methylene blue (MB), methyl orange (MO), and ibuprofen as model compounds. The concentration of methyl orange and methylene blue solutions utilized in the experiments was 250 mg/L to which 1 g of bio-char, or activated bio-char, or commercial activated carbon (CAC) was added in 100 ml samples. CAC samples (Norit® SX2, CAC number 7440-44-0) were purchased from Sigma Aldrich, Canada. They were produced from peat, activated with steam and acid washed. However, the ibuprofen concentration was 120 mg/L and the experiments were performed by adding 100 mg of adsorbents to 30 ml samples (Kannan and Sundaram, 2001; Jan et al., 2012).
All the adsorption experiments were carried out at room temperature (25°C) in a stirrer (INTLLAB) with a constant agitation rate for 3 h. The concertation of samples was measured using a UV-VIS spectrophotometer (Thermo Scientific Evolution 220). The amount of MB, MO, and ibuprofen components adsorbed was calculated using Eq. 1:
Where C0 (mg/L) is the initial concentration of the solution, Ct is the solution concentration after adsorption. V (ml) is the dye solution volume, and m (g) is the mass of adsorbent (Savci and Uysal, 2017).
UV-VIS Spectrophotometry
The initial and final concentrations of the solution used during the adsorption experiments were measured using a UV-Vis spectrophotometer. Plastic cuvettes were used for methyl orange and methylene blue and quartz cuvettes for ibuprofen. The maximum wavelength for methylene blue (MB), methyl orange (MO), and ibuprofen were determined to be 668, 464, and 220 nm, respectively. Each cuvette was filled with a specific ratio of solution and deionized water to reach 3 ml.
Results and Discussion
Physical and Chemical Characteristics of Activated Bio-Char
Table 3 shows that, by activating the bio-char, its structure becomes more stable as the fixed carbon percentages increased from 61% (bio-char produced at 500°C) to 88% (activated bio-char after an activation time of 3 h). The ash content increased after activation due to the concentration effect.

TABLE 3. The effect of pyrolysis temperature and activation time on the characteristics of activated bio-char (proximate analysis).
Yields of activated bio-chars were calculated by loading the same amount of bio-chars (50 g) produced at various temperatures of 450, 500, 600, and 650°C and then subtracting the remained weight of bio-char after the activation divided by the original weight. The holding time for all four samples was 3 h, during which the activation conditions were held constant. Since bio-char samples produced at higher temperatures 600 and 650°C contain less volatiles, 7 and 15.4% respectively, no significant weight loss occurred after activation. Therefore, higher yields were observed for activated bio-char using bio-char pyrolyzed at 650°C (ACB-650-3 h) and ACB-600-3 h compared to ACB-500-3 h and ACB-450-3 h (Figure 3). Although the yield of activated bio-char per gram of raw bio-char increased from 48 to 85%, the yield of activated bio-char per gram of biomass, as shown in Figure 3, remained approximately constant (20%) over the experiments at different temperatures.
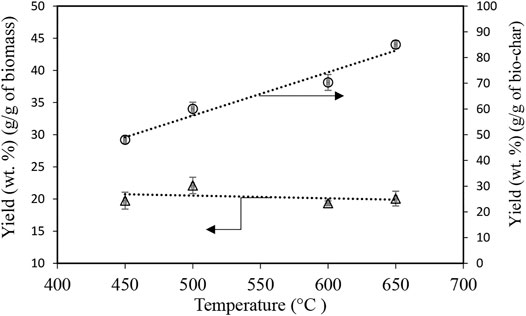
FIGURE 3. Yield of activated carbon produced using bio-char samples generated at 450, 500, 600, and 650°C with the same activation time of 3 h with CO2 flowrate of 0.5 L/min, normalized with respect to the mass of bio-char and biomass at 900°C, Trendlines are added for a better illustration.
Table 4 illustrates the elemental analysis for the four activated bio-chars produced at different holding times of 0.5, 1, 2, and 3 h and plain bio-char. The initial bio-char used for all these activation processes was bio-char produced at a pyrolysis temperature of 500°C and similar in all the experiments. The carbon content of the activated bio-chars was 84%, approximately 10% higher compared to its original bio-char (73.2%). Activated carbons with high carbon contents have potential use in catalytic applications. Also, activated bio-char with high nitrogen percentages is practical as a fertilizer in soil (Mohammad-Khah, Ansari). Adding activated bio-char to the soil has been proven to be beneficial. The high number of pores and increased surface area of the activated bio-char are two parameters that make it valuable as a soil amendment by increasing porosity and ability to store minerals, pH, and water retention capabilities (Batista et al., 2018), (Gopu et al., 2018).

TABLE 4. Elemental analysis results for the original bio-char and its four activated derivatives produced with different activation holding time of 0.5, 1, 2, 3 h.
BET Surface Area and Porosity Analysis of Activated Bio-Char
The Brunauer-Emmet-Teller (BET) technique is used to examine activated bio-char’s specific surface area with the purpose of explaining dye adsorption on its surface. It also includes the measurement of pore size distribution and volume (Wani et al., 2020). High surface area along with the pore size are two major parameters which significantly contribute in adsorption process. CO2 is a well-known activator for developing microporosity, and as a result, increasing the surface area of activated bio-char (Gopu et al., 2018). Table 5 indicates that the surface area of the activated bio-char increased significantly from 63 to 419 m2g−1 by increasing the activation time from 0.5 to 3 h. The maximum BET surface area achieved during these experiments approaches that of CAC used as a comparison (595 m2g−1).

TABLE 5. BET surface area and pore volume results for the activated bio-chars produced at 900°C with activation times of 0.5–3 h compared to commercial activated carbon (CAC).
SEM Images
The surface morphology of raw corn, bio-char produced at 500°C, and activated bio-chars are shown in the SEM images of Figure 4, respectively. The SEM images show that the raw corn surface is smooth and homogenous with no pores and that the porosity develops as a result of pyrolysis. At 500°C, some pores are detected, however, the presence of volatiles does not allow for the formation of more pores (Figure 4B). Activation affects the number of pores and also the appearance of the cracks (channel structure and honeycomb), increasing the available surface area of the activated bio-char (El-Shorbagy et al., 2021). Figure 4 shows that, by increasing the activation time from 1 h to 3 h, an obvious evolution of pores and surface heterogeneity was observed corresponding to the increase in the BET surface area from 63 to 419 m2g−1 and in the pore volume from 0.04 to 0.23 cm3g-1, confirmed by the visual observation of the SEM images.
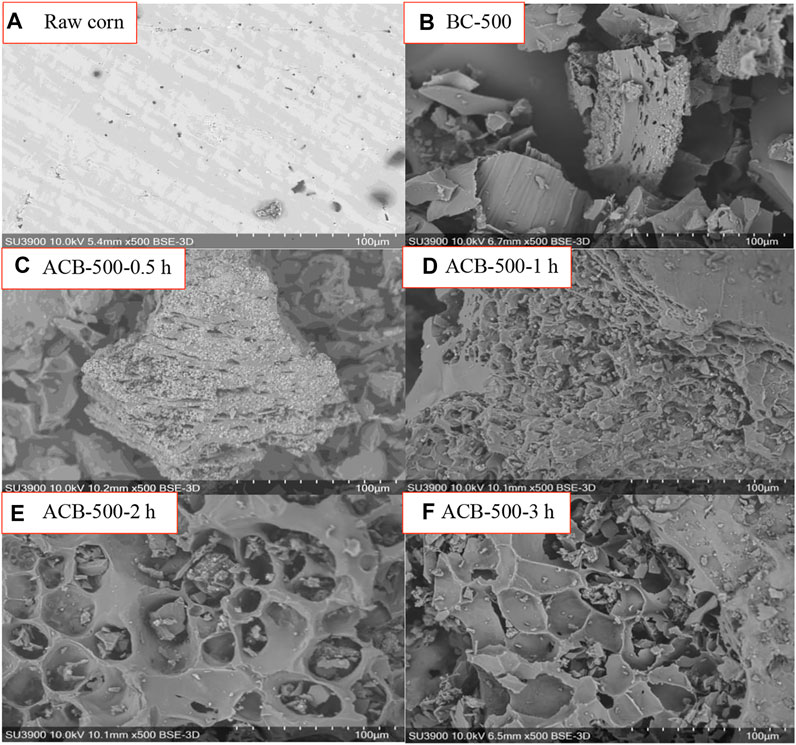
FIGURE 4. SEM images (500 magnitude) of (A) raw biomass, (B) bio-char at 500°C, activated bio-chars produced at 900°C with activation times of (C) 0.5, (D) 1, (E) 2, and (F) 3 h.
FTIR
FTIR is utilized for both structural determinations of organic compounds and for bio-char bond characterization (Chen et al., 2016). The FTIR patterns for raw corn and bio-char products are shown in Figure 5. Table 6 shows the wavenumber corresponding to the main peaks and the functional groups attributed to each region. In the corn starch spectrum, O–H, CH2, and –C–C– stretching vibrations are attributed to 3200–3400, 2850–2900, and 1600–1700 wavenumber (cm−1), respectively. Peaks with a wavenumber of 1300–1450 cm−1 and 850–900 cm−1 in raw corn represent O–H and –C–C–bending vibrations, respectively (Oromiehie et al., 2013). Raw corn displays the highest number of peaks at the single bond and fingerprint region. The intensity of light components (3252 cm−1 bands) with hydroxyl (–OH) and carboxyl (–COOH) groups diminishes with increasing pyrolysis temperature and disappears at higher temperatures. When compared to other samples, raw corn has two peaks with high absorbance intensity of 3252 cm−1, and 1014 cm−1, indicating the presence of a great number of alcohols, hydroxyls, and aliphatic compounds in its structure. As the temperature increases, only complex compounds within the fingerprint region remain. For instance, two peaks of 1581 cm−1 and 868 cm−1 show the aromatic rings, and 1155 cm−1 shows the amine compounds with CN stretch. Figure 5 illustrates that complex products, such as aromatic and aliphatic compounds, can be seen even at high temperatures (900°C). The results are in accordance with other studies by A. R. Oromiehie et al. (Oromiehie et al., 2013) and Kizil et al. (Kizil et al., 2002).
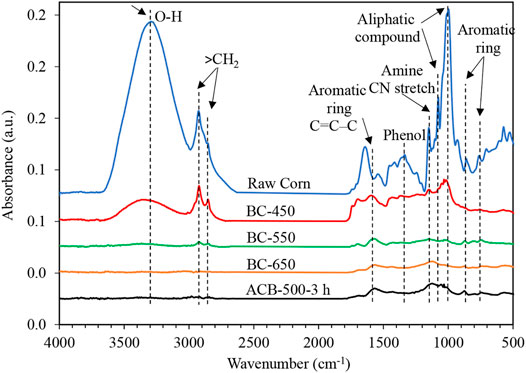
FIGURE 5. FTIR spectra of raw corn, bio-char produced at 450, 550, and 650°C (holding time: 30 min), and activated bio-char produced at 500°C with activation holding time of 3 h.

TABLE 6. FTIR peaks analysis (adapted from (Nandiyanto et al., 2019)).
XRD Analysis
XRD analysis was performed on two samples of bio-char produced from the pyrolysis of corn grains at 600 and 650°C and all the activated bio-char samples with activation time changing from 0.5 to 3 h (Figure 6). The results show two main diffraction peaks at 2ϴ = 22–28° and 2ϴ = 42°, representative of amorphous structure, presence of carbon, and graphite (Chen et al., 2017; Pusceddu et al., 2017). A high peak at 2ϴ = 24° is a representative of carbon (C12 to C60), because at high temperatures the carbon content of bio-char increases (Chen et al., 2016; Assirey and Altamimi, 2021).
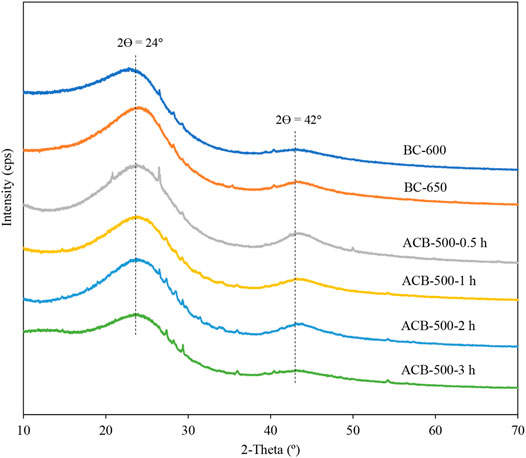
FIGURE 6. XRD patterns of two samples of bio-char produced at 600 and 650°C, and four samples of activated bio-char with activation time changes from 0.5 to 3 h.
Adsorption Experiments
Methylene Blue (MB)
The adsorption performance of original bio-chars and of the activated bio-chars produced from the pyrolysis of corn grains was measured using dyes (MB and MO), as model molecules, and ibuprofen, as a real molecule representing a typical pharmaceutical. The results were also compared with the performance of commercial activated carbon (CAC). The main reasons for choosing methylene blue (MB), methyl orange (MO), and ibuprofen (IBU) for adsorption experiments are their UV activity and their different molecular sizes (MB = 2 nm, MO = 1.2 nm, IBU = 1 nm) (Zurutuza et al., 2020; Elgarahy et al., 2021; Wei et al., 2021). Methylene blue is a cationic molecule and its structure consists of six carbon aromatic rings, nitrogen, and sulphur (Santoso et al., 2020). The molecular size of this dye is ∼2 nm (Ma et al., 2012) and its adsorption on the surface of the bio-char reveals the presence of mesopores in the structure of the adsorbent (Foo and Hameed, 2011).
Adsorption tests of methylene blue molecules were performed using a constant bio-char sample mass (1 g). Figures 7, 8 illustrate the comparison between the performance of bio-char produced at 500°C (BC-500) and of four activated bio-chars with holding times of 0.5 (ACB-500-0.5 h), 1 (ACB-500-1 h), 2 (ACB-500-2 h), and 3 (ACB-500-3 h) hours. CO2 penetration into the internal structure of bio-char during activation leads to widening of the pores obtained during the pyrolysis step (Colomba, 2015). Figure 7 illustrates that the ACB-500-2 h sample adsorbed about 92% of MB after 1 h of contact time, which was higher compared to the other two samples in that group. Among all activated bio-char samples produced with activation times of 0.5, 1, 2, and 3 h, ACB-500-3 h showed the highest adsorption capacity, with a total adsorption (25 mg) of MB after 5 min (Figures 8, 9). This result is in good agreement with the porosity measurements, which show that the BET surface area of activated bio-char (3 h) was higher (419 m2g−1) compared to other activated carbons bio-chars (63, 151, and 253 m2g−1). The performance of ACB-500-3 h was also compared to that of commercial activated carbon (CAC). Figure 8 shows CAC and ACB-500-3 h exhibit almost the same adsorption behavior with only 3 min time difference, which could be due to the higher surface area of CAC (595 m2 g−1) compared to that of ACB-500-3 h (419 m2g−1).
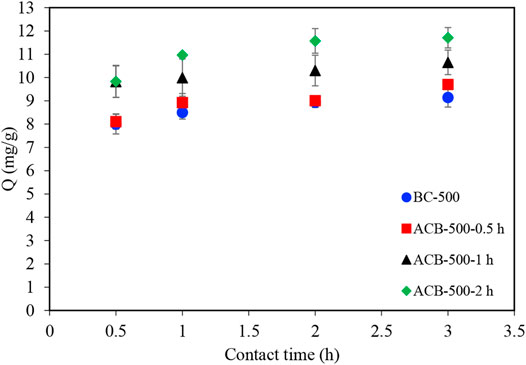
FIGURE 7. Methylene blue adsorption profiles for four samples: bio-char produced at 500°C and three activated bio-chars produced at 900°C with activation holding times of 0.5, 1, and 2 h 100 ml samples with 250 mg/L of MB concentration to which 1 g of bio-char was added.
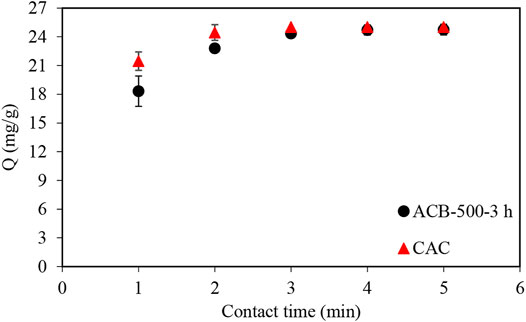
FIGURE 8. Comparison of MB adsorption profile using ACB-500-3 h sample and commercial activated carbon (CAC). 100 ml samples with 250 mg/L of MB concentration to which 1 g of bio-char and CAC was added.
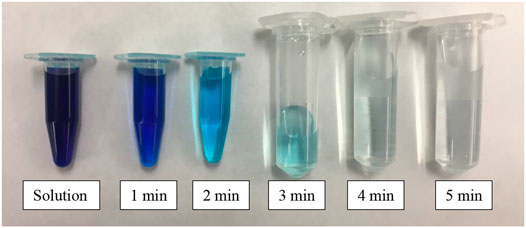
FIGURE 9. Visual display of MB adsorption using 1 g of ACB-500-3 h adsorbent sample in 250 mg L−1 of MB solution.
Methyl Orange (MO)
Figure 10 shows the adsorption of methyl orange (MO) using original samples of the same type of bio-char and the activated bio-chars used for the experiments described earlier. The initial concentration of the stock solution was 250 mg/L, which is similar to that of the MB experiments. The results show that 83% of MO was adsorbed using 1 g of ACB-500-2 h after 2 h contact time. Comparing the MB adsorption graphs in Figure 7 with Figure 10, the rate of MB adsorption in the first 30 min of the experiments was higher for the same experiment and activated samples.

FIGURE 10. Methyl Orange adsorption profiles for four samples: bio-char produced at 500°C and three activated bio-chars produced at 900°C with activation holding times of 0.5, 1, and 2 h 100 ml samples with 250 mg/L of MO concentration to which 1 g of bio-char was added.
Figure 11 shows the comparison between the adsorption performance of the ACB-500-3 h sample and of the CAC sample. Total adsorption of MO (25 mg) occurred after 2 min using the CAC. However, the contact time required for the total adsorption increased to 8 min, while using the ACB-500-3 h sample.
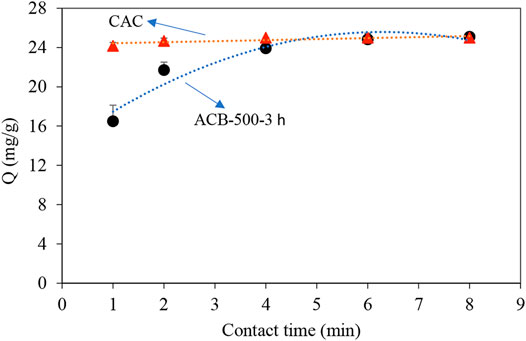
FIGURE 11. Comparison of MO adsorption profile using ACB-500-3 h sample and commercial activated carbon (CAC). 100 ml samples with 250 mg/L of MO concentration to which 1 g of bio-char and CAC was added, trendlines are added for a better illustration.
Ibuprofen
Ibuprofen with the molecular formula of C13H18O2 is an anti-inflammatory drug with widespread global consumption. However, due to its chemical structure, it also spreads and accumulates widely in aquatic environments, creating a serious concern for both humans and the environment (Mestre et al., 2007; Essandoh et al., 2015). There are various chemical, physical, and biochemical processes for removing ibuprofen. The existing processes have two downsides: they are expensive processes, and secondly, they are not sufficiently effective (Ternes et al., 2002). Bio-chars and activated carbons acquired from agricultural by-products offer good alternatives for drinking water treatments because of their strong interactions with organic contaminants in the aqueous phase (Jung et al., 2013).
Similar experiments to those with MB and MO were performed with ibuprofen (IBU), starting with the ACB-500-3 h sample and exploring the adsorption profile of this pharmaceutical. Figure 12 shows that ACB-500-3 h could adsorb 76% of the ibuprofen after 0.5 h and 95% after 1 h. To reduce the adsorption contact time, a bio-char sample was activated with a holding time of 5 h, to determine if this would improve the ibuprofen adsorption profile. After increasing the activation time to 5 h (Figure 13), the adsorption contact time decreased from 3 h to 12 min. The BET surface area of ACB-500-5 h was 551 m2g−1, very similar to that of CAC (595 m2g−1).
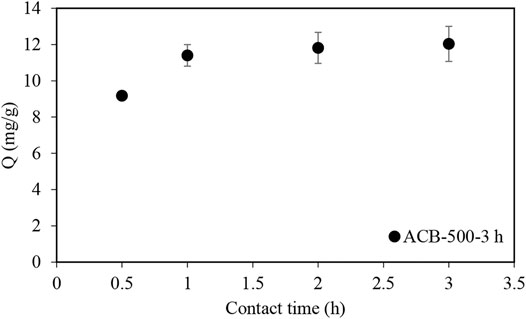
FIGURE 12. Ibuprofen adsorption profile using ACB-500-3 h sample in an ibuprofen solution with the concentration of 120 mg L−1. 30 ml samples with 120 mg/L of ibuprofen concentration to which 100 mg of activated bio-char was added.
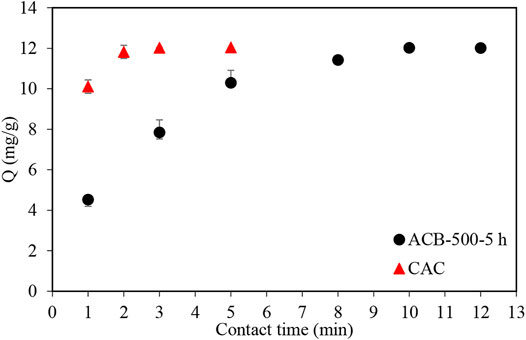
FIGURE 13. Comparison of ibuprofen adsorption profile using ACB-500-5 h sample and commercial activated carbon (CAC). 30 ml samples with 120 mg/L of ibuprofen concentration to which 100 mg of activated bio-char and CAC was added.
Adsorption Mechanism
There are many parameters that can affect the adsorption process, such as initial dye concentration, solution pH, amount of adsorbent, and temperature (Elgarahy et al., 2021). In this study, the focus was the effect of pH. The effect of pH is different depending on the type of adsorbent. Kannan et al. (Kannan and Sundaram, 2001) discussed the pH effect on methylene blue (MB) adsorption and the results showed increased adsorption rates after increasing the pH for various adsorbents suspensions in water, such as activated carbons from bamboo dust, coconut shells, rice husks, and straw. According to the pKa value of MB, MO, and IBU, which are 3.8, 3.5, and 4.9, respectively, their molecular charges are different at pH > pKa (Zhu et al., 2004). The MB molecule is positively charged at pH > 3.8, MO and IBU molecule are both negatively charged at pH > 3.5, and pH > 4.9, respectively (Zhang et al., 2017; Sumalinog et al., 2018; Ocampo-Perez et al., 2019).
Table 7 indicates how the pH of activated bio-char samples increased after increasing the activation time from 0.5 to 3 h, which increased the adsorption rate. The activated carbon characteristics, such as surface area, porosity, pore-volume, pore distribution, and functional groups, significantly affect the adsorption process (Heidarinejad et al., 2020).
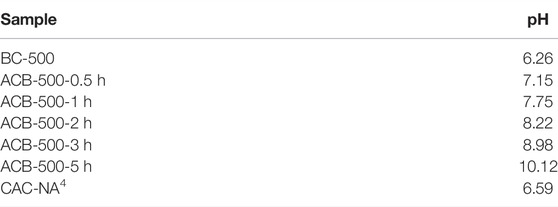
TABLE 7. pH of water suspensions of bio-chars produced at 500°C, activated bio-chars produced at 900°C (different activation times changing from 0.5 to 5 h), and CAC.
Studies (Vargas et al., 2011; Ma et al., 2012) show that, apart from the parameters discussed above, the presence of functional groups such as aromatic rings –C=O, –C=N, –C–O–C–, –OH, –NH2, –C=S, and –S=O on the surface of the adsorbent (activated bio-char) play a significant role in MB adsorption. The FTIR results of ACB-500-3 h illustrate the presence of –C=O, –C=N functional groups, which improved the MB adsorption mechanism.
One reason for the different results between MB and MO, while using dye for both experiments could be related to the size of the molecules (MO: 1.2 nm, MB: 2 nm). Also, the adsorption of MB and MO occurs via electrostatic interactions, electron donor-acceptor relationships, or π-π interactions (Zhu et al., 2004). These forces develop between the functional groups on the surface of the carbon and of the dye molecules and any of them could be responsible for the different dye adsorption behavior between two dyes (Santoso et al., 2020).
Cost Estimation and Comparison
According to the global activated carbon market forecast, the market will grow from USD 3.12 billion in 2021 to USD 4.5 billion in 2028 (Report ID FBI102175, 2021). Currently, both coal-based activated carbon and biomass-based activated carbon are available in the market. Table 8 shows a comparison between these two types of activated carbons. Both samples have similar characteristics in terms of BET surface area and iodine number, but the one wood based is cheaper. More importantly, the activated carbon that is made from waste biomass is sustainable and environmentally friendly.

TABLE 8. Comparison of activated carbon coal based and biomass based, respectively (adapted from (Chemical Auxiliary Agent).
Conclusion
In this study, vomitoxin contaminated waste corn grains were converted into value-added activated bio-char using two successive processes consisting of pyrolysis and subsequent activation. Pyrolysis completely eliminated the contamination, as DON decreased from 5 to 7 ppm to nil. The bio-char produced was physically activated at a temperature of 900°C with a flowrate of 0.5 L/min CO2. This activated bio-char showed a significant improvement in the adsorption capacity with respect to raw bio-char. The surface area of the activated bio-char increased from 63 to 419 m2 g−1 by increasing the activation time from 0.5 to 3 h. Methylene blue, methyl orange, and ibuprofen were completely adsorbed by activated corn bio-char after 5, 8, and 12 min, using ACB-500-3 h, ACB-500-3 h, and ACB-500-5h, respectively, showing a similar performance (on per g basis) to that of commercial activated carbon. The high adsorption capacity of activated bio-char was due to the large number of pores, which developed during the activation process. This result was visually confirmed through SEM analysis. Further, the high adsorption rate of these molecules was attributed to the high pH (pH = 9) of the activated bio-char, as well as the presence of functional groups (e.g. –C=O, –C=N) on the surface of the adsorbent, as proven by FTIR analysis. This study represented the second phase of a larger project dealing with the investigation of the effect of pyrolysis technology on the elimination of deoxynivalenol (DON) from corn grains. The results confirmed that a toxic waste can be converted into a value-added product that, with its adsorption properties, can effectively compete with commercial activated carbon. This result matches the green chemistry objectives along with sustainable engineering, since the bio-char is produced from waste biomass and can replace activated carbon produced from non-renewable fossil fuels.
Data Availability Statement
The original contributions presented in the study are included in the article/Supplementary Material, further inquiries can be directed to the corresponding authors.
Author Contributions
SK: Data curation, Formal analysis, Investigation, Methodology, Validation, Writing – original draft SP: Data curation, Investigation, Methodology, Supervision, Writing – review & editing FB: Methodology, Resources, Supervision, Writing – review & editing.
Conflict of Interest
The authors declare that the research was conducted in the absence of any commercial or financial relationships that could be construed as a potential conflict of interest.
Publisher’s Note
All claims expressed in this article are solely those of the authors and do not necessarily represent those of their affiliated organizations, or those of the publisher, the editors and the reviewers. Any product that may be evaluated in this article, or claim that may be made by its manufacturer, is not guaranteed or endorsed by the publisher.
Footnotes
1By difference
2By difference
3By difference
4Not available
References
Ahmed, M. J. (2016). Preparation of Activated Carbons from Date (Phoenix Dactylifera L.) palm Stones and Application for Wastewater Treatments: Review. Process Saf. Environ. Prot. 102, 168–182. doi:10.1016/j.psep.2016.03.010
Al-Muhtaseb, S. A., El-Naas, M. H., and Abdallah, S. (2008). Removal of Aluminum from Aqueous Solutions by Adsorption on Date-Pit and BDH Activated Carbons. J. Hazard. Mater. 158, 300–307. doi:10.1016/j.jhazmat.2008.01.080
Assirey, E. A., and Altamimi, L. R. (2021). Chemical Analysis of Corn Cob-Based Biochar and its Role as Water Decontaminants. J. Taibah Univ. Sci. 15, 111–121. doi:10.1080/16583655.2021.1876350
Batista, E. M. C. C., Shultz, J., Matos, T. T. S., Fornari, M. R., Ferreira, T. M., Szpoganicz, B., et al. (2018). Effect of Surface and Porosity of Biochar on Water Holding Capacity Aiming Indirectly at Preservation of the Amazon Biome. Sci. Rep. 8, 10677. doi:10.1038/s41598-018-28794-z
Belhachemi, M., Belala, Z., Lahcene, D., and Addoun, F. (2009). Adsorption of Phenol and Dye from Aqueous Solution Using Chemically Modified Date Pits Activated Carbons. Desalination Water Treat. 7, 182–190. doi:10.5004/dwt.2009.729
Canales-Flores, R. A., and Prieto-García, F. (2016). Activation Methods of Carbonaceous Materials Obtained from Agricultural Waste. Chem. Biodiversity 13, 261–268. doi:10.1002/cbdv.201500039
Chemical Auxiliary Agent, Zhengzhou Zhongchuang Water Purification Material Co., Ltd. Catalysts & Chemical Auxiliary Agents. Hangzhou, Zhejiang and George Town, Cayman Islands: Alibaba.com.
Chen, D., Xie, S., Chen, C., Quan, H., Hua, L., Luo, X., et al. (2017). Activated Biochar Derived from Pomelo Peel as a High-Capacity Sorbent for Removal of Carbamazepine from Aqueous Solution. RSC Adv. 7, 54969–54979. doi:10.1039/c7ra10805b
Chen, T., Liu, R., and Scott, N. R. (2016). Characterization of Energy Carriers Obtained from the Pyrolysis of white Ash, Switchgrass and Corn stover - Biochar, Syngas and Bio-Oil. Fuel Process. Tech. 142, 124–134. doi:10.1016/j.fuproc.2015.09.034
Colomba, A. (2015). Production of Activated Carbons from Pyrolytic Char for Environmental Applications. London, ON: The University of Western Ontario. Available at: https://ir.lib.uwo.ca/cgi/viewcontent.cgi?article=4536&context=etd.
El-Shorbagy, H. G., El-Kousy, S. M., Elwakeel, K. Z., and El-Ghaffar, M. A. A. (2021). Eco-friendly Chitosan Condensation Adduct Resins for Removal of Toxic Silver Ions from Aqueous Medium. J. Ind. Eng. Chem. 100, 410–421. doi:10.1016/j.jiec.2021.04.029
Elgarahy, A. M., Elwakeel, K. Z., Mohammad, S. H., and Elshoubaky, G. A. (2021). A Critical Review of Biosorption of Dyes, Heavy Metals and Metalloids from Wastewater as an Efficient and green Process. Clean. Eng. Tech. 4, 100209. doi:10.1016/j.clet.2021.100209
Enaime, G., Baçaoui, A., Yaacoubi, A., and Lübken, M. (2020). Biochar for Wastewater Treatment-Conversion Technologies and Applications. Appl. Sci. 10, 3492. doi:10.3390/app10103492
Essandoh, M., Kunwar, B., Pittman, C. U., Mohan, D., and Mlsna, T. (2015). Sorptive Removal of Salicylic Acid and Ibuprofen from Aqueous Solutions Using pine wood Fast Pyrolysis Biochar. Chem. Eng. J. 265, 219–227. doi:10.1016/j.cej.2014.12.006
Foo, K. Y., and Hameed, B. H. (2011). Microwave Assisted Preparation of Activated Carbon from Pomelo Skin for the Removal of Anionic and Cationic Dyes. Chem. Eng. J. 173, 385–390. doi:10.1016/j.cej.2011.07.073
Franciski, M. A., Peres, E. C., Godinho, M., Perondi, D., Foletto, E. L., Collazzo, G. C., et al. (2018). Development of CO2 Activated Biochar from Solid Wastes of a Beer Industry and its Application for Methylene Blue Adsorption. Waste Manage. 78, 630–638. doi:10.1016/j.wasman.2018.06.040
Gopu, C., Gao, L., Volpe, M., Fiori, L., and Goldfarb, J. L. (2018). Valorizing Municipal Solid Waste: Waste to Energy and Activated Carbons for Water Treatment via Pyrolysis. J. Anal. Appl. Pyrolysis 133, 48–58. doi:10.1016/j.jaap.2018.05.002
Hadi, P., Xu, M., Ning, C., Sze Ki Lin, C., and McKay, G. (2015). A Critical Review on Preparation, Characterization and Utilization of Sludge-Derived Activated Carbons for Wastewater Treatment. Chem. Eng. J. 260, 895–906. doi:10.1016/j.cej.2014.08.088
Heidarinejad, Z., Dehghani, M. H., Heidari, M., Javedan, G., Ali, I., and Sillanpää, M. (2020). Methods for Preparation and Activation of Activated Carbon: a Review. Environ. Chem. Lett. 18, 393–415. doi:10.1007/s10311-019-00955-0
Ioannidou, O., and Zabaniotou, A. (2007). Agricultural Residues as Precursors for Activated Carbon Production-A Review. Renew. Sustain. Energ. Rev. 11, 1966–2005. doi:10.1016/j.rser.2006.03.013
Jan, S. U., Khan, G. M., and Hussain, I. (2012). Formulation Development and Investigation of Ibuprofen Controlled Release Tablets with Hydrophilic Polymers and the Effect of Co-excipients on Drug Release Patterns. Pak J. Pharm. Sci. 25, 751–756. doi:10.5897/ajpp11.604
Jung, C., Park, J., Lim, K. H., Park, S., Heo, J., Her, N., et al. (2013). Adsorption of Selected Endocrine Disrupting Compounds and Pharmaceuticals on Activated Biochars. J. Hazard. Mater. 263, 702–710. doi:10.1016/j.jhazmat.2013.10.033
Kannan, N., and Sundaram, M. M. (2001). Kinetics and Mechanism of Removal of Methylene Blue by Adsorption on Various Carbons-A Comparative Study. Dyes Pigm. 51, 25–40. doi:10.1016/s0143-7208(01)00056-0
Karami, S. (2021). Slow Pyrolysis of Vomitoxin-Contaminated Corn in a Batch Reactor. London, ON: The University of Western Ontario. Available at: https://ir.lib.uwo.ca/cgi/viewcontent.cgi?article=10264&context=etd.
Kizil, R., Irudayaraj, J., and Seetharaman, K. (2002). Characterization of Irradiated Starches by Using FT-Raman and FTIR Spectroscopy. J. Agric. Food Chem. 50, 3912–3918. doi:10.1021/jf011652p
Liang, L., Xi, F., Tan, W., Meng, X., Hu, B., and Wang, X. (2021). Review of Organic and Inorganic Pollutants Removal by Biochar and Biochar-Based Composites. Biochar 3, 255–281. doi:10.1007/s42773-021-00101-6
Luo, Z., Yao, B., Yang, X., Wang, L., Xu, Z., Yan, X., et al. (2022). Novel Insights into the Adsorption of Organic Contaminants by Biochar: A Review. Chemosphere 287, 132113. doi:10.1016/j.chemosphere.2021.132113
Ma, J., Yu, F., Zhou, L., Jin, L., Yang, M., Luan, J., et al. (2012). Enhanced Adsorptive Removal of Methyl Orange and Methylene Blue from Aqueous Solution by Alkali-Activated Multiwalled Carbon Nanotubes. ACS Appl. Mater. Inter. 4, 5749–5760. doi:10.1021/am301053m
Mestre, A. S., Pires, J., Nogueira, J. M. F., and Carvalho, A. P. (2007). Activated Carbons for the Adsorption of Ibuprofen. Carbon 45, 1979–1988. doi:10.1016/j.carbon.2007.06.005
Mohammad-Khah, A., and Ansari, R. (2009). Activated Charcoal: Preparation, Characterization and Applications : A Review Article, 6.
Nandiyanto, A. B. D., Oktiani, R., and Ragadhita, R. (2019). How to Read and Interpret FTIR Spectroscope of Organic Material. Indonesian J. Sci. Technol. 4, 97. doi:10.17509/ijost.v4i1.15806
Ocampo-Perez, R., Padilla-Ortega, E., Medellin-Castillo, N. A., Coronado-Oyarvide, P., Aguilar-Madera, C. G., Segovia-Sandoval, S. J., et al. (2019). Synthesis of Biochar from Chili Seeds and its Application to Remove Ibuprofen from Water. Equilibrium and 3D Modeling. Sci. Total Environ. 655, 1397–1408. doi:10.1016/j.scitotenv.2018.11.283
Omri, A., Benzina, M., and Ammar, N. (2013). Preparation, Modification and Industrial Application of Activated Carbon from almond Shell. J. Ind. Eng. Chem. 19, 2092–2099. doi:10.1016/j.jiec.2013.03.025
Oromiehie, A. R., lari, T. T., and Rabiee, A. (2013). Physical and thermal Mechanical Properties of Corn Starch/LDPE Composites. J. Appl. Polym. Sci. 127, 1128–1134. doi:10.1002/app.37877
Papari, S., and Hawboldt, K. (2015). A Review on the Pyrolysis of Woody Biomass to Bio-Oil: Focus on Kinetic Models. Renew. Sustain. Energ. Rev. 52, 1580–1595. doi:10.1016/j.rser.2015.07.191
Pusceddu, E., Montanaro, A., Fioravanti, G., Santilli, S. F., Foscolo, P. U., Criscuoli, I., et al. (2017). Comparison between Ancient and Fresh Biochar Samples. A Study on The Recalcitrance of Carbonaceous Structures During Soil Incubation 3, 9.
Report Id Fbi102175, (2021). Activated Carbon Market Size, Share and COVID-19 Impact Analysis by Type, by Application, and Regional Forecast. Available at: https://www.fortunebusinessinsights.com/infographics/activated-carbon-market-102175.
Sajjadi, B., Chen, W.-Y., and Egiebor, N. O. (2019). A Comprehensive Review on Physical Activation of Biochar for Energy and Environmental Applications. Rev. Chem. Eng. 35, 735–776. doi:10.1515/revce-2017-0113
Santoso, E., Ediati, R., Kusumawati, Y., Bahruji, H., Sulistiono, D. O., and Prasetyoko, D. (2020). Review on Recent Advances of Carbon Based Adsorbent for Methylene Blue Removal from Waste Water. Mater. Today Chem. 16, 100233. doi:10.1016/j.mtchem.2019.100233
Savci, S., and Uysal, M. M. (2017). Adsorption of Methylene Blue and Methyl Orange by Using Waste Ash. SDÜ Fen Bil Enst Der 21, 831. doi:10.19113/sdufbed.46521
Singh, A. (2019). Pyrolysis of Miscanthus and Products Characterization. London, ON: The University of Western University. Available at: https://ir.lib.uwo.ca/cgi/viewcontent.cgi?article=8838&context=etd.
Singh, B., Shen, Q., and Camps Arbestain, M. (2017). Electrical Conductivity and Liming Potential. Chapter 3. Biochar pH.
Sumalinog, D. A. G., Capareda, S. C., and de Luna, M. D. G. (2018). Evaluation of the Effectiveness and Mechanisms of Acetaminophen and Methylene Blue Dye Adsorption on Activated Biochar Derived from Municipal Solid Wastes. J. Environ. Manage. 210, 255–262. doi:10.1016/j.jenvman.2018.01.010
Tagliaferro, P. A. Biochar. IOP Publishing Ltd. Epub ahead of print 2020. doi:10.1088/978-0-7503-2660-5
Tan, X.-f., Liu, S.-b., Liu, Y.-g., Gu, Y.-l., Zeng, G.-m., Hu, X.-j., et al. (2017). Biochar as Potential Sustainable Precursors for Activated Carbon Production: Multiple Applications in Environmental protection and Energy Storage. Bioresour. Tech. 227, 359–372. doi:10.1016/j.biortech.2016.12.083
Ternes, T. A., Meisenheimer, M., McDowell, D., Sacher, F., Brauch, H.-J., Haist-Gulde, B., et al. (2002). Removal of Pharmaceuticals during Drinking Water Treatment. Environ. Sci. Technol. 36, 3855–3863. doi:10.1021/es015757k
Vargas, A. M. M., Cazetta, A. L., Kunita, M. H., Silva, T. L., and Almeida, V. C. (2011). Adsorption of Methylene Blue on Activated Carbon Produced from Flamboyant Pods (Delonix Regia): Study of Adsorption Isotherms and Kinetic Models. Chem. Eng. J. 168, 722–730. doi:10.1016/j.cej.2011.01.067
Wani, I., Sharma, A., Kushvaha, V., Madhushri, P., and Peng, L. (2020). Effect of pH, Volatile Content, and Pyrolysis Conditions on Surface Area and O/C and H/C Ratios of Biochar: Towards Understanding Performance of Biochar Using Simplified Approach. J. Hazard. Tox. Radioact. Waste 24, 04020048. doi:10.1061/(asce)hz.2153-5515.0000545
Wei, Y., Salih, K. A. M., Rabie, K., Elwakeel, K. Z., Zayed, Y. E., Hamza, M. F., et al. (2021). Development of Phosphoryl-Functionalized Algal-PEI Beads for the Sorption of Nd(III) and Mo(VI) from Aqueous Solutions - Application for Rare Earth Recovery from Acid Leachates. Chem. Eng. J. 412, 127399. doi:10.1016/j.cej.2020.127399
Yin, C., Aroua, M., and Daud, W. (2007). Review of Modifications of Activated Carbon for Enhancing Contaminant Uptakes from Aqueous Solutions. Sep. Purif. Tech. 52, 403–415. doi:10.1016/j.seppur.2006.06.009
Zhang, J., Liu, M., Yang, T., Yang, K., and Wang, H. (2017). Synthesis and Characterization of a Novel Magnetic Biochar from Sewage Sludge and its Effectiveness in the Removal of Methyl orange from Aqueous Solution. Water Sci. Tech. 75, 1539–1547. doi:10.2166/wst.2017.014
Zhu, D., Hyun, S., Pignatello, J. J., and Lee, L. S. (2004). Evidence for π−π Electron Donor−Acceptor Interactions between π-Donor Aromatic Compounds and π-Acceptor Sites in Soil Organic Matter through pH Effects on Sorption. Environ. Sci. Technol. 38, 4361–4368. doi:10.1021/es035379e
Keywords: pyrolysis, bio-char, activation, adsorption, activated carbon
Citation: Karami S, Papari S and Berruti F (2022) Conversion of Waste Corn Biomass to Activated Bio-Char for Applications in Wastewater Treatment. Front. Mater. 9:839421. doi: 10.3389/fmats.2022.839421
Received: 20 December 2021; Accepted: 22 March 2022;
Published: 07 April 2022.
Edited by:
Souradeep Gupta, Indian Institute of Science (IISc), IndiaReviewed by:
Khalid Z. Elwakeel, Jeddah University, Saudi ArabiaPing Duan, China University of Geosciences, China
Copyright © 2022 Karami, Papari and Berruti. This is an open-access article distributed under the terms of the Creative Commons Attribution License (CC BY). The use, distribution or reproduction in other forums is permitted, provided the original author(s) and the copyright owner(s) are credited and that the original publication in this journal is cited, in accordance with accepted academic practice. No use, distribution or reproduction is permitted which does not comply with these terms.
*Correspondence: Sadegh Papari, c3BhcGFyaUB1d28uY2E=; Franco Berruti, ZmJlcnJ1dGlAdXdvLmNh
 Shokooh Karami
 Sadegh Papari