 Zhou Chen
 Zehong Chen1
 Shiping Huang
95% of researchers rate our articles as excellent or good
Learn more about the work of our research integrity team to safeguard the quality of each article we publish.
Find out more
ORIGINAL RESEARCH article
Front. Mater. , 14 February 2022
Sec. Structural Materials
Volume 9 - 2022 | https://doi.org/10.3389/fmats.2022.839265
This article is part of the Research Topic Advanced Steel and Composite Structures in Civil Engineering View all 9 articles
With the advancement in civil engineering, the applications of lightweight and high-strength materials, and large-span, low-damping structural systems, are increasing. One important structural system for such applications is the corridor pedestrian bridge structure. The vibration frequency of the corridor pedestrian bridge structure is often in the same range as the step frequency of pedestrians, and it is easy to cause the appearance of the corridor structure. The vibration frequency of the corridor pedestrian bridge structure is often in the same range as the step frequency of pedestrians, and it is easy to cause the appearance of the corridor structure. Vibration comfort issues even affect the safe use of the corridor. Vibration comfort issues even affect the safe use of the corridor. Regarding the vertical vibration caused by pedestrians on the steel structure corridor footbridge, using a tuned mass damper (TMD) system can reduce the vibration effect. After the TMD vibration reduction test of the steel structure corridor footbridge, it can be found that the vibration reduction rate of the footbridge has reached 62.56%. The results show that vibration reduction by TMD system is a safe and effective method for pedestrian bridge vibration reduction, improving the structural performance and pedestrian comfort of the structural corridor pedestrian bridge.
Compared with ordinary pedestrian bridges, the corridor pedestrian bridge pays more attention to landscape design, breaking through the simple function and structure design thinking of the past, and at the same time considering more architectural design elements. Since the human-induced vibration event of the Millennium Bridge in London (P. Dallard et al., 2001), the research on human-induced structural vibrations has become a hot research area. Researchers have carried out several theoretical studies on the dynamic response of pedestrians passing through footbridges and corridors (Matsumoto et al., 1998; Pavic et al., 2003; Figueiredo et al., 2008; Piccardo and Tubino, 2009; Jian et al., 2010; Chen et al., 2018; Li et al., 2019; Hui et al., 2020). Jingcheng et al. (Guan et al., 2021) considered the sightseeing steel structure corridor of Suzhou Cultural Expo Center as a case study to compare and analyze the coupling effect of human-structure on large-span steel connections and the influence of the dynamic characteristics and vibration response of the corridor structure. At the same time, relevant research was carried out in the experiment. Zhou et al. (2012) carried out the dynamic response experiment of indoor rotating steel stairs under pedestrian excitations.
Several researchers also conducted experimental research on pedestrian load models when pedestrians go up and down the stairs (Kim al., 2008; Brad and Murray, 2009; Du et al., 2016). Zhu et al. (2017) used wireless six-axis bluetooth acceleration sensors to carry out dynamic characteristics tests of walking excitation under three different walking frequencies on the rigid ground and flexible bridge deck, respectively. The results showed that the dynamic load factor of pedestrian loads on the rigid ground was higher than that on the flexible ground. Based on intelligent wearable devices, Chen et al. (2019) used the Human Shaker (HS) method to test the dynamic response of humans in walking, jumping, and swinging motion states. The results show that the HS technique can be conveniently and quickly used for modal testing of small and medium-sized structures. Chen et al. (2014) developed a model based on the pedestrian three-way single foot test load. Pan et al. (2017) studied the vibration comfort of floor slabs pedestrian loadings.
However, there are few studies on the vibration tests of pedestrians in the corridors between buildings. In this paper, the actual project of a steel truss and corridor footbridge is considered as the case study. Field tests on the bridge were conducted, and the stress state of the footbridge structure under the pedestrian load was investigated. Different conditions of people, walking frequencies, and motion states, as well as the corresponding vibration response of the structure, were analyzed as well. The finite element (FE) software ABAQUS is used to develop the structural entity model. The structural modal parameters obtained by the FE simulations are compared with the field test results to evaluate the differences in the dynamic response of the corridors under different walking conditions in different groups of people.
This paper takes a steel structure corridor pedestrian bridge in a financial city as an example to study human-induced vibrations and vibration reduction. The main body of the flyover is a steel truss structure made of Q345B steel. Its elevation is shown in Figure 1. The bridge is 60.6 m long and 6 m wide. The lower chords are connected by three kinds of hot-rolled seamless steel pipes. The cross-section ϕ14 mm and ϕ16 mm truss beams are 5 m high, and the beam chords are 450 × 300 mm welded box steels with a thickness of 20 mm. The top horizontal connection uses 20a hot-rolled I-beam, and the bottom horizontal connection uses 25a hot-rolled I-beam. The bridge deck adopts a composite floor slab of the profiled steel plate and C30 concrete, and the top surface of the bridge deck is increased with welded steel mesh to improve the bonding force between the concrete and the steel structure.
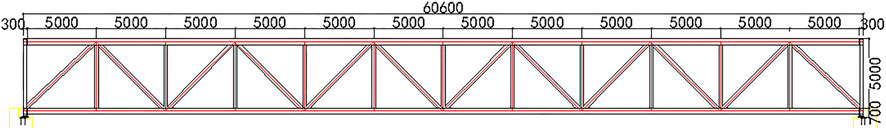
FIGURE 1. Structural elevation of corridor pedestrian overpass (unit: mm).
In this study, ABAQUS FE software is used to develop an FE model for the modal analysis of the footbridge and the response analysis under pedestrians loadings and study the dynamic response of steel truss corridor footbridge under different walking conditions of different people. According to the actual situation of the corridor footbridge, reasonable assumptions are introduced. Solid elements simulate the main body of the steel truss bridge. Shell and solid elements simulate the profiled steel plate and C30 concrete composite panel. A total of 8,152 elements and 12356 nodes are used. All the components are connected by welding. Thus, only the overall response of the structure is considered in this study. The components are all connected by ties. According to the boundary conditions of the actual structure design, the bridge adopts the simple support method for restraint, and the constitutive relationship of each member only considers the elastic stage. The FE model is shown in Figure 2.

FIGURE 2. Finite element model of corridor Footbridge.
The first-order horizontal frequency and the third-order vertical frequency of the structure obtained by FE calculations and the test results are summarized in Table 2 for comparative analysis. The modal shape diagram is shown in Figure 3.
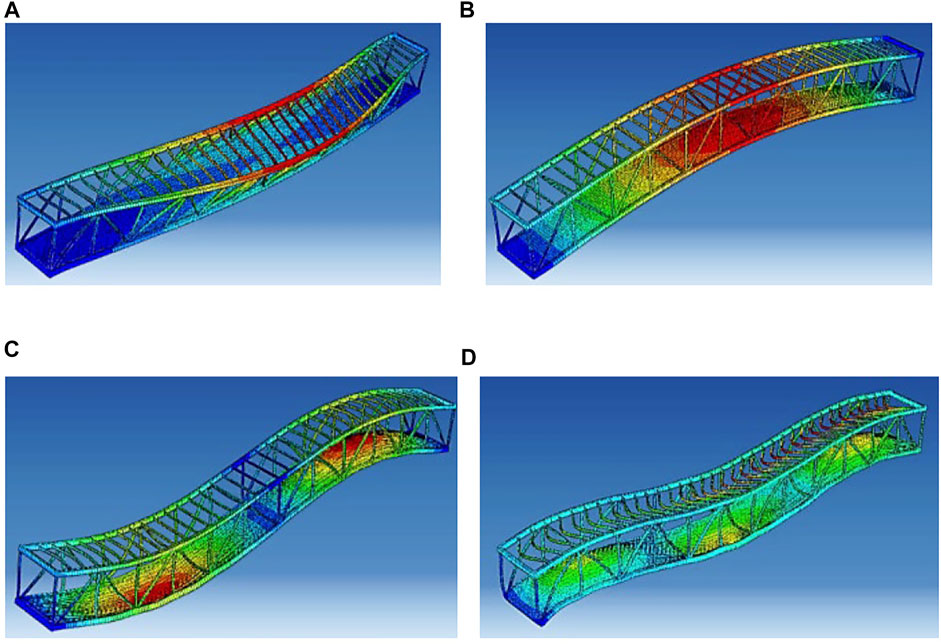
FIGURE 3. Mode shapes (A) Horizontal vibration (fh1 = 2.02 Hz) (B) Vertical first-order vibration (fv1 = 2.72 Hz) (C) Vertical second-order vibration (fv2 = 7.46 Hz) (D) Vertical third-order vibration (fv3 = 10.05 Hz).
Since the pedestrian dynamic load acting on the footbridge is related to time and space, the load distribution model must be defined through the secondary development of ABAQUS. The load subroutine is mainly written in Fortran to realize the loading process. The specific procedure is as follows.
1) It is reasonable to assume that the pedestrian walks in a straight line when crossing the bridge, and the step frequency, step length, and walking speed remain unchanged during walking.
2) The selected loading surface is the footbridge deck. The position where each foot pedals during walking is the position of the load, and all the load positions are selected through the program.
3) During the simulation of walking and running, the moving distance of the load is equal to the product of the moving speed and the analysis step time. When the load moves to the action position, the load is loaded, while the load at other positions is zero. During the step simulation, the load position of a fixed number of people is selected in the middle of the span to add the dynamic load, and the load at other positions is zero.
The single-person walking force formula is expressed in Fourier series form (P. Dallard et al., 2001), as given in Eq. 1. Figure 4 is the single-person walking load time history curve generated by:
where,
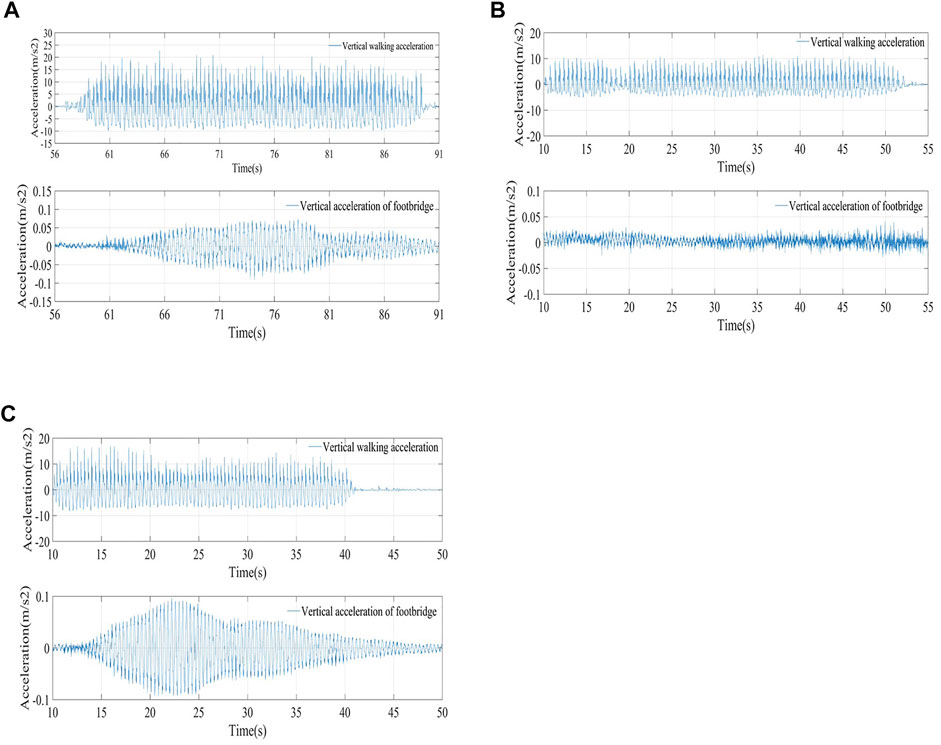
FIGURE 4. Comparison of test and simulation under different working conditions (A) Working condition C2 (B) Working condition C3 (C) Working condition C6
For running load, based on the literature, it is approximated that the dynamic load of pedestrian running is simulated according to walking load Eq. 1 (Li et al., 2010), and the dynamic load factor is taken according to the literature (Živanović et al., 2005).
The FE simulations under pedestrian loads in this paper are divided into two parts.
1) Since free walking needs to select different walking paces, the randomness is too large. Thus, it is meaningless to compare with the test results. Therefore, the working conditions of fixed paces are selected for comparison. Under test conditions C2 (single person running frequency 2.72 Hz crossing the bridge), C3 (single person running frequency 2.72 Hz crossing the bridge), and C6 (7 persons running frequency 2.72 Hz crossing the bridge), the FE simulations are carried out. The calculations and comparison results are as shown in Figure 4. It can be seen from the figure that the vertical acceleration of the footbridge under different conditions is greater than the measured result. This is so because the FE simulations can accurately control the frequency of the added pedestrian load and the first-order fundamental frequency of the footbridge. The simulation of artificial conditions can also achieve the effect of complete synchronization. However, the tester lacks long-term training during the actual test, and the pace cannot be accurately fixed. Thus, it cannot be fully synchronized under multiple artificial conditions, so the test results are generally small. However, it can be seen from the comparison that the vertical response of the footbridge under different working conditions obtained by the FE simulation is consistent with the overall trend of the measured results. Therefore, the FE simulation can effectively simulate the vibration response of the footbridge under the pedestrian load. At the same time, the pedestrian load program written in Fortran language can also accurately simulate the pedestrians crossing the bridge.
2) 3, 5, and 7 people walking in line and side by side at the same step frequency as the natural frequency of the footbridge were simulated. The influence of the pedestrian arrangement on the vibration response of the footbridge was studied. Among these, the mid-span, mid-span side, 1/4-span, and 1/4-span correspond to the measurement points N7, N9, N6, and N5 during actual measurement, respectively. Figure 5 shows the comparison of the vertical response of the footbridge when pedestrians are queuing and walking side by side. It can be seen that under the action of pedestrian load, the response of the centerline of the footbridge is the most significant, the response of the bridge edge is small, and the ratio of multiple people walking in line is parallel. The vertical acceleration response of the footbridge under the action of walking is large, while under the same conditions, the queuing walking is about 1.1 times that of the side-by-side walking. This is attributed to the superposition effect of the pedestrian-induced corridor vibration response when walking in the line.
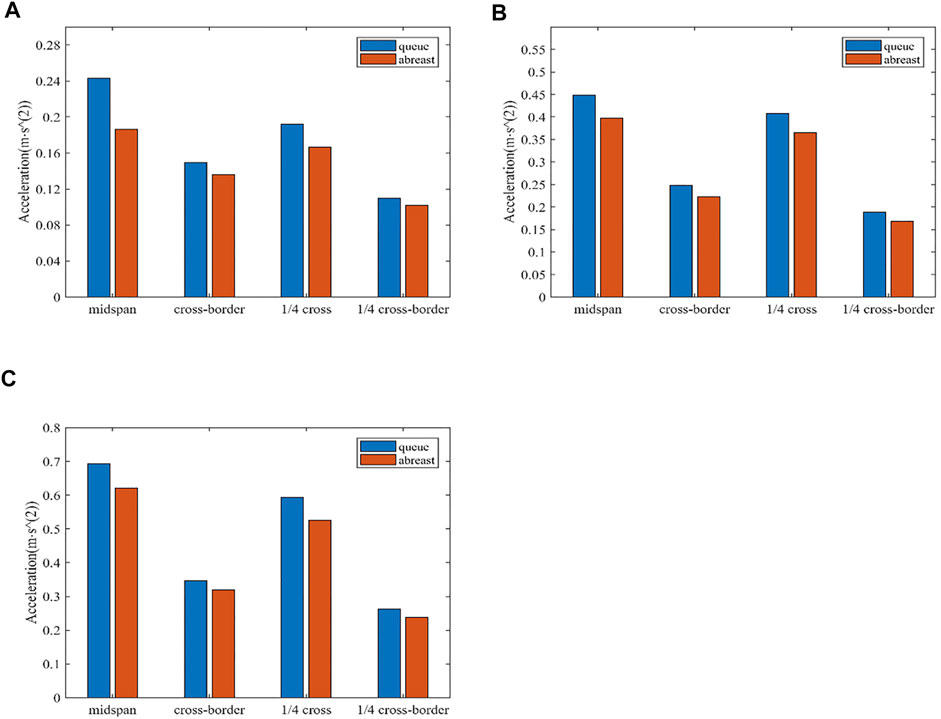
FIGURE 5. Vertical response of footbridges to pedestrian queuing and walking side by side (A) three people walking (B) five people walking (C) seven people walking.
In the test, the X-node three-axis acceleration sensor produced by Embedor was used to test the vibration response of the steel structure footbridge, the correlation parameter is that Maximum sampling frequency is 16 kHz, Sensitivity is 0.66 v/g,Acceleration range (selectable) is ±6 g, Maximum transmission distance is 1.2 km. The Tera Term software was used to collect the response data, and the metronome was used to control the walking frequency of pedestrians.
First, the dynamic characteristics of the structure were tested by the environmental excitation method to obtain the modal structure parameters to better understand the actual working state of the footbridge under the pedestrian loads. In this test, 1, 7, 15, and 35 people pass through the corridor in different forms of motion to test the forced vibration of the structure under a pedestrian load. The specific test conditions are shown in Table 1. To accurately measure the vibration of the footbridge structure and ensure measurement accuracy, the test time is selected at night. During the test, no people or vehicles pass under the bridge, and there is no interference from pedestrians other than the tester on the bridge. Six sensors were chosen to be arranged in the middle span, 1/4 span, and both sides of the bridge, as shown in Figure 6, where N8 is the response point, N4-N7 is the reference point, the sampling frequency is 100 Hz, and the sampling time is 180 s.
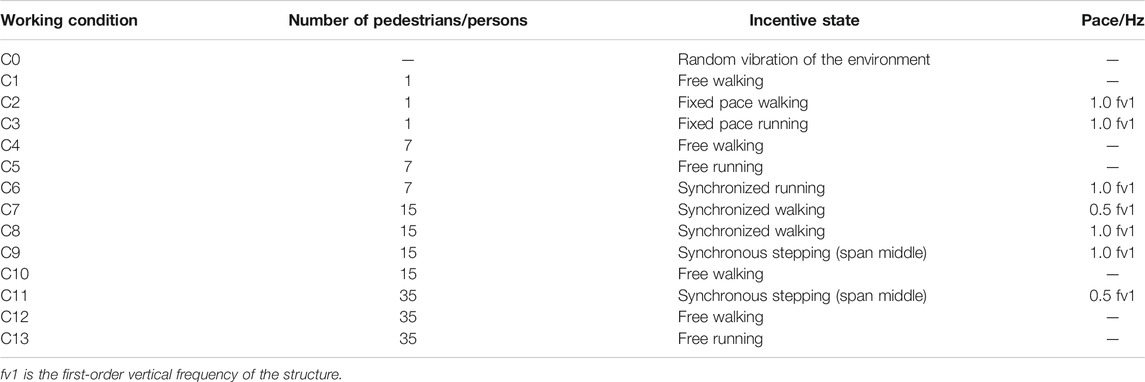
TABLE 1. Vibration test condition.
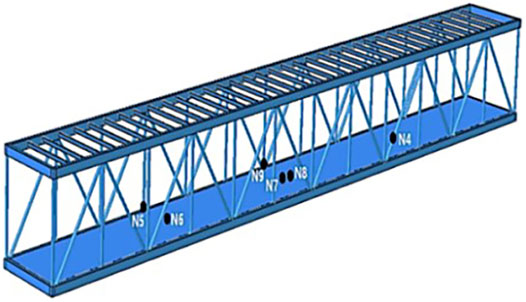
FIGURE 6. Layout of measuring points.
The response signal of the measuring point of the steel structure corridor footbridge was processed by the random decrement method and programmed and calculated by Matlab. Finally, the first three vertical vibration frequencies of the structure were determined as 2.65, 7.35, and 9.74 Hz, while the corresponding damping ratios were 1.09%, 0.87%, 0.57%, respectively. Using the same method to identify the transverse modal parameters, the first-order transverse vibration frequency was 2.06 Hz.
It can be seen from Table 2 that the first-order vibration frequency of the cross-corridor footbridge obtained by testing and calculation exceeds 2 Hz. This is so because the bridge has horizontal supports between the upper and lower chords and the lateral rigidity is relatively large. Therefore, the following simulations do not consider the influence of pedestrian load on the lateral vibration of the structure. The natural vibration frequencies of the corridors simulated by the FE vertical are all within the allowable error range of the project, indicating that the FE model can simulate the actual footbridge structure well. It has been pointed out earlier that the damping of steel structure footbridges is between 0.16% and 1.6% (Pańtak et al., 2012), and the damping ratios obtained in this paper are all less than 1.6%. Therefore, the first-order vertical damping ratio of the test is taken as 1.09% while calculating the pedestrian load response using finite elements in the following text.
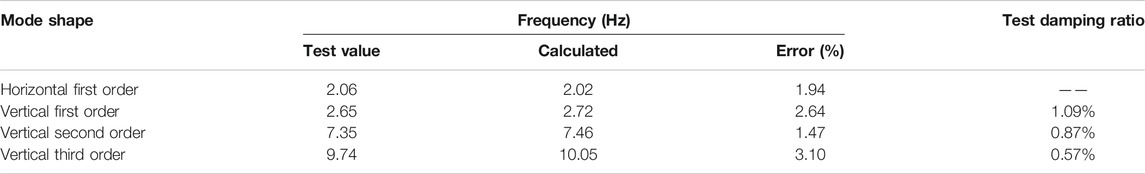
TABLE 2. Comparison table of modal parameters.
During normal use of the footbridge, the pedestrian load on the footbridge is randomly distributed due to the frequent changes in pedestrians density, pace, and walking state on the footbridge. Based on the different numbers of pedestrians passing the bridge at different walking frequencies, the influence of the number of pedestrians on structural vibration was studied in this paper. Three different motion modes of walking, running, and stepping were tested, and the dynamic response of the structure in different motion modes was analyzed. Figure 7 shows the site conditions of the footbridge structure vibration test under partial pedestrian load.
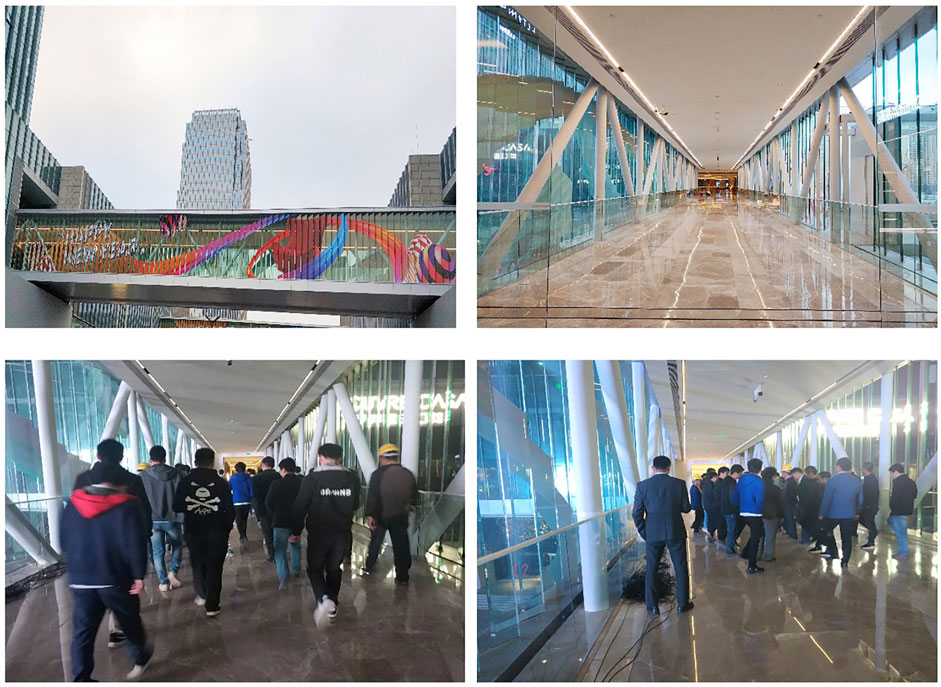
FIGURE 7. Field test.
The specific test conditions and test results are as follows.
A tester was selected to bind a wireless acceleration sensor to the waist (the position of the center of mass of the human body). Before the test, the tester needs to do adaptive training. After the data collector sends the test start signal, the tester walked along the pedestrian at a normal pace. The bridge runs longitudinally from one end of the bridge to the other. After the test of one person freely walking along the bridge, the tester did walk and run fitness training at a frequency of 2.65 Hz according to the metronome prompt, and then walked along the bridge in the same way and completed the corresponding pedestrian and corridor footbridge acceleration. The test results are shown in Figure 8.
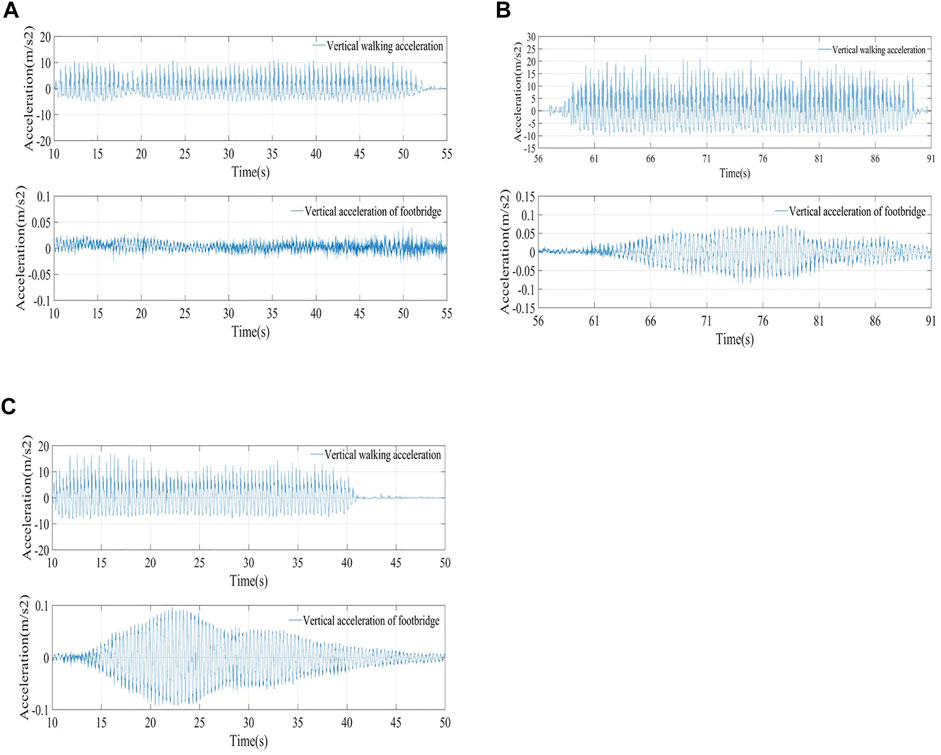
FIGURE 8. Response Curve of the center point of Footbridge under different conditions (A) one person walks freely across the bridge (B) one person crossing the bridge at 1.0 fv1 (C) one person running across the bridge with a frequency of 1.0 fv1.
It can be seen from Figure 8 that when the pedestrian crossing frequency was the same as the first-order vertical bending frequency of the bridge, resonance occurs. After the pedestrian excitation stops, the footbridge decays freely under structural damping. Comparing the footbridge response between walking and running, it is found that the vertical acceleration of the footbridge vibrations caused by running over the bridge is 1.26 times larger than that caused by walking over the bridge under the same resonance condition.
Pedestrians were divided into three groups of 7, 15, and 35 people for the test. The walking route tested under each working condition of each group was the same as the one-person test walking route, i.e., walking from one end of the bridge to the other. In the test of multi-person free walking and free-running across the bridge, the tester can freely surpass the tester in front of him during walking.
In the test of seven people running across the bridge at a pace of 1.0 fv1, the testers are arranged in two rows and four columns. The metronome is adjusted to 159 times per minute (frequency 2.65 Hz), and the others have run in step according to the metronome prompt bridge.
In the test of 15 people crossing the bridge synchronously with a pace of 0.5 fv1, 15 people were arranged in five rows and three columns. The metronome was adjusted to beep 79 times per minute (frequency 1.32 Hz), and the others walked together according to the metronome prompts. When the 1.0 fv1 synchronous bridge test was performed, except for the metronome, which beeps 159 times per minute, the other was the same as the 0.5 fv1 pace synchronous test. In the test of 15 people stepping synchronously with 1.0 fv1, 15 testers concentrated on the mid-span position of the corridor footbridge, and stepped in unison for 100 s by the beat prompt on the loudspeaker.
The response curves of the vibration acceleration and displacement of the mid-span of the corridor footbridge (measurement point N7) under multi-person walking conditions are shown in Figure 9, Figure 10, and Figure 11. It can be seen from Figure 9A that when seven people walk freely across the bridge, the acceleration response of the Footbridge fluctuates within the range of ±0.025 m/s2. Although seven people walking freely did not cause the footbridge to resonate, the vibration response was significantly higher than the structural response under environmental excitation. This is because the gravity effect of the 7 testers on the footbridge structure was significantly higher. From Figure 9B and Figure 9C, it is found that the tester can generate a significant response of the footbridge in the running state. The maximum acceleration of the footbridge caused by seven people running freely across the bridge is 0.31 m/s2. It is evident from the response curve that the structure is resonant during the test. This may be attributable to the influence of the 7 testers on each other during free running. Consequently, the running frequency is more consistent and closer to the fundamental frequency of the footbridge. The maximum acceleration when the footbridge resonance is caused by seven people running synchronously is 0.439 m/s2.
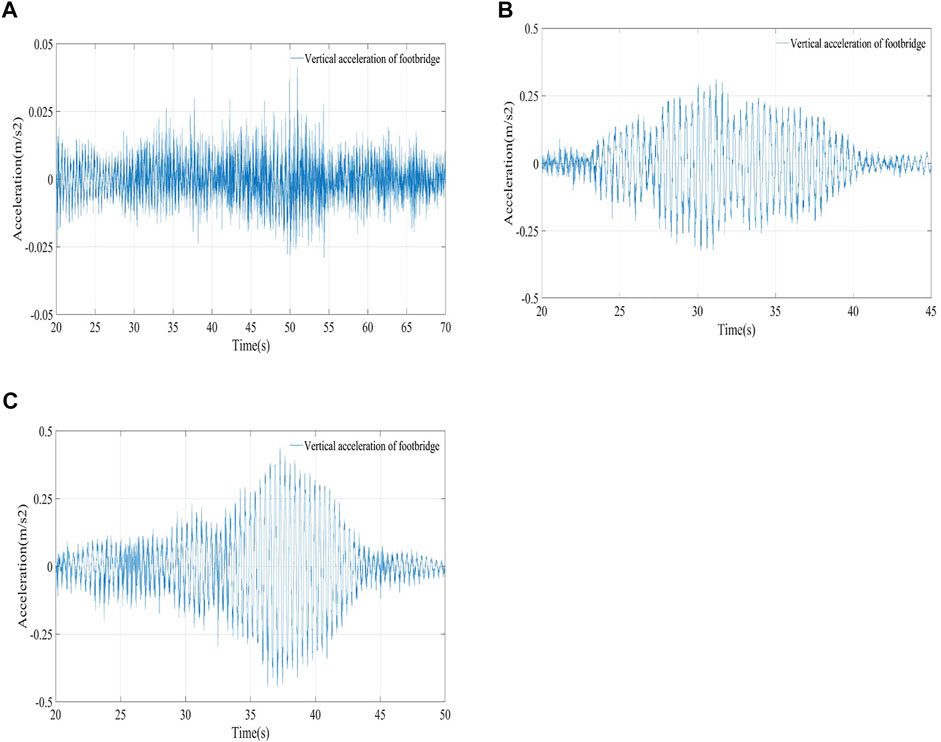
FIGURE 9. Response time history curve of measuring point N7 under 7-persons working condition (A) seven people walk freely across the bridge (B) seven people running freely across the bridge (C) seven people ran across the bridge synchronously at a frequency of 1.0 fv1.
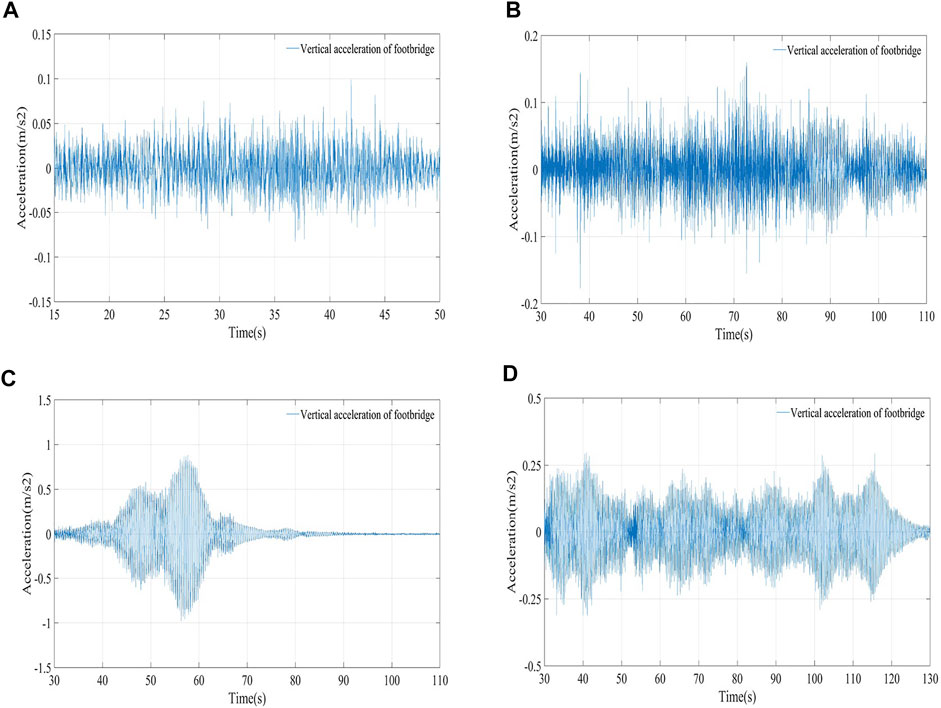
FIGURE 10. Response time history curve of measuring point N7 under 15 peoples working condition (A) 15 people walk freely across the bridge (B) 15 people 0.5 fv1 synchronous bridge (C) 15 people 1.0 fv1 synchronous bridge (D) 15 people 1.0 fv1 synchronized stepping in the middle.
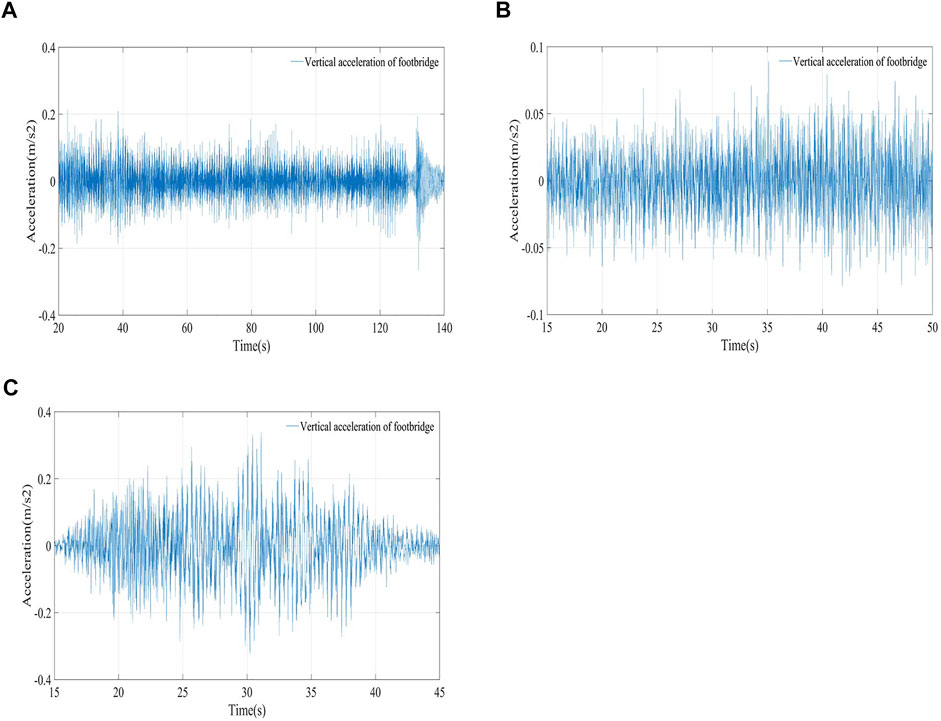
FIGURE 11. Response time history curve of measuring point N7 under 35 peoples working condition (A) 35 peoples 0.5 fv1 synchronized stepping in the middle (B) 35 peoples walk freely across the bridge (C) 35 peoples running freely across the bridge.
It can be seen from Figure 10A that the structural acceleration caused by 15 people walking freely across the bridge fluctuates within the range of ±0.05 m/s2. From Figure 10B, it is seen that the structure acceleration caused by 15 people crossing the bridge synchronously with a step frequency of 0.5 fv1 fluctuates within a range of ±0.1 m/s2, which is about twice that of free walking. This is because 15 people synchronously The multiplication of the walking frequency is equal to the first-order vertical fundamental frequency of the structure so that the corresponding mode of the structure is excited to resonate, and the frequency of free walking is quite different from the resonance frequency. Analyzing Figure 10C and Figure 10D, it can be seen that when 15 people cross the bridge synchronously with a step frequency of 1.0 fv1, the structure causes first-order resonance, and the maximum acceleration of the vibration is 0.884 m/s2. 15 people use a step frequency of 1.0 fv1 The acceleration of structure vibration caused by synchronous stepping in the middle of the bridge fluctuates within the range of ±0.25 m/s2. Comparing Figure 10C and Figure 10D, it is found that with the same frequency of 1.0 fv1, 15 people walking across the bridge is about three times the structural vibration response caused by mid-span stepping, which shows that different forms of motion cause different structural responses.
It can be seen from Figure 11 that the structural acceleration caused by 35 people stepping at the mid-span with a step frequency of 0.5 fv1 is 0.21 m/s2. The structural acceleration caused by 35 people walking freely across the bridge is within the range of ±0.06 m/s2 fluctuation. The maximum acceleration of the footbridge caused by 35 people running freely across the bridge is 0.34 m/s2.
The structural vibration control standards (CJJ, 1996; ISO, 2007) mainly adopt frequency value and acceleration value controls. The current acceleration control indicators include root mean square (RMS) acceleration and peak acceleration. The meaning of the indicators is as follows.
RMS acceleration:
Peak acceleration:
Where
This article comprehensively considers the vertical acceleration limit of the structure given by relevant local and international codes and analyzes the peak acceleration in the test. Table 3 enlists the vibration response acceleration peaks of the footbridges under different conditions.
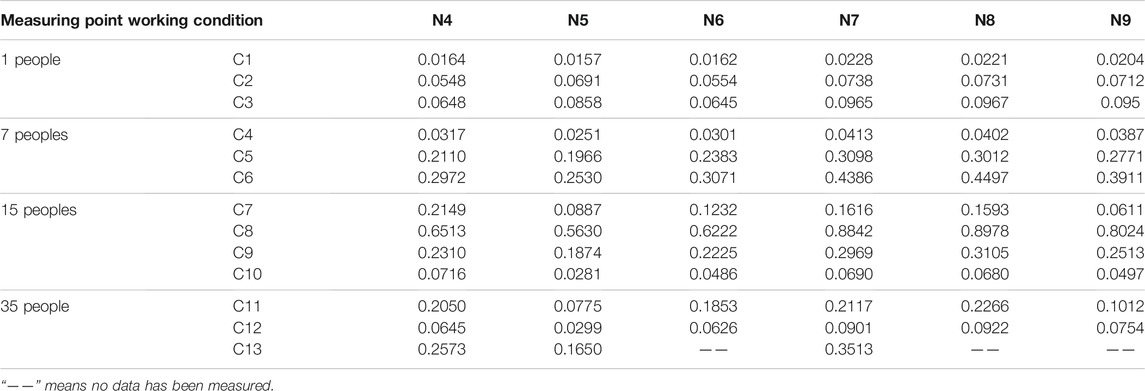
TABLE 3. Acceleration peak value of each measuring point under different working conditions (unit: m/s2).
It is determined that the average error between the acceleration peaks of the two measuring points (N7, N8) in the middle of the span is 2.58%, while the maximum error occurs at operating condition C11, which is 7.02%. The error may be caused because the number of testers cannot be evenly distributed around the two measuring points, and the two sensors cannot be accurately placed across the center. However, the overall error is still within the engineering allowable error range, so the results of this test can be considered reliable.
It can be seen from Table 3 that the peak size of each measurement point of the footbridge vibration response under different working conditions follows the same trend: the mid-span mid-span response is the largest, followed by the mid-span edge, again is 1/4 span, and the smallest is 1/4 span edge. This is due to pedestrians walking on the bridge closer to the corridor axis.
According to the British standard (British Standard Institution, 1978), the vibration comfort of the bridge was evaluated. Ji (Qian and Sun, 2011), Jianguo (Nie et al., 2010), and others also studied the vibration comfort of pedestrian bridges under human excitation. Under the action of pedestrian load, when the structure has a comfort problem, certain measures should be taken to reduce the excessive vibration of the structure (Hui et al., 2020). The tuned mass damper (TMD) as a passive damping device can have effectively reduced the human-induced vibration acceleration of the structure and improve the comfort of the structure (Guo et al., 2021). TMD is mainly composed of a spring that provides stiffness, a damping material that provides damping, and a solid mass that provides mass. By changing the stiffness and mass of the TMD, its natural frequency is changed to approach the natural frequency of the footbridge structure. When the footbridge is excited by external loads and vibrates, the mass of the TMD will move in the opposite direction to the vibration direction of the footbridge, introducing the structure to have inertial force, thereby reducing the vibration of the structure.
If the structure is simplified to a single-mass point system, to reduce the vibration response of the structure under external load excitation, the additional TMD system is used for vibration control. Thus, the entire structure-TMD system becomes a double-mass point system. The equation of motion is expressed as Eq. 2.
In Eq. 2,
Hartog (JPDH, 1956) first theoretically studied the TMD vibration control of an undamped structure under sinusoidal load excitation and calculated the dynamic amplification factor of the structure-TMD system as given in Eq. 3.
Among them, the dynamic amplification factor
It can be seen from Eq. 3 that when the damper system is undamped, and the dynamic load excitation frequency is the same as the frequency of the TMD system, i.e., when
The optimal frequency ratio
It can be seen from the above Eq. 6 that increasing the mass ratio
The above researches on the optimal parameter setting of TMD are all based on undamped structures. Any structure has its damping, and the damping of the main structure has a certain influence on the vibration control results of the TMD system. While considering the self-damping of the main structure, it is more complicated to solve the optimal parameters, and only numerical methods can be used to find the optimal frequency ratio and TMD damping ratio. The optimal parameter formula of TMD with damping structure through numerical analysis method was obtained as Eq. 10 and Eq. 11 (Tsai et al., 2010).
where A is the damping ratio of the main structure.
Cao, 2019 gave the empirical formula for calculating the optimal parameter settings of TMD for damped structures under sinusoidal loads as Eq. 12 through Eq. 15.
Eq. 12, and Eq. 13 are the calculation formulae to minimize displacement, whereas Eq. 14, and Eq. 15 are the calculation formulae to minimize acceleration. At this time, the error of the empirical formula of TMD optimization parameter setting in the range of
Luft. (1979) takes the maximum effective modal damping ratio of the structure-TMD composite system as the optimization objective and gives an analytical expression between the modal damping ratio of the composite system and the TMD parameters without considering the structural damping. The TMD optimization parameter formula is given as Eq. 16 through Eq. 18.
After correcting the finite element according to the measured first-order fundamental frequency of the footbridge, the vertical first-order modal mass m of the footbridge is 105,140 kg, and the vertical first-order fundamental frequency is
The physical parameters of TMD are:
According to the formula for calculating the modal damping ratio of the composite system given by Luft. (1979), the modal damping ratio of the footbridge in this paper after the additional vibration damping device is 3.54. The response time history of the structure before and after vibration reduction is shown in Figure 12A.
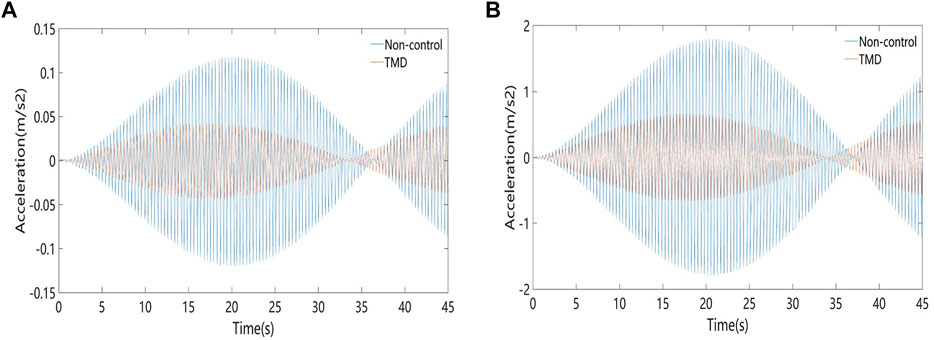
FIGURE 12. Comparison of effects before and after using TMD vibration reduction (A) Vertical response of footbridge in single man resonance (B) Vertical response of footbridge when 15 people resonance.
It can be seen from Figure 12A that TMD has a pronounced vibration reduction effect on the structure. When the pedestrian excitation causes the steel structure corridor footbridge to resonate, the acceleration peak of the structure drops from 0.117 m/s2 to 0.0438 m/s2, and the vibration reduction effect reaches 62.56%. Figure 12B shows the vibration response time history of the bridge when 15 people pass the bridge synchronously before and after vibration reduction. The peak vertical acceleration of the Footbridge after vibration reduction is 0.66 m/s2, which meets the pedestrian comfort Because the lateral and vertical effects of the Footbridge are ignored in the theoretical calculations, and the Footbridge is simplified to a one-dimensional linear structure, the calculation result is too large. Therefore, the use of this method for the TMD vibration reduction design has sufficient safety reserves.
In this paper, the dynamic characteristics of a footbridge in a financial city and the vibration response of pedestrians under dynamic loads are evaluated. Finite element software (ABAQUS) is used for modeling and calculations. Following conclusions are obtained from this study.
1) Technical Specifications for Urban Footbridges and Pedestrians of china require that the fundamental vertical frequency of the structure should be greater than 3 Hz. The first-order vibration frequency of the Footbridge is 2.65 Hz, and the finite element simulation calculation value is 2.72 Hz. The calculation results of the method all show that the fundamental frequency of the flyover does not meet the specification requirements. According to the British BS5400, the vertical acceleration limit of the Footbridge is 0.7 m/s2. The corridor causes the vertical acceleration of the Footbridge to be 0.884 m/s2 when 15 people cross the bridge synchronously, exceeding the British BS5400 specification limit. Thus, It is recommended to take vibration reduction measures.
2) Different motion forms cause different response sizes of the structure. The peak size of each measurement point of the footbridge vibration response under different working conditions follows the same law–the mid-span response is the largest, followed by the mid-span edge. This is so because the pedestrians walking route on the bridge is closer to the mid-span line. The intermediate response is, thus, relatively large.
3) According to the finite element simulation results, multiple people walking in line at the same step frequency as the natural frequency of the footbridge induce more pronounced vibrations, compared to the vertical acceleration response of the footbridge under the action of walking side by side. This is due to the superimposition of the pedestrian-induced vibration response of the corridor when walking effect.
4) After using the TMD system to reduce the vibration of the footbridge, the calculated value of the vertical acceleration response of the footbridge is less than the limit and meets the design requirements. The vibration reduction rate reaches 62.56%, and the vibration reduction effect is excellent.
The raw data supporting the conclusion of this article will be made available by the authors, without undue reservation.
ZC: Data curation, Formal analysis, Investigation, Methodology, Software, Visualization, Writing review and editing. ZC: Formal analysis, Validation, Writing—review and editing. GL: Software, Visualization. XZ: Investigation, Methodology. Formal analysis, Investigation, Methodology, Writing—original draft. SH: Project administration. ZC: Data curation, Funding acquisition. GL: Funding acquisition, paper checking. WZ: Funding acquisition, paper revising.
The work described in this paper was financially supported by the National Natural Science Foundation of China (Grant Nos. 51908146 and 52008109), Foshan Science and Technology Project (1920001001539), technical research related to the third phase of the GAMECO hangar in Guangzhou Baiyun International Airport.
Authors GL and WZ were employed by China Construction Fourth Engineering Division Corporation Ltd. and China Construction Fourth Engineering Bureau Sixth Corporation Ltd.
The remaining authors declare that the research was conducted in the absence of any commercial or financial relationships that could be construed as a potential conflict of interest.
All claims expressed in this article are solely those of the authors and do not necessarily represent those of their affiliated organizations, or those of the publisher, the editors and the reviewers. Any product that may be evaluated in this article, or claim that may be made by its manufacturer, is not guaranteed or endorsed by the publisher.
Brad, D., and Murray, T. M. (2009). Slender Monumental Stair Vibration Serviceability. J. Architectural Eng. 15 (4), 111–121. doi:10.1061/(ASCE)1076-0431(2009)15:4(111)
British Standard Institution (1978). BS 5400-2,Concrete and Composite bridges:Specification for Loads. London: British Standard Institution.
Cao, D. (2019). Analysis of Human-Induced Vibration Response of Long-Span Structures Considering Human-Structure Interaction. Jiangsu: Jiangsu University.
Chen, J., Peng, Y., and Wang, L. (2014). Experimental Investigation and Mathematical Modeling of Single Footfall Load Using Motion Capture Technology. China Civil Eng. J. 47 (3), 79–87. doi:10.15951/j.tmgcxb.2014.03.012
Chen, Z., Yan, Q., and Jia, B. (2018). Simplified Calculation on the Vibration Response of a Footbridge Under Human Walking Loads[J]. Journal of Harbin Engineering University 39 (3), 483–489. doi:10.11990/jheu.201609010
Chen, J., Han, Z.-P., and Brownjohn, J. (2019). Human Shaker Modal Testing Technology via Wearable Inertial Measurement Units. Journal of Harbin Engineering University 32 (4), 625–644. doi:10.16385/j.cnki.issn.1004-4523.2019.04.011
CJJ (1996). CJJ 69-95(1996). Technical Specifications of Urban Pedestrian Overcrossing and Underpass. Available at: https://xueshu.baidu.com/usercenter/paper/show?paperid=3a8417f348288dd87d5dc0121b404fbf&site=xueshu_se.
Dallard, P., Fitzpatrick, T., Flint, A., Bourva, S. L., Low, A., Smith, R. R., et al. (2001). The London Millennium Footbridge. Struct. Eng. 79 (22), 17–33. doi:10.1061/40753(171)138
Du, Y., Liu, L., Zhu, Q., and Chen, K. (2016). Tests for Parameters of Pedestrian Load Model during Human Walking up and Down Stairs. J. Vibration Shock 36 (21), 221–228. doi:10.13465/j.cnki.jvs.2016.21.035
Figueiredo, F. P., da Silva, J. G. S., de Lima, L. R. O., da S.Vellasco, P. C. G., and de Andrade, S. A. L. (2008). A Parametric Study of Composite Footbridges under Pedestrian Walking Loads. Eng. structures 30 (3), 605–615. doi:10.1016/j.engstruct.2007.04.021
Guan, J., Lihua, T., Xin, C., Zhiqiang, Z., and Han, C. (2021). Vibration comfort Analysis of an Indoor Large-Span Steel Corridor Considering Human-Structure Coupling. Building Struct. 51 (08), 43–49. doi:10.19701/j.jzjg.2021.08.008
Guo, H., Wang, K., Wang, D., Liu, Y., Cai, Y., and Gao, Z. (2021). Comfortability Analysis and Vibration Reduction Control of Long-Span Steel Corridor. J. Xi'an Univ. Tech. 37 (2), 269–277. doi:10.19322/j.cnki.issn.1006-4710.2021.02.017
Hui, X., Zhu, Q., Zhang, Q., and Pu, X. (2020). Evaluation of Human-Induced Vibration comfort of Large-Span Corridors Based on Crowd-Structure Coupled Vibration. Building Struct. 50 (14), 120–125. doi:10.19701/j.jzjg.2020.14.021
ISO (2007). ISO 10137 (2007) Bases for Design of Structures - Serviceability of Buildings and Walkways against Vibrations. Available at: https://www.iso.org/obp/ui/#iso:std:iso:10137:ed-2:v1:en.
Jian, F.-L., Wu, D.-J., and Li, Q. (2010). Human-Induced Vibration Analysis of Pedestrian Suspension Corridor in Shanghai Hongqiao Station [J]. Journal of Vibration and Shock 29 (8), 136–140. doi:10.13465/j.cnki.jvs.2010.08.032
Kim, S. B., Lee, Y. H., Scanlon, A., Kim, H., and Hong, K. (2008). Experimental Assessment of Vibration Serviceability of Stair Systems. J. Constructional Steel Res. 64, 253–259. doi:10.1016/j.jcsr.2007.07.003
Li, A., Chen, X., and Zhang, Z. (2010). Design and Analysis on Vibration Control of Long-Span Floor Ructures. J. Building Structures 31 (6), 160–170. doi:10.14006/j.jzjgxb.2010.06.001
Li, Z., Wu, D., Liu, X., et al. (2019). Vibration and Resonance Response Analysis of Footbridges under Actual Walking Load. noise and vibration control 39 (6), 165–168. Available at https://kns.cnki.net/kcms/detail/detail.aspx?dbcode=CJFD&dbname=CJFDLAST2020&filename=ZSZK201906030&uniplatform=NZKPT&v=gucsnkyCJkLCt7ib5CAc0njCYzSJdI0Gtvz2JWYhurBksDMuUw6IyACGAT7i-_U.
Luft, R. W. (1979). Optimal Tuned Mass Dampers for Buildings. J. Struct. Division 105 (12), 2766–2772. doi:10.1061/JSDEAG.0005323
Matsumoto, Y., Griffin, M. J., and Riffin, M. J. (1998). Dynamic Response of the Standing Human Body Exposed to Vertical Vibration: Influence of Posture and Vibration Magnitude. J. Sound Vibration 212 (1), 85–107. doi:10.1006/jsvi.1997.1376
Nie, J., Chen, Y., and Fan, J. (2010). Root Mean Square Acceleration Response Spectrum Method for Vibration of Single-Span Footbridge under Walking Load. China Civil Eng. J. 43 (9), 109–116. doi:10.15951/j.tmgcxb.2010.09.002
Pan, N., Fang, W., Li, G., Huang, Z., and Liu, H. (2017). In-situ Test Study on Floor Vibration Response under Walking Loads. Building Struct. 47 (13), 32–35. doi:10.19701/j.jzjg.2017.13.006
Pańtak, M., Jarek, B., and Średniawa, W. (2012). Application of [EN] 1990/A1 Vibration Serviceability Limit State Requirements for Steel Footbridges. Proced. Eng. 40, 345–350. doi:10.1016/j.proeng2012.07.106
Pavic, A., Reynolds, P., and Sachse, R. (2003). Human-structure Dynamic Interaction in Civil Engineering Dynamics: a Literature Review. Shock&Vibration Dig. 35 (1), 1–54. doi:10.1177/0583102403035001624
Piccardo, G., and Tubino, F. (2009). Simplified Procedures for Vibration Serviceability Analysis of Footbridges Subjected to Realistic Walking Loads. Comput. Structures 87 (13/14), 890–903. doi:10.1016/j.compstruc.2009.04.006
Qian, J., and Sun, L. (2011). Human-induced Vibration Comfort Evaluation and Vibration Reduction Measures of Long-Span Footbridge. J. Shanghai jiaotong Univ. 45 (5), 677–681. doi:10.16183/j.cnki.jsjtu.2011.05.011
Tsai, H. C., and Lin, G. C. (2010). Optimum Tuned‐mass Dampers for Minimizing Steady‐state Response of Support‐excited and Damped Systems. Earthquake Eng. Struct. Dyn. 22 (11), 957–973. doi:10.1002/eqe.4290221104
Warburton, G. B. (1982). Optimum Absorber Parameters for Various Combinations of Response and Excitation Parameters. Earthquake Eng. Struct. Dyn. 10 (3), 381–401. doi:10.1002/eqe.4290100304
Zhou, B., Ren, X.-s., and Lv, X.-l. (2012). Vibration Analysis of Indoor Spiral Steel Stair under Pedestrians' Activity. J. vibration Shock 13 (14), 128–132. doi:10.13465/j.cnki.jvs.2012.14.033
Zhu, Q., Ma, F., Zhang, Q., et al. (2017). Experimental Study on Vertical Dynamic Coupling Effect of Pedestrian-Structure. Building Struct. 47 (13), 32–35. doi:10.14006/j.jzjgxb.2019.0464
Keywords: steel corridor structure, footbridge, dynamic response, pedestrian incentive, numerical analysis, tuned mass damper
Citation: Chen Z, Chen Z, Li G, Zhang W, Zhang X, Huang S and Chen Z (2022) Dynamic Response Analysis and Vibration Reduction of Steel Truss Corridor Pedestrian Bridge Under Pedestrian Load. Front. Mater. 9:839265. doi: 10.3389/fmats.2022.839265
Received: 19 December 2021; Accepted: 13 January 2022;
Published: 14 February 2022.
Edited by:
Airong Liu, Guangzhou University, ChinaReviewed by:
Zhang Zhuojie, Shijiazhuang Tiedao University, ChinaCopyright © 2022 Chen, Chen, Li, Zhang, Zhang, Huang and Chen. This is an open-access article distributed under the terms of the Creative Commons Attribution License (CC BY). The use, distribution or reproduction in other forums is permitted, provided the original author(s) and the copyright owner(s) are credited and that the original publication in this journal is cited, in accordance with accepted academic practice. No use, distribution or reproduction is permitted which does not comply with these terms.
*Correspondence: Zhou Chen, Z3NjejE5ODYxOTg1QGZvc3UuZWR1LmNu
Disclaimer: All claims expressed in this article are solely those of the authors and do not necessarily represent those of their affiliated organizations, or those of the publisher, the editors and the reviewers. Any product that may be evaluated in this article or claim that may be made by its manufacturer is not guaranteed or endorsed by the publisher.
Research integrity at Frontiers
Learn more about the work of our research integrity team to safeguard the quality of each article we publish.