 Yiyi Zhang
 Guangfeng Gu
 Jiefeng Liu1
 Yufan Fan
 Junwei Zha
95% of researchers rate our articles as excellent or good
Learn more about the work of our research integrity team to safeguard the quality of each article we publish.
Find out more
ORIGINAL RESEARCH article
Front. Mater. , 26 April 2022
Sec. Polymeric and Composite Materials
Volume 9 - 2022 | https://doi.org/10.3389/fmats.2022.838792
This article is part of the Research Topic Advanced Technologies for Electrical Engineering View all 6 articles
The polarization/depolarization curve (PDC), which contains abundant insulation information, is widely used to evaluate the insulation condition of the cross-linked polyethylene (XLPE) cables. However, the insulation condition assessing the result of the XLPE cables is usually inaccurate using the PDC technology because the parameters of the current Debye model are determined in a uniform aging hypothesis, instead of a real non-uniform situation. To solve this problem, the modified Debye model considering the real non-uniform situation is proposed, and the effectiveness of the modified model is proved by the comparison of the PDC test results with non-uniform and uniform aging materials. It is found that the parameters of the extended Debye model tend to overestimate the cable insulation performance, while the characteristic parameters obtained by the modified Debye model better reflect the real situation of cable non-uniform aging. Result analysis shows that the proposed method has better accuracy in the insulation condition evaluation of cables.
Over the past decade, the XLPE power cable has been widely used all over the world due to its outstanding transmission stability and economy, as well as it is laid underground without occupying space resources (David et al., 1996; Barber, 2000; Roservear, 2000). The XLPE cable is the most important energy transmission equipment in the power grid; thus, its insulation performance has attracted extensive concern to avoid unpredictable economic losses caused by failure. In order to study the insulation performance of XLPE, the insulation layer has been taken as the main research objective, which determines the insulation ability of the cable and directly affects the stability and life of the cable.
The degradation of cable insulation decreases the reliability of power transmission and puts the power grid at risk. Existing studies have shown that long-term exposure of power cables to high temperature, water, and electric fields could lead to insulation problems, among which thermal aging is the vital factor (Lyle, 1988; Roservear, 2000; Aras et al., 2007). In order to ensure the industrial production and the lives of residents, the research on the insulation performance of XLPE cables under thermal aging conditions should be considered.
Most studies on XLPE cables are evaluated using traditional electrical methods. However, the limitations in the practicality of the traditional methods need further improvement. For example, the insulation information carried by using the insulation resistance method is insufficient. The withstand voltage test is limited to ultralow frequency and is destructive (Zhenquan et al., 2009). In addition, the oscillation wave test is mostly used for local defect detection, which is not able to determine the overall situation (Zhu et al., 2019).
In order to solve these problems, a dielectric response technology based on the dielectric theory has developed rapidly in recent years and has been recognized in this industry. Especially, the polarization and depolarization current (PDC) method based on time-domain dielectric response technology is widely used in cables because of its rich insulation information, convenient measurement, and intuitive results (Talib et al., 2013; Ye et al., 2016).
Until now, PDC is proven suitable for condition assessment of the XLPE cable. The aging condition of the insulation can be reflected effectively from its dielectric information such as the curve slope and shape (Beigert and Kranz, 1994; Oyegoke, 2016). Furthermore, there are some relations between internal traps and aging degree, which can be expressed by the aging factor A (Birkner, 2004). These are helpful for the monitoring and evaluation of cable operation.
However, during the operating cycle of the cable, the temperature of the XLPE insulation layer, close to the cable core, is much higher than that far away from it. The temperature difference is about 10–30°C (Li et al., 2009). Thus far, previous studies have assumed that the cable is subjected to uniform aging at the same temperature from the surface of the XLPE insulation layer to the area close to the cable core. Although several studies can evaluate the aging condition of the cable to some extent by an aging factor or other PDC parameters (Morsalin et al., 2019; Morsalin and Phung, 2020), a long-term radial temperature difference of the whole insulation layer will lead to an insulation performance difference in different areas inevitably, and the PDC results should not be the same. Accordingly, the existing methods to evaluate the aging condition of cables are not consistent with the actual situation. The evaluation method for thermal aging of the XLPE cable needs further study. Based on the aforementioned situation, this study takes the non-uniform thermally aged cable, which is more realistic, as the research object and proposes a time-domain dielectric evaluation method based on the modified Debye model. This is of great engineering value to ensure safe and reliable operation of cables.
In this article, the non-uniform aging samples with different states and the uniform aging samples with the same geometric parameters were prepared and used for the PDC test. The modified Debye model was used to extract the dielectric characteristics of each sample, the relationship between them, and the degree of non-uniform thermal aging was studied. The result of research shows that the modified Debye model better reflects the real situation of cable non-uniform aging; this is of great engineering value to ensure safe and reliable operation of cables.
The XLPE cable commonly works in the temperature range of 60–80°C, which is higher than the temperature of environment. It leads to an increasing temperature gradient between the outer sheath and core of the cable. Thus, the XLPE insulating layer between the outer sheath and the core is non-uniformly aged.
So as to analyze conveniently, this study regards some parts with little temperature difference as an isothermal area, and sequentially numbered, which conforms to T1 > T2 > T3 > … > Tmin.
The extended Debye model uses a resistor and a capacitor in series to equivalent the relaxation polarization process of the dielectric. However, the extended Debye model with a series of resistor and capacitor circuits is not sufficient to reflect the complex polarization process. Therefore, a set of exponential functions containing multiple relaxation elements is established, which corresponds to the parallel connection of multiple resistance and capacitor branches in series in the circuit model. Thus, the complex polarization process can be represented by the sum of the functions. The extended Debye model is shown in Figure 1, which is regarded as the most equivalent model for aged cables, where R0 and C0 are the insulation resistance and vacuum capacitance of XLPE respectively. i is branch number, Ri and Ci (1 < i < n) is the lossy relaxation polarization at different relaxation times, the aforementioned parameters can be calculated by polarization and depolarization current (Saha et al., 2005; Kumar and Mahajan, 2010).
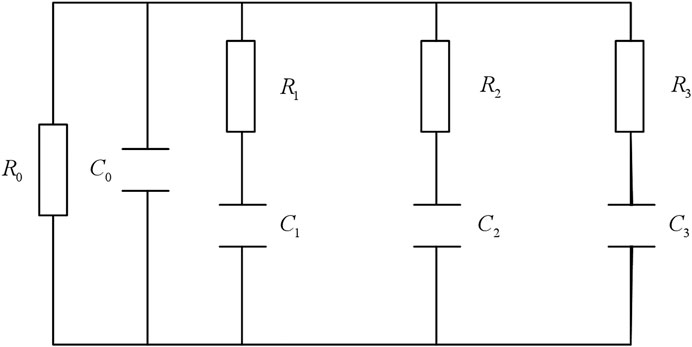
FIGURE 1. Extended Debye model.
The current obtained by the galvanometer is polarization current ip(t) when the DC voltage U0 is applied at both ends of the sample. If the DC power is disconnected after tc time and the two ends of the sample are shorted, the measured current will be depolarization current id(t).
The relaxation process of any dielectric can be represented by both energy dissipation and storage elements, such as the extended Debye model (Saha et al., 2005; Kumar and Mahajan, 2010). Assume that a certain dipole group is randomly distributed in the insulation and changes evenly as time, which is an important premise that the model can represent the relaxation process of a specific dipole group with a single RC branch in series.
Unfortunately, during the normal operation of real cable, there is a temperature gradient in the insulation layer, which leads to a difference of dipole relaxation process in the same polarization type of each region. Moreover, the XLPE insulation is uniformly aged only in the isothermal region, and insulation characteristics of different isothermal regions are much different through long-term accumulation. At this time, the specific polarization type cannot be represented by a polarization branch containing only one impedance, which the extended Debye model does not take into account. Therefore, it is necessary to further improve the extended Debye model to characterize the aging degree of cable insulation under real operating conditions accurately.
As shown in Figure 2, the modified Debye model can be used to characterize the non-uniform aging of cables by providing the insulation characteristics of each isothermal area in each branch equal to an impedance Zj(mj) (Xiaofeng et al., 2016), where j is the number of model branch and mj is the number of isothermal areas of j branch. In particular, the physical processes represented in Figures 1, 2 are only different in temperature distribution, and the polarization type is still similar, so the number of branches in the model is equal. In Figure 2, each polarization impedance consists of polarization resistance and a polarization capacitance in series, which represents the dielectric characteristics of different polarization types in different isothermal areas.
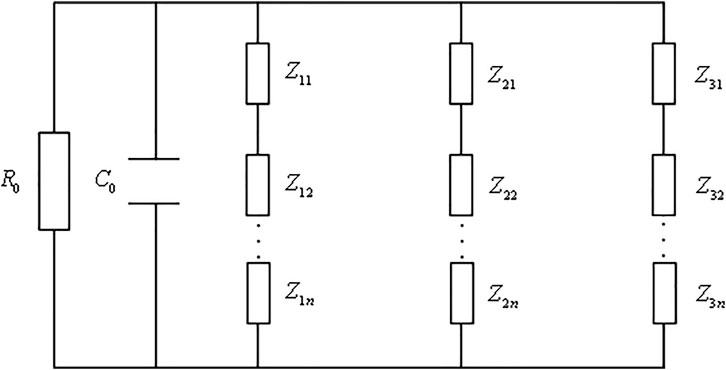
FIGURE 2. Modified Debye model.
The parameters of the modified Debye model can be obtained in steps Ⅰ to Ⅳ. The model’s parameter identification should begin with the polarization impedance Z*(t) (Zhao et al., 2019), which is shown in Eq. 1:
1) Obtain the depolarization current curve id (t) of the samples by the PDC test, and calculate the Z *(t) by using Eq. 1.
2) The last region H of Z* (t) curve is evenly divided into mn parts, and the insulation characteristics of which can be characterized by the maximum time constant branch of the modified Debye model. Then Zj (k, t) can be calculated by using Eq. 2, and regard the adjacent parts with an error of less than 1% as an isothermal region.
where Zj (k, t) is the polarization impedance of the kth isothermal area in the jth branch of the modified Debye model and |Zj (k, t)| and τj (k) represent the amplitude and the time constant of Zj (k, t), respectively.
3) The polarization resistance Rj (k) and polarization capacitance Cj (k) can be obtained by using Eq. 3 with the previous results:
4) When Z *(t) subtracts the maximum time constant branch impedance, a new impedance curve can be obtained, and then parameters of sub maximum time constant branch can be identified by repeating Ⅰ to Ⅲ. Thus, all parameters can be calculated by analogy.
It should be noted that the inflection point of Z *(t) curve slope is taken as the critical point of region H. Since there are multiple branches in the modified Debye model of XLPE cable, in order to keep the fitting error of different branch parameters consistent, 1% is taken for every branch in this study.
Apparently, the insulation layer of the cable determines its insulation performance. Thus, in order to simplify the process of the experiment, XLPE discs are used to prepare non-uniform aging samples which can simulate non-uniform aging of cables conveniently.
The disk samples are made of 10 kV XLPE material from Nordic Chemical Company, which has a thickness of 1.5(±0.05) mm and a radius of 16(±0.2) cm. The disk samples are cleaned with anhydrous ethanol to remove impurities on the surface and dried in a vacuum dryer oven for 48 h at a temperature of 80°C and a pressure of 50 pA to eliminate the effects of water vapor, cross-linking by-products, and mechanical stress in order to achieve the desired cable insulation state.
Crystallization of the XLPE material can be destroyed by thermal aging under long-term effect (White et al., 2000). In this study, accelerating thermal aging is used to produce the XLPE samples with various aging degrees at the temperatures of 130, 140, and 150°C, last for 7, 15, 25, and 40 days at each temperature, all samples are numbered as shown in Table 1. Furthermore, each non-uniform aging sample consists of three discs samples aged with different temperatures and the same aging time. For example, a non-uniform aging sample at 140°C, 15 days is composed of N2, N6, and N10 samples. On the contrary, three N6 samples constitute a uniformly aged sample at 140°C for 15 days. All sample numbers and production methods are shown in Table 2, where X and Y represent the non-uniform sample and uniform sample, respectively.
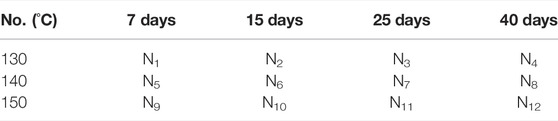
TABLE 1. Aging time and temperature of disc samples.
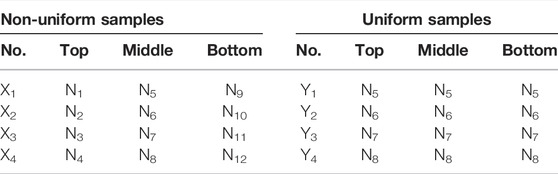
TABLE 2. Composition of the non-uniform and the uniform samples.
Especially, preliminary experiments found that there are always three isothermal areas in the modified Debye model if the non-uniform sample consists of more than three layers. Therefore, this study decided to make the non-uniform thermal aging samples with three layers.
To improve the stability of the PDC data, samples in Table 2 are placed in three-electrode and measured at 60°C. The ip (t) and id (t) can be measured under a DC voltage of 200 V (polarization voltage) for 1,500 s (polarization depolarization time).
Furthermore, to avoid current interference, the measurements should be performed in an electromagnetic-free environment. Thus, the three-electrode is grounded and housed in a metal shielding box in this study.
Figure 3 shows the depolarization current curve of the non-uniform samples. Since switching may lead to impulse current, in this study, the curve is recorded after 10 s. It is easy to discover from the Figure 3 that the sample current amplitude is at the order of pA. The current is roughly divided into two parts according to the inflection point. The front section decreases rapidly is regarded as the high-frequency part, while the middle and rear section stabilizes gradually, called the low-frequency part. In addition, with the increase of aging time, the critical point of the two parts gradually moves to the left, and the current value becomes larger when it is relatively stable. This result could be explained by the fact that thermal aging increases the number of defects in the XLPE and destroys the cross-linked structure, and produces more aging products, charged particles, and molecular groups. Thus, the discharge process is accelerated and the conductivity is increased. For non-uniform aging samples, these characteristics are similar to the existing uniform aging research results (Baral and Chakravorti, 2013).
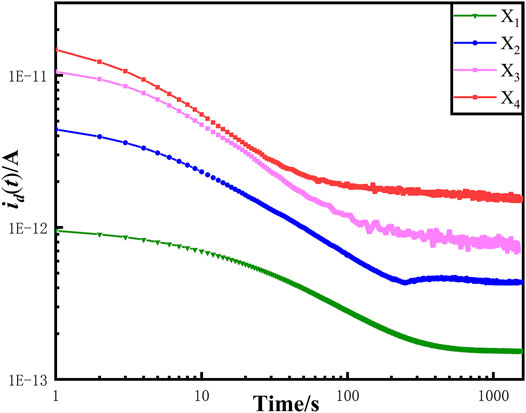
FIGURE 3. PDC curve under different aging time.
Although the internal changes of the XLPE caused by uniform and non-uniform thermal aging are essentially the same, the different aging processes could change the distribution of materials that influence the charge movement, such as dipole pairs and charged particles, which leads to difference between the uniform and non-uniform aging results. It can be seen from Figure 4 that the depolarization current of X is larger than that of Y in the high-frequency part at any aging time. Furthermore, in the low-frequency part, the two current values are gradually close to each other or even coincide. In addition, the coincidence degree of samples with different aging modes decreases with an increase in aging. It can be inferred that the non-uniform aging causes the density imbalance of the materials involved in the charge movement in the insulation. This phenomenon leads to the larger current in the initial discharge than that in the uniform aging sample. When the current decays in the later stage, the effect of different density becomes weaker.
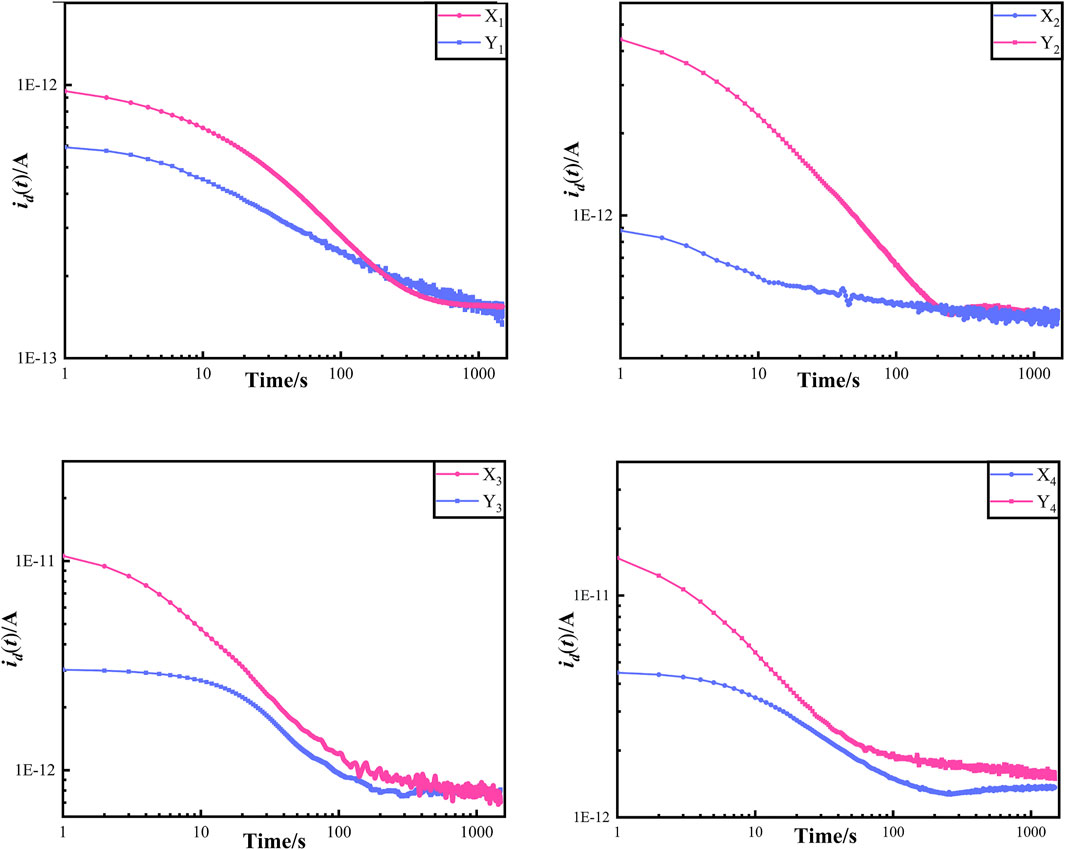
FIGURE 4. PDC curve under different aging type.
The parameters of the modified Debye model and extended Debye model of the X1, X2, X3, and X4 samples are shown in Table 3. Rj (k) and τj (k) of the same branch decline gradually with the decrease of isothermal area numbers. Because a smaller number represents a higher aging temperature of XLPE samples, it results in higher polarization strength, faster polarization response speed, and worse insulation conditions. In addition, the biggest change occurs in the parameters of the 3rd branch, as given in Table 3. It is generally believed that the largest time constant branch characterizes the characteristics of solid insulation, and these parameters are calculated first during identification. Therefore, the parameters are most sensitive to the degree of non-uniform aging.
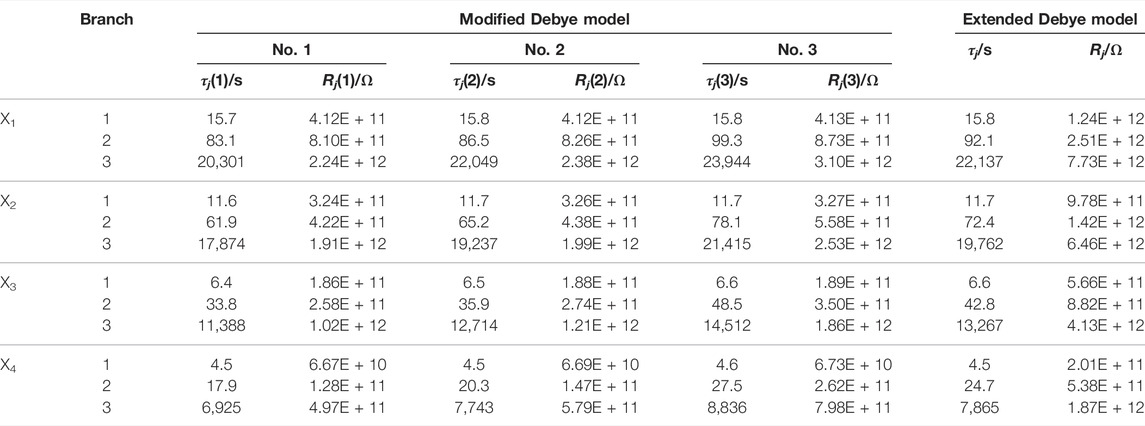
TABLE 3. Parameters of the modified Debye model and extended Debye model for X1, X2, X3, and X4 samples.
Compared with the modified Debye model, the time constant of each branch in the extended Debye model is between the maximum and minimum isothermal areas of the extended Debye model, and the polarization resistance is approximately equal to the sum of the polarization resistances of isothermal areas, as shown in Eq. 4:
where τj and Rj are time constant and polarization resistance of the jth branch in the extended Debye model, respectively. If all isothermal areas of any branch in Figure 2 are combined, the polarization resistance is equivalent to that of the branch corresponding to the extended Debye model. The results strongly prove that the modified Debye model is correct in analyzing the aging condition of XLPE.
However, the characteristic variable of XLPE thermal aging insulation condition evaluation proposed in the existing literature is mostly based on the parameters of the extended Debye model (Saha et al., 2005; Kumar and Mahajan, 2010). In order to determine the accuracy of the extended Debye model in this respect, the deviation rate of each isothermal area is given in Table 4 and expressed as Eq. 5:
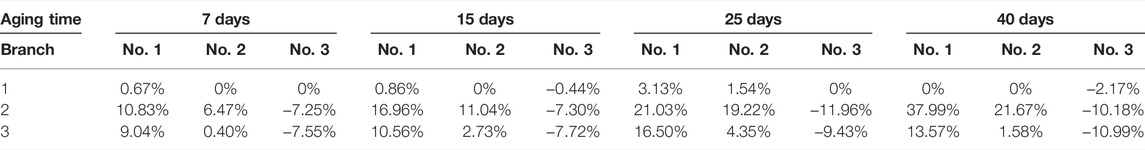
TABLE 4. Deviation rate of each isothermal area.
It can be seen from Table 3 that each isothermal area in the No. 1 branch of X3 has the smallest deviation rate, which can be basically ignored. The |ΔX| of No. 2 and No. 3 branches increases with aging time, and it is negative in the No. 3 isothermal area. This confirms that the insulation condition of lower heating temperature parts is often underestimated when using the extended Debye model. Meanwhile, the parts with higher heating temperature are overestimated. This situation leads to errors in the evaluation results. Therefore, the non-uniform thermal aging effect of cable should be considered when adopting the PDC method, and the modified Debye model should be used to analyze it.
It is unavoidable that a large number of chemical impurities and structural defects can be produced during XLPE production and manufacture. These defects will form different trap levels which capture charge carriers, in the forbidden band of polymers. According to the J.G. Simmons theory (Simmons and Tam, 1973), under a high electric field, the carriers escaping from traps will move out of the medium directionally and rapidly, which become hot electrons. The most important thing is that the generation and energy of hot electrons are determined by the density and depth of traps, which are deeply affected by aging. Therefore, the aging condition must be inferred from the change of traps in XLPE. It provides a theoretical basis for quantitatively expressing the XLPE aging condition.
The PDC method needs to analyze the region occupied by electrons above the Fermi level. At constant temperature, the relationship between the depth of the electron trap and time can be expressed as Eq. 6 (Watson, 1988; Watson, 1995):
where |Ec - Etn| is the electron trap energy level, k is the Boltzmann constant, and v is the electron vibration frequency. In addition, variation of the depolarization current Id with time is shown in Eq. 7:
where f0 (w) is the initial density of the electron trap, N (E) is the density of the trap energy level, q is the charge of the electron, and d is the thickness of insulation. Obviously, Id (t) is directly proportional to N (E), and Id (t) can be used to study the density of electron trap energy level in the insulating materials. In this study, the third-order exponential decay function is used to fit Id (t) (Ye et al., 2016), as shown in Eq. 8:
where i represents three polarization types, i = 1 represents the subject polarization of the insulation material, i = 2 represents the interfacial polarization between crystalline and amorphous states, and i = 3 represents the interfacial polarization between various ions and groups after aging, αi is coefficient, and τi is the time constant. Consequently, the charge can effectively characterize XLPE aging degree by aging factor A (Birkner, 2004), as shown in Eq. 9:
Larger A indicated a deeper level of traps and more serious aging conditions. However, it can be inferred from the preceding paragraph that there is a difference between non-uniform and uniform aging, whether from the PDC curve or Debye model parameters. In order to make assessment results more realistic and accurate, it is necessary to express Id (t) by using Eq. 10:
where is the pre-exponential factor of the kth isothermal area in the jth branch, Id (t) is equal to the sum of currents in the three branches of the modified Debye model, and the current of each branch is superimposed by the current of each isothermal zone. Therefore, the modified aging factor is expressed as Eq. 11:
Table 5 shows A and Amod of the samples. First of all, it can be noted that Amod and A both increase with the degree of aging, and the degree of change becomes small gradually. It shows that the insulation performance of cable changes rapidly in early stages and is slow in the end. Second, Amod is larger than A in each stage, and the gap between the two is widening, which means with the influence of temperature gradient on insulation is greater with the aggravation of aging. Finally, it is interesting that compared with the criteria in Table 6 (Gao et al., 2015), A indicates a good insulation stage of the cable, while Amod indicates that the cable has been moderately aged for 15 days when the aging time is 7 days or 15 days. Consequently, in the qualitative assessment, there are usually some qualitative assessment errors for cables in the middle aging stage. In summary, Amod characterizes the non-uniform aging condition of cable insulation more accurately, and a PDC test should be carried out for the cable in the middle of the operation, so as to ensure the stability of the power system to a greater extent.
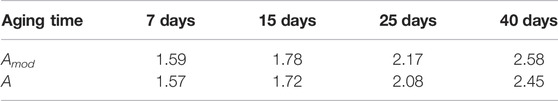
TABLE 5. Amod and A of non-uniform samples.
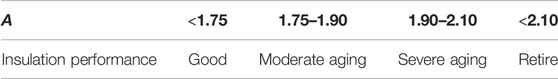
TABLE 6. Non-uniform thermal aging condition evaluation.
The aging will directly affect the mechanical properties of the cable. It is well known that the elongation at break reflects the mechanical aging degree of XLPE, and the elongation at break retention EAB is a recognized standard to judge the insulation failure of XLPE. The insulation performance of the cable has been lower than the standard of safe operation when EAB = 50%. In order to further improve the accuracy of Amod, this study analyzes the relationship between the insulation and mechanical properties. The EAB is calculated by using Eq. 12, and the corresponding relationship between Amod, A, and EAB is established as shown in Figure 5.
where k0 is the elongation at the break of the unaged sample. The fitting curve of A and EAB shown in Figure 5 is derived by using Eq. 13:
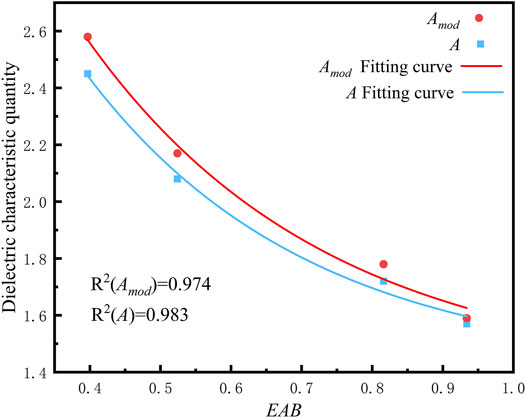
FIGURE 5. Relationship between mechanical parameters and dielectric parameters.
The fitting curve of Amod and EAB is calculated by using in Eq. 14:
If the value of the state boundary point of X4 is brought into Eq. 13, the corresponding elongation at break can be calculated. Meanwhile, in a perfect state, 0.833 and 0.667 divide EAB into three sections. It is not difficult to find from Figure 6 that the error between the perfect value and the measured value is small, which shows that there is a corresponding relationship between mechanical characteristic quantity and electrical characteristic quantity. Based on this point, Amod can be divided into four stages according to EAB, as shown in Table 7.
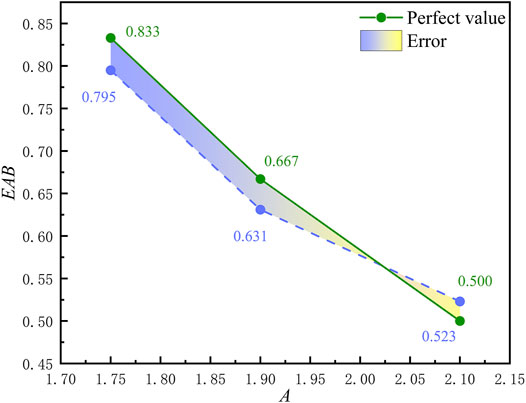
FIGURE 6. Perfect and measured values of EAB at the state boundary point of A.

TABLE 7. Reference for insulation condition evaluation according to Amod.
As mentioned before, Amod is supposed to be more effective as a dielectric parameter for analyzing the non-uniform thermal aging state of XLPE cable. In order to verify the accuracy of the proposed evaluation reference, four XLPE cables in operation are considered as the research object of this part. The depolarization current and Amod are shown in Figure 7.
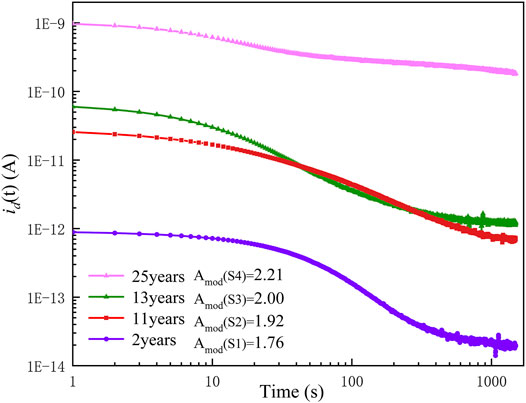
FIGURE 7. PDC curve and Amod of XLPE cables with different service life.
In Figure 7, the PDC curve characteristics of cables with different service lives basically conform to the results in 5.1. In the early stage of life, although the service times of S2 and S3 are the same, S3 has entered the early stage of aging. In addition, S4 is a retired cable. Referring to Table 5, decommission will occur with Amod = 2.21. The aforementioned results are consistent with reality. Meanwhile, considering that the Amod evaluation criteria are based on mechanical characteristics, Figure 8 shows the measured values and calculated values of EAB for cables. The small error range further proves that Amod is accurate and reliable to evaluate the aging degree of XLPE cables.
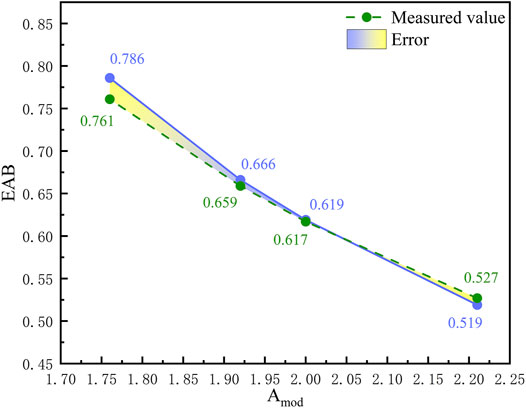
FIGURE 8. The distribution of evaluation reference error.
Whereas there is a significant temperature gradient in the internal temperature field of XLPE cable, which leads to the current theory misestimating the actual situation of cable frequently. As a result, when the extended Debye model and the traditional aging factor A are used to analyze the cable aging degree, the accuracy will not be guaranteed. The previous study indicated that the modified Debye model is more suitable for analyzing non-uniform thermal aging. Consequently, the PDC curve and modified Debye model are analyzed first, and Amod and related evaluation criteria are later reported. The present analysis has led to the following conclusions:
1) The insulation performance of uniform and non-uniform thermal aged cables is different at the same aging time. Studies using uniformly aged cable samples may not accurately assess cable aging.
2) Compared with the extended Debye model, the modified Debye model is more suitable for analyzing the PDC current of the non-uniform thermal aging cable, and there are significant differences between the parameters of the two models.
3) The evaluation method based on aging factor A always overestimates the performance of cable insulation to a certain extent. Comparatively, Amod is more consistent with the actual situation of insulation.
4) Thermal aging has an impact on EAB and Amod, and there is a corresponding relationship between them. Based on this, the proposed Amod evaluation standard accurately evaluates the aging degree of XLPE cables, which has been proved effective by experiments.
The original contributions presented in the study are included in the article/Supplementary Material, further inquiries can be directed to the corresponding author.
YZ, GG, and JZ: conceptualization. JL and FJ: methodology. YF: validation. YZ and GG: modeling and visualization. GG, YZ, and YF: writing.
This work was supported in part by the National Natural Science Foundation of China (Grant 51867003), in part by the Natural Science Foundation of Guangxi (Grant 2018JJB160064 and 2018JJA160176), in part by the Guangxi Bagui Young Scholars Special Funding, in part by the Boshike Award Scheme for Young Innovative Talents, in part by the Guangxi Key Laboratory of Power System Optimization and Energy Technology Project (Grant AE3020001829), in part by the Guangxi Science and Technology Base and Talent Special Project (Grant 2019AC20096), and in part by the Basic Ability Improvement Project for Young and middle-aged teachers in Universities of Guangxi (Grant 20190067 and Grant 20190046).
Author FJ is employed by Jiangmen Power Supply Bureau, Guangdong Power Grid Company Ltd.
The remaining authors declare that the research was conducted in the absence of any commercial or financial relationships that could be construed as a potential conflict of interest.
All claims expressed in this article are solely those of the authors and do not necessarily represent those of their affiliated organizations, or those of the publisher, the editors, and the reviewers. Any product that may be evaluated in this article, or claim that may be made by its manufacturer, is not guaranteed or endorsed by the publisher.
The authors acknowledge the National Natural Science Foundation of China (71704015), the Natural Science Foundation of Guangxi (2015GXNSFBA139235), the Foundation of Guangxi Science and Technology Department (AE020069), the Foundation of Guangxi Education Department (T3020097903), and the National Key Research and Development Program of China (2016YFB0900101) in support of this work.
Aras, F., Alekperov, V., Can, N., and Kirkici, H. (2007). Aging of 154 kV Underground Power cable Insulation under Combined thermal and Electrical Stresses. IEEE Electr. Insul. Mag. 23 (5), 25–33. doi:10.1109/mei.2007.4318272
Baral, A., and Chakravorti, S. (2013). Assessment of Non-uniform Aging of Solid Dielectric Using System Poles of a Modified Debye Model for Oil-Paper Insulation of Transformers. IEEE Trans. Dielect. Electr. Insul. 20 (5), 1922–1933. doi:10.1109/tdei.2013.6633726
Barber, K. (2000). “Power Cables in Energy Development in the 21st Century,” in 2000 IEEE Power Engineering Society Winter Meeting, Singapore, January 23–27, 2000 (Singapore: Conference Proceedings (Cat. No.00CH37077)), 564561–564568.
Beigert, M., and Kranz, H.-G. (1994). “Destruction Free Ageing Diagnosis of Power cable Insulation Using the Isothermal Relaxation Current Analysis,” in : Proceedings of 1994 IEEE International Symposium on Electrical Insulation: IEEE), Pittsburgh, PA, June 5–8, 1994, 17–21.
Birkner, P. (2004). Field Experience with a Condition-Based Maintenance Program of 20-kV XLPE Distribution System Using IRC-Analysis. IEEE Trans. Power Deliv. 19 (1), 3–8. doi:10.1109/tpwrd.2003.820421
David, E., Parpal, J.-L., and Crine, J.-P. (1996). “Aging of XLPE cable Insulation under Combined Electrical and Mechanical Stresses,” in Conference Record of the 1996 IEEE International Symposium on Electrical Insulation, Montreal, QC, June 16–19, 1996 (IEEE), 716–719.
Gao, X., Xu, Q., Zhang, Y., Li, H., Zhang, S., Zhu, Y., et al. (2015). Study on Correspondence between Isothermal Relaxation Current Aging Factor and Life Index of XLPE Cable. Electric Appl. 34 (S1), 484–487.
Kumar, A., and Mahajan, S. M. (2010). “Correlation between Time and Frequency Domain Measurements for the Insulation Diagnosis of Current Transformers,” in North American Power Symposium, 1–5. doi:10.1109/naps.2010.5618956
Li, Y., Liang, Y., Li, Y., Si, W., Yuan, P., and Li, J. (2009). “Coupled Electromagnetic-Thermal Modeling the Temperature Distribution of XLPE Cable,” in 2009 Asia-Pacific Power and Energy Engineering Conference, Wuhan, March 27–31, 2009, 1–4. doi:10.1109/appeec.2009.4918246
Lyle, R. (1988). Effect of Testing Parameters on the Outcome of the Accelerated cable Life Test. IEEE Trans. Power Deliv. 3 (2), 434–439. doi:10.1109/61.4277
Morsalin, S., and Phung, B. T. (2020). Dielectric Response Study of Service-Aged XLPE cable Based on Polarisation and Depolarisation Current Method. IEEE Trans. Dielect. Electr. Insul. 27 (1), 58–66. doi:10.1109/tdei.2019.008306
Morsalin, S., Sahoo, A., and Phung, B. T. (2019). Recovery Voltage Response of XLPE Cables Based on Polarisation and Depolarisation Current Measurements. IET Gener. Transm. Distrib. 13 (24), 5533–5540. doi:10.1049/iet-gtd.2019.1004
Oyegoke, B. S. (2016). Improved Condition Assessment of XLPE Insulated Cables Using the Isothermal Relaxation Current Technique,” in IEEE Conference on Electrical Insulation and Dielectric Phenomena), Kansas City, MO, October 15–18, 2006, 477–480.
Roservear, R. D. (2000). Power Cables in 21st century Energy Development. IEEE Power Eng. Rev. 20 (9), 8–10. doi:10.1109/39.866859
Saha, T. K., Purkait, P., and Muller, F. (2005). Deriving an Equivalent Circuit of Transformers Insulation for Understanding the Dielectric Response Measurements. IEEE Trans. Power Deliv. 20 (1), 149–157. doi:10.1109/TPWRD.2004.835436
Simmons, J. G., and Tam, M. C. (1973). Theory of Isothermal Currents and the Direct Determination of Trap Parameters in Semiconductors and Insulators Containing Arbitrary Trap Distributions. Phys. Rev. B 7 (8), 3706–3713. doi:10.1103/physrevb.7.3706
Talib, M. A., Muhamad, N. A., Malek, Z. A., and Jamail, N. A. M. (2013). “Application of PDC Analysis to Identify Effect of Overheating on Dielectric Response and Conductivity of mineral Insulating Oil of In-Services Transformers,” in 2013 Annual Report Conference on Electrical Insulation and Dielectric Phenomena, Chenzhen, October 20–23, 2013, 583–586. doi:10.1109/ceidp.2013.6748298
Watson, P. K. (1995). The Transport and Trapping of Electrons in Polymers. IEEE Trans. Dielect. Electr. Insul. 2 (5), 915–924. doi:10.1109/94.469986
Watson, P. K. (1988). “The Trapping of Electrons in Polystyrene,” in 6th International Symposium on Electrets,(ISE 6) Proceedings, June 1989, 52–56.
White, C. C., Wagenblast, J., and Shaw, M. T. (2000). Separation, Size Reduction, and Processing of XLPE from Electrical Transmission and Distribution cable. Polym. Eng. Sci. 40 (4), 863–879. doi:10.1002/pen.11215
Xiaofeng, Y., Zhenjie, S., and Zixuan, C. (2016). “Study on the Time Domain Dielectric Properties of Oil-Impregnated Paper with Non-uniform Aging Based on the Modified Debye Model,” in 2016 IEEE International Conference on High Voltage Engineering and Application, Chengdu, September 19–22, 2016 (Chengdu: ICHVE), 1–4. doi:10.1109/ichve.2016.7800922
Ye, G., Li, H., Lin, F., Tong, J., Wu, X., and Huang, Z. (2016). Condition Assessment of XLPE Insulated Cables Based on Polarization/Depolarization Current Method. IEEE Trans. Dielect. Electr. Insul. 23 (2), 721–729. doi:10.1109/tdei.2015.004782
Zhao, X., Han, J., Sun, H., Duan, W., Chen, X., and Deng, J. (2019). “Time-domain Dielectric Response Characteristics of XLPE cable Insulation under Different Water Conten,” in 2019 IEEE Conference on Electrical Insulation and Dielectric Phenomena, Virginia Beach, VA, October 18–21, 2009 (Virginia Beach, VA: CEIDP), 682–685. doi:10.1109/ceidp47102.2019.9009942
Zhenquan, S., Xuefeng, Z., Jisheng, L., and Yanming, L. (2009). “Withstand Voltage Testing in Combination with PD Measurements of XLPE Cables under Damped Alternating Voltage On-Site,” in 2009 IEEE Conference on Electrical Insulation and Dielectric Phenomena, Virginia Beach, VA, October 18–21, 2009, 43–46. doi:10.1109/ceidp.2009.5377901
Keywords: XLPE cable, modified Debye model, non-uniform thermal aging, polarization/depolarization curve (PDC), modified aging factor
Citation: Zhang Y, Gu G, Liu J, Jiang F, Fan Y and Zha J (2022) Evaluation of Non-Uniform Thermal Aging of XLPE Cable Based on Modified Debye Model. Front. Mater. 9:838792. doi: 10.3389/fmats.2022.838792
Received: 18 December 2021; Accepted: 08 March 2022;
Published: 26 April 2022.
Edited by:
Mazeyar Parvinzadeh Gashti, PRE Labs Inc., CanadaReviewed by:
Larbi Boukezzi, Ziane Achour University of Djelfa, AlgeriaCopyright © 2022 Zhang, Gu, Liu, Jiang, Fan and Zha. This is an open-access article distributed under the terms of the Creative Commons Attribution License (CC BY). The use, distribution or reproduction in other forums is permitted, provided the original author(s) and the copyright owner(s) are credited and that the original publication in this journal is cited, in accordance with accepted academic practice. No use, distribution or reproduction is permitted which does not comply with these terms.
*Correspondence: Junwei Zha, emhhandAdXN0Yi5lZHUuY24=
Disclaimer: All claims expressed in this article are solely those of the authors and do not necessarily represent those of their affiliated organizations, or those of the publisher, the editors and the reviewers. Any product that may be evaluated in this article or claim that may be made by its manufacturer is not guaranteed or endorsed by the publisher.
Research integrity at Frontiers
Learn more about the work of our research integrity team to safeguard the quality of each article we publish.