 HsinYen Lee
 Simon Gray
 Yifan Zhao
 Gustavo M. Castelluccio
- School of Aerospace, Transport, and Manufacturing, Cranfield University, Cranfield, United Kingdom
The reliability of turbine engines depends significantly on the environment experienced during flight. Air humidity, corrosive contaminant substances, and high operating temperatures are among the attributes that affect engine lifespans. The specifics of the environment that affect materials are not always known, and damage is often evaluated by time-consuming manual inspection. This study innovates by demonstrating that machine learning approaches can identify the environmental conditions that degrade jet engine metallic materials. We used the state-of-the-art pre-trained neural network models to assess images of damaged nickel-based superalloy samples to identify the environment temperature, the exposure time, and the deposited amounts of salt contaminants. These parameters are predicted by training the model with a database of approximately 3,600 sample images tested in laboratory conditions. A novel tree classification process results in excellent predictive power for classifying the type of environment experienced by nickel-based superalloys.
Introduction
Commercial flight routes often experience recurrent engine failures due to the adverse environmental conditions that aircrafts are repeatedly exposed. In reality, the specifics of the environment experienced by engines are not fully known, and the environmental impacts on jet engine turbine blades are still a matter of research (Darolia, 2019). To ascertain the response of blade materials to inflight conditions, researchers have recreated representative environments in laboratories in which metallic materials are sprayed with a thin layer of salt contaminants and exposed to high temperatures (Eliaz et al., 2002; Rapp, 2002; Syed et al., 2021). Samples are afterward inspected with microscopes and weighted to assess the superalloy resistance to corrosion damage. This time-intensive approach requires expert evaluation to assess the degree of damage induced by each specific environment.
Machine learning approaches have been demonstrated to have an excellent predictive power in recognizing patterns in data (Paolanti and Frontoni, 2020). Among a wide range of algorithms, convoluted neural networks (CNNs), support vector machine (SVM), and random forest (RF) are popular approaches used to identify underlying associations in images (AgajanianOluyemiVerkhivker, 2019; Ahmed, 2020). These techniques are increasingly being introduced in material science to identify concealed property relationships (Bulgarevich et al., 2018; Himanen et al., 2019; Xia et al., 2020). For instance, researchers have linked corrosion degradation to surface images, which reduces the need for human inspection (Shen et al., 2013; Atha and Jahanshahi, 2018; Brandolide Geus et al., 2021; Qu et al., 2021). Furthermore, these approaches can help discover novel damaging attributes associated with environments (Raccuglia et al., 2016; Thankachan and Kavimani, 2020). Since the quality of the predictions relies on the size of the training data sets, one of the major difficulties relies on obtaining enough information. This challenge is particularly acute for damage prognosis since we often seek to characterize the extreme rather than the mean of distribution (Nash, 2018).
Several research efforts have implemented machine learning approaches for quantifying the damage progression rather than qualifying the environmental attributes that lead to such damage (Khayatazad et al., 2020; Naik et al., 2020). Leveraging prior experimental efforts and an ample image database, this work applies machine learning approaches to identify the environmental conditions experienced by degraded samples. We consider the state-of-the-art of pre-trained feature extractor model along with image classifiers implemented in the Orange 3 platform. We also devised a data augmentation strategy and a classification strategy that stratifies predictions and enriches the prediction of predictive power. The results demonstrated that a machine learning tree strategy is an efficient and powerful tool for the identification of environmental damage on turbine blades and the classification of the environmental conditions to which nickel-based superalloy samples are exposed.
Data Augmentation
As part of our regular material characterization programs, an experimental dataset was created by exposing Ni-based superalloy cylindrical samples, as schematically shown in Figure 1. These samples are exposed to 700°C or 900°C under flowing air +300 ppm SO2, during 80, 120, 160, 320, or 520 h after spraying different salt flux concentrations (1.5, 5 or 10
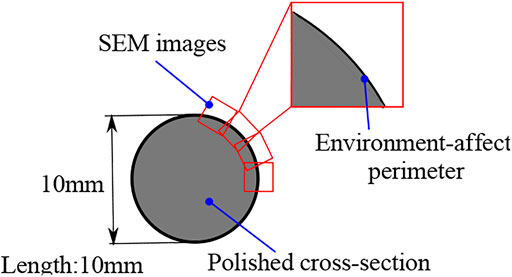
FIGURE 1. Schematic description of the experimental setup and the layout of the SEM images.
The details of the materials are proprietary, but they are not required in this work since the methodology presented is not specific to the performance of the material. After testing, all samples were mounted in resin and then sectioned across the centerline of the specimen and polished back to a mirror finish using oil-based lubrication to avoid the dissolution of any salt residue. A bespoke digital microscope system that captures optical images at predefined intervals around the circumference of the specimen was used; in this case, 30 images were captured, i.e., every 12° around the circumference, examples of which are shown in Figure 2. The entire dataset corresponds to a total of 3,600 images that were converted to a portable network graphics (PNG) lossless format. It is noted that this dataset is significantly larger than those typically reported in the literature, particularly for nickel-based superalloy assessments (Senanayake and Carter, 2020).
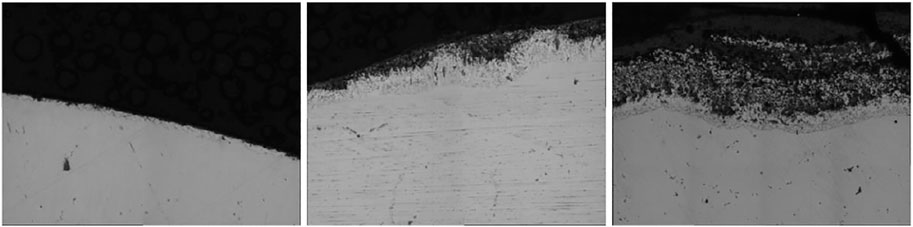
FIGURE 2. Examples of images obtained with the SEM for material B after being exposed to corrosive environments at 900°C with a medium salt flux coating for 80, 160, and 520 h, respectively.
The process of cropping images with a specified region is an effective approach for exploring a region of interest (ROI) and increasing the machine learning accuracy (Mishra et al., 2020). The ROI of an image varies depending on the content of the images and the classification target. In our case, since the degradation of the environment occurs primarily on the specimen surface, we defined the ROI as the perimeter of the sample. Hence, each image was cropped along the perimeter (Figure 3) to augment the data and focus the model on the environmental interactions. The augmentation procedure was automatized by cropping a rectangular box centered at the middle point of the perimeter, which was located on the original images (Figure 3), with a MATLAB algorithm. The box was extracted using the standard imcrop command to trim images into four pieces, according to the ROI that has been selected. These images were labeled and saved automatically.

FIGURE 3. Example of the steps implemented in data pre-processing and augmentation.
Machine Learning Model
Our baseline model presented in Figure 4 was implemented in the Orange 3 platform (DemšarCurkErjavecGorupHočevaret al., 2013). The model consists of four main parts corresponding to the colored widgets: yellow—image analysis, orange—data classification, pink—model adjustment, and blue—model evaluation; all calculations were performed on an Intel Core i5 Mobile.
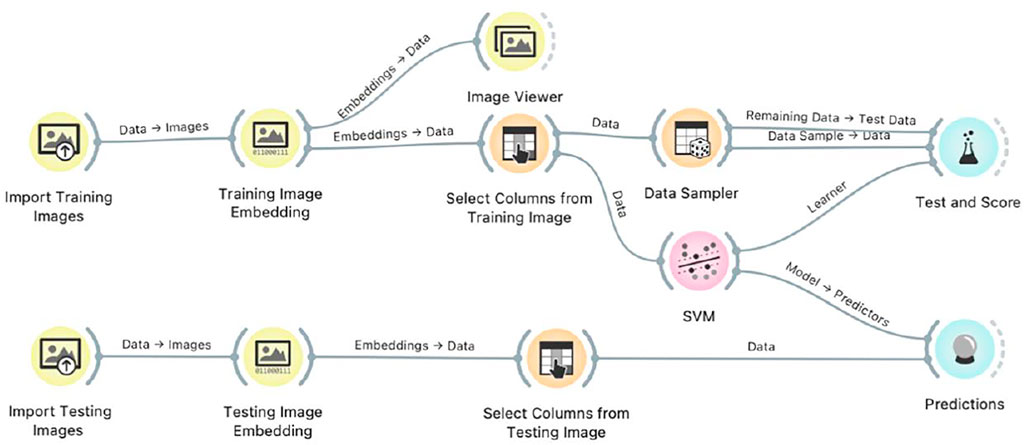
FIGURE 4. Baseline model training implementation in Orange 3
After comparing different combinations of data extractors and classifiers available in Orange 3, we present the results for three methods VGG16, VGG19, and inception v3. The visual geometry group (VGG) (Simonyan, 2015) is a CNN approach with 16 or 19 layers deep while the inception v3 extraction model (Szegedy and Wojna, 2016) corresponds to a pre-trained convolutional neural network. All approaches are pre-trained on a dataset containing 1,000 different classes from the original ImageNet dataset with one million classes of images. Inception v3 employs different-sized convolution kernels, which allows the existence of different-sized perceptual fields and ultimately the stitching to achieve the fusion of features at different scales. The approach differs from other pre-trained CNNs in that
• It applies a 1 × 7 convolution and a 7 × 1 convolution instead of a 7 × 7 convolution, which results in using only about (1 × 7 + 7 × 1)/(7 × 7) = 28.6% of the computational power.
• It applies a 1 × 3 convolution and a 3 × 1 convolution instead of a 3 × 3 convolution, which results in using only about (1 × 3 + 3 × 1)/(3 × 3) = 67% of the computational power.
This strategy accelerates the computational calculations, increases the non-linearity of the network, and reduces overfitting ().
We also consider two classifiers, RF and the SVM. RF implements (Breiman, 2001) a set of decision trees, each of which is selected from a bootstrap sample. Each tree is constructed by selecting the best attributes from a random subset. The final model relies on sampling the results from individual trees in the forest. The SVM defines hyperplanes that enable data to be separated into two categories in space, hence the name “binary classifier” (Chang, 2011). The approach maximizes the separation of different classes of data by computing a hyperplane, which is an effective strategy for solving non-linear and high-dimensional image classification problems (Chang, 2011). By choosing different kernel functions, the SVM can be adapted to various classification problems. If the classification problem to be solved is only of two types, then the activation of the SVM is set to “linear,” and the loss is set to “hinge”. If the SVM is to solve a multivariate classification problem, the activation is set to “SoftMax,” and the loss is set to “square hinge” (Reddy, 2021). Furthermore, the SVM model depends on the cost and gamma parameters, which determine the accuracy and generalization of the model. Our baseline model uses a cost equal to 1 and the option for automatic selection of gamma. Compared to fully connected layers in the CNN, the SVM is based on the principle of structural risk minimization, which avoids the overlearning problem and has a high generalization capability (Li and Liu, 2019).
Training
The augmented images were classified in Orange 3 and imported into the models. The datasets were allocated using the holdout method in Orange 3, which divides the datasets into training and validation sets accordingly. A total of 70% of the images were used in the formulation phase of model training, to train the hypothesis function (i.e., to determine the general parameters). The 30% validation set is used to evaluate the final generalization capability of the model. The relative fraction for training and validating was chosen after performing a comparison using a ResNet50 neural network model (Oluwafemi et al., 2021). In this case, we evaluated the number of images required to maximize the temperature predictive power for Material A. The outcomes presented in Table 1 demonstrate that 15 to 20 images (50–33%) are sufficient to fully train the models.
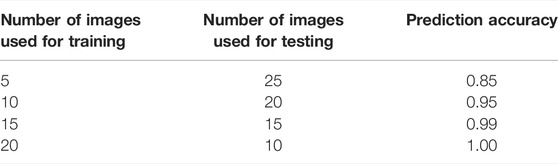
TABLE 1. ResNet50 model accuracy using different numbers of images for training and evaluating the exposure temperature for material A only.
Results
A. Performance for Environment Identification
Our first analysis explores the predictive power of machine learning approaches to distinguish material A samples tested at 900°C, exposure for 160 h, and three salt flux levels. As shown in Figure 5, the images from these samples are hardly distinguishable by simple inspection, and even an experienced expert would find difficulty in their classification. Previous efforts (Oluwafemi et al., 2021) with ResNet50 neural network analysis with these images resulted in an accuracy of 0.72 and required 20 min training in our system. Table 2 presents the results for various Orange 3 models with default settings, and it demonstrates that inception v3 with the SVM reaches better accuracy on a shorter running time. We further performed a cross-validation analysis in which each dataset was divided into 10 subsets. For each iteration of the 10-fold cross-validation, different subsets are used for training and testing. In the first iteration, the first subset is used for testing, and the remaining subsets are used for training. The second iteration uses the second subset for testing and so on. To obtain the final result, an average of 10 classification accuracies is computed, and each accuracy comes from a single iteration of 10-fold cross-validation. Similarly, we computed the precision, sensitivity, and specificity. Overall, our baseline model outperforms all other implementations both on the quality of the results and the training time. Furthermore, Appendix A presents the confusion matrices for the flux predictions. It is noted that all models use the default attributes and without any parameter optimization.
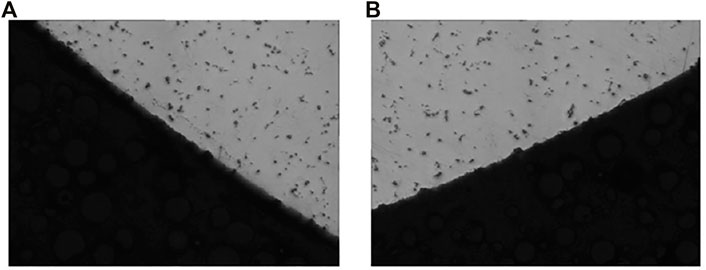
FIGURE 5. Comparison of two samples for material A exposed at 900°C for 160 h with low (A) and medium (B) salt contaminants. The models are initially applied to these cases, given the evident difficulty in distinguishing the imagers.
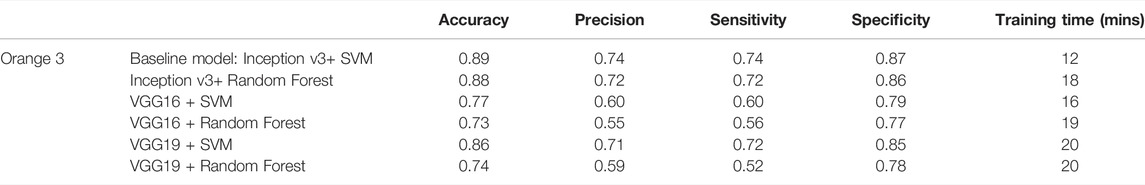
TABLE 2. Comparison of the accuracy and training time of various models in predicting the contaminant salt flux level for material A samples exposed to 900°C during 160 h. Precision, sensitivity, and specificity were computed from cross-validation with the default implementation of various models in Orange 3.
Next, we consider all temperatures, exposure time, and fluxes for material Bc, for which the dataset was divided into 70% training and 30% testing. Prior work with ResNet50 by Oluwatobi et al. (Oluwafemi et al., 2021) yielded an accuracy of about 80%, as shown in Table 3. The results on this table demonstrate that the SVM with the default automatic selection of parameters yields an accuracy almost identical to that from ResNet50 but requires half the training time. Since Orange 3 does not provide an optimization application, the accuracy of the baseline model parameters was evaluated for a combination of the cost parameter between 1 and 20 and the gamma parameter between 0 and 2. Upon optimizing the SVM parameters, an impressive accuracy above 95% is achieved without affecting the training time.
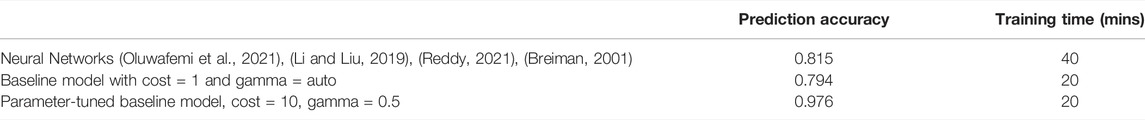
TABLE 3. Model accuracy and training time for the simultaneous prediction of the contaminant salt flux, temperature, and exposure time applied to material Bc.
Next, we considered the baseline model with tuned parameters (cost = 10, gamma = 0.5.) and used all four materials and 30 environmental conditions each. The accuracy results on Table 4 demonstrate that compared to the accuracy obtained with neural networks, our baseline model shows significant improvements in accuracy and a dramatic reduction in the running time by a factor of 20.
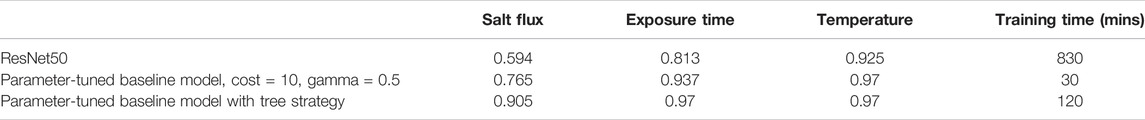
TABLE 4. Comparison of the independent prediction accuracy and training time for salt flux, exposure time, and temperature for all materials combined using various models.
We further re-assessed the results by implementing a new strategy that uses the SVM in sequence. The accuracies for predicting exposure time and temperature are both very high. However, the exposure time comprises five categories, which renders the number of images in the next flux or temperature training subset as too small and reduces the overall predictive power. Therefore, we introduced the tree strategy shown in Figure 6, in which the model is first trained to identify the temperature (either 700°C or 900°C). We implemented the same approach to identify the exposure time but using an algorithm trained with images from samples exposed at the corresponding temperature. Similarly, we concluded the analysis by identifying the flux with an algorithm trained with images from the temperature and exposure predicted earlier. The tree strategy in Figure 6 allows for sufficient subsets of images to be trained, which dramatically improves the predictive power, as shown in Table 4. Here, the tree strategy performs better than the baseline model at the expense of increasing a factor of three times the running time. Nevertheless, the tree strategy is seven times faster than the prior CNN approach.
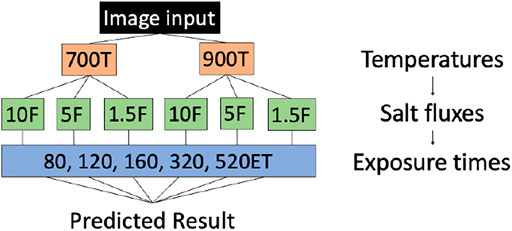
FIGURE 6. Tree strategy architecture. The next attribute (e.g., salt flux) is predicted using a model trained with a subset of images exclusively corresponding to the prior attribute predicted (Images tested at the temperature predicted).
B. Material Type Generalization and Other Indicators
We further consider the ability of the models to predict the environment while being trained with materials other than those used for testing. Hence, we trained the model using the images from materials A and Bc, and we validated the models with images from material B. The results on Table 5 demonstrate the accuracy in predicting temperature and exposure time of 85 and 50%, respectively, and the accuracy drops below 40% for predicting the salt flux. Hence, the identification of temperature is less sensitive to the material type while the interaction of the salt flux and exposure time with the material seems strongly dependent on the composition. These results suggest that some attributes can be predicted with a general database (i.e., temperature), while others may require a database compatible with the material of interest. In any case, we demonstrated that some predictive power is inherited from testing other materials, which has helped reduce the costs of developing robust experimental databases.
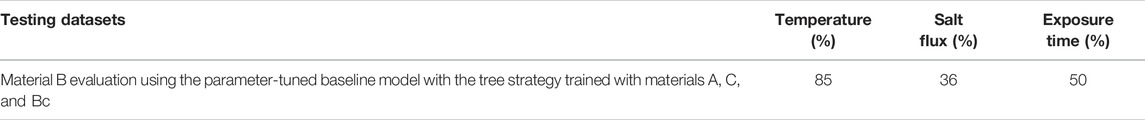
TABLE 5. The accuracy of predicting unknown and known dataset temperatures, salt fluxes, and exposure times.
Finally, we also considered the sample mass change quantified on experiments, which is used as a simple guide in monitoring environmental condition experiments. Therefore, we attempted to identify the mass change of superalloys after corrosion by classifying sample images into four quartiles of mass change. The results yielded an accuracy above 80% in predicting the quartiles for the mass change.
Discussion and Conclusion
This work evaluated the potential of various machine learning approaches to classify images from corroding metallic materials in order to classify the environment to which samples were exposed. We considered different nickel-based superalloys used on jet engines, which were exposed to detrimental environments at two temperatures, five exposure time periods, and sprayed with three amounts of contaminant salts. These test conditions are typical for laboratory evaluation of materials and are thought to be representative of in-service damage.
Different machine learning approaches were evaluated along with an image augmentation strategy and a novel tree prediction approach. The results demonstrated a high accuracy of machine learning approaches in classifying an unknown damaging environment. We further demonstrated that an inception v3 pre-trained CNN + SVM classifier model was the most reliable when different attributes from the environment were subsequently predicted in decreasing the order of accuracy. This expected accuracy can be computed considering all the attributes together. In addition, we showed that some attributes can be predicted accurately even when the models are trained with images from other types of alloys. As a result, we demonstrated that machine learning approaches can be flexible and instrumental in detecting anomalous environmental conditions experienced by aircraft regular services.
This work represents an initial milestone in using machine learning to identify realistic in-service environments that affect materials’ life cycle. This approach requires extensive experimental characterization and a mechanistic understanding of damage processes that justify the testing conditions. Nevertheless, the value of the approach justifies further work that aims to classify jet engine components taken from service with our trained model. The results serve to validate laboratory testing conditions and further correlate with the degree of damage and component remaining life. Furthermore, this approach leverages on the analysis of component images to link the environment with failure mechanisms.
Data Availability Statement
The datasets presented in this article are not readily available because the data is of commercial nature and is restricted. Requests to access the datasets should be directed to castellg@cranfield.ac.uk.
Author Contributions
HL: model implementation. SG: envision of experimental work and database compilation. YZ: envision of machine learning implementation. GC: conception of the research.
Conflict of Interest
The authors declare that the research was conducted in the absence of any commercial or financial relationships that could be construed as a potential conflict of interest.
Publisher’s Note
All claims expressed in this article are solely those of the authors and do not necessarily represent those of their affiliated organizations, or those of the publisher, the editors, and the reviewers. Any product that may be evaluated in this article, or claim that may be made by its manufacturer, is not guaranteed or endorsed by the publisher.
Supplementary Material
The Supplementary Material for this article can be found online at: https://www.frontiersin.org/articles/10.3389/fmats.2022.830260/full#supplementary-material
References
Darolia, R. (2019). Development of strong, Oxidation and Corrosion Resistant Nickel-Based Superalloys: Critical Review of Challenges, Progress and Prospects. Int. Mater. Rev. 64, 355–380. doi:10.1080/09506608.2018.1516713
Eliaz, N., Shemesh, G., and Latanision, R. M. (2002). Hot Corrosion in Gas Turbine Components. Eng. Fail. Anal. 9, 31–43. doi:10.1016/s1350-6307(00)00035-2
Rapp, R. A. (2002). Hot Corrosion of Materials: a Fluxing Mechanism. Corrosion Sci. 44, 209–221. doi:10.1016/s0010-938x(01)00057-9
Syed, A. U., Martinez, F. D. Morar., Roberts, T., Encinas-Oropesa, A., Morar, N. I., Grohne, M., et al. (2021). Performance Comparison between Isothermal Hot Corrosion and In Situ Cyclic Hot Corrosion of Nickel-Based Superalloys. Oxid Met. 96, 43–55. doi:10.1007/s11085-021-10044-9
Paolanti, M., and Frontoni, E. (2020). Multidisciplinary Pattern Recognition Applications: A Review. Comp. Sci. Rev. 37, 100276. doi:10.1016/j.cosrev.2020.100276
Agajanian, S., Oluyemi, S., and Verkhivker, S. (2019). Front. Mol. Biosciences 6. doi:10.3389/fmolb.2019.00044
Bulgarevich, D. S., Tsukamoto, S., Kasuya, T., Demura, M., and Watanabe, M. (2018). Pattern Recognition with Machine Learning on Optical Microscopy Images of Typical Metallurgical Microstructures. Sci. Rep. 8, 2078. doi:10.1038/s41598-018-20438-6
Himanen, L., Geurts, A., Foster, A. S., and Rinke, P. (2019). Data‐Driven Materials Science: Status, Challenges, and Perspectives. Adv. Sci. 6, 1900808. doi:10.1002/advs.201900808
Xia, D.-H., Song, S., Tao, L., Qin, Z., Wu, Z., Gao, Z., et al. (2020). Review-material Degradation Assessed by Digital Image Processing: Fundamentals, Progresses, and Challenges. J. Mater. Sci. Techn. 53, 146–162. doi:10.1016/j.jmst.2020.04.033
Shen, H.-K. Chang., Chen, P.-H., and Chang, L.-M. (2013). Automated Steel Bridge Coating Rust Defect Recognition Method Based on Color and Texture Feature. Automation in Construction 31, 338–356. doi:10.1016/j.autcon.2012.11.003
Atha, D. J., and Jahanshahi, M. R. (2018). Evaluation of Deep Learning Approaches Based on Convolutional Neural Networks for Corrosion Detection. Struct. Health Monit. 17, 1110–1128. doi:10.1177/1475921717737051
Brandolide Geus, B., Souza, J. R., Spadon, G., Soares, A., Rodrigues, J. F., Komorowski, J., et al. (2021). Aircraft Fuselage Corrosion Detection Using Artificial Intelligence. Sensors 21, 4026. doi:10.3390/s21124026
Qu, Z., Tang, D., Wang, Z., Li, X., Chen, H., Lv, Y., et al. (2021). Pitting Judgment Model Based on Machine Learning and Feature Optimization Methods. Front. Mater. 8, 348. doi:10.3389/fmats.2021.733813
Raccuglia, P., Elbert, K. C., Adler, P. D. F., Falk, C., Wenny, M. B., Mollo, A., et al. (2016). Machine-learning-assisted Materials Discovery Using Failed Experiments. Nature 533, 73–76. doi:10.1038/nature17439
Nash, W., Drummond, T., and Birbilis, N. (2018). Birbilis, Npj Mater. Degrad. 2, 1–12. doi:10.1038/s41529-018-0058-x
Naik, D. L., Sajid, H. U., Kiran, R., and Chen, G. (2020). Detection of Corrosion-Indicating Oxidation Product Colors in Steel Bridges under Varying Illuminations, Shadows, and Wetting Conditions. Metals 10, 1439. doi:10.3390/met10111439
Khayatazad, M., De Pue, L., and De Waele, W. (2020). Developments in the Built Environment, 3, 100022. doi:10.1016/j.dibe.2020.100022Detection of Corrosion on Steel Structures Using Automated Image ProcessingDev. Built Environ.
Senanayake, N. M., and Carter, J. L. W. (2020). Computer Vision Approaches for Segmentation of Nanoscale Precipitates in Nickel-Based Superalloy IN718. Integr. Mater. Manuf Innov. 9, 446–458. doi:10.1007/s40192-020-00195-z
Mishra, B. K. Mazumdar., Thakker, D., Mazumdar, S., Neagu, D., Gheorghe, M., and Simpson, S. (2020). A Novel Application of Deep Learning with Image Cropping: a Smart City Use Case for Flood Monitoring. J. Reliable Intell. Environ. 6, 51–61. doi:10.1007/s40860-020-00099-x
Demšar, J., Curk, T., Erjavec, A., Gorup, Č., Hočevar, T., Milutinovič, M., et al. (2013). Orange: Data Mining Toolbox in Python. J. Machine Learn. Res. 14, 2349–2353.
Li, Y., and Liu, L. (2019). Image Quality Classification Algorithm Based on InceptionV3 and SVM. MATEC Web Conf. 277, 02036. doi:10.1051/matecconf/201927702036
Oluwafemi, O., Ganti, P., Babu, V., Wang, S., Yang, L., Gray, S., et al. (2021). Machine Learning Approaches to Identify Environmental Damage on Superalloys. Proceedings of the 10th Through-Life Engineering Services Conference. (Netherlands: Enschede).
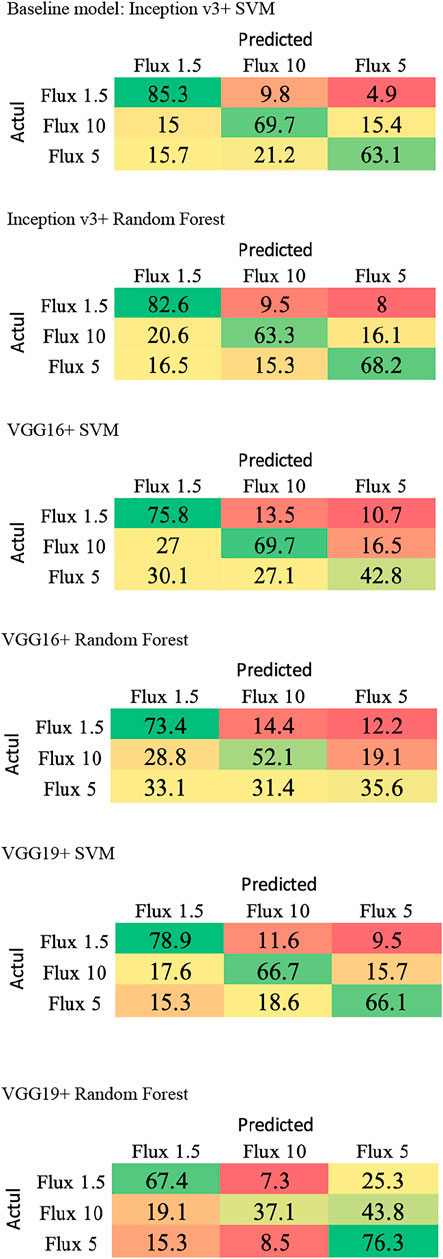
Appendix AConfusion Matrix from various analyses
Confusion matrices correspond to tables that visualize the accuracy of learning algorithms. In this case, the matrix columns symbolize the contaminant fluxes predicted whereas rows represent the actual fluxes.
Keywords: machine learning, corrosion damage, nickel-based superalloys, high temperature, contaminant salt
Citation: Lee H, Gray S, Zhao Y and Castelluccio GM (2022) Machine Learning Applied to Identify Corrosive Environmental Conditions. Front. Mater. 9:830260. doi: 10.3389/fmats.2022.830260
Received: 06 December 2021; Accepted: 31 January 2022;
Published: 04 April 2022.
Edited by:
Changdong Gu, Zhejiang University, ChinaCopyright © 2022 Lee, Gray, Zhao and Castelluccio. This is an open-access article distributed under the terms of the Creative Commons Attribution License (CC BY). The use, distribution or reproduction in other forums is permitted, provided the original author(s) and the copyright owner(s) are credited and that the original publication in this journal is cited, in accordance with accepted academic practice. No use, distribution or reproduction is permitted which does not comply with these terms.
*Correspondence: Gustavo M. Castelluccio, Y2FzdGVsbGdAY3JhbmZpZWxkLmFjLnVr