 Mingzhang Lan1*
 Jian Zhou
 Hui Li
94% of researchers rate our articles as excellent or good
Learn more about the work of our research integrity team to safeguard the quality of each article we publish.
Find out more
ORIGINAL RESEARCH article
Front. Mater. , 03 February 2022
Sec. Structural Materials
Volume 9 - 2022 | https://doi.org/10.3389/fmats.2022.829743
This article is part of the Research Topic Advanced Concretes and Their Structural Applications View all 23 articles
One of the key parameters for the performance of concrete repairs is the quality of the interface between the repair material and concrete substrate, which is determined by cement hydration and microstructure development. The moisture exchange between the repair material and concrete substrate plays an important role in the cement hydration and porosity of cementitious repair materials. To better understand the influence of moisture exchange on the hydration of cementitious repair materials, this paper presents a numerical simulation of cement hydration and microstructure development of repair materials, considering moisture exchange. The simulation results reveal that the moisture exchange between the repair material and concrete substrate results in a water content change in two parts. Before the repair material setting, the water absorption of an unsaturated concrete substrate causes a reduction in the w/c ratio in the repair material, decreasing the hydration rate of the repair material. After the repair material setting, the water migrates from the concrete substrate to the repair material to provide additional water to accelerate the hydration of unhydrated cement in the repair material.
Concrete is the most popular structural material in the world today due to its excellent resistance to water, low cost and so on (Mehta and Monteiro, 2014; Xie et al., 2018). However, concrete structures are vulnerable to deterioration resulting from mechanical and environmental effects (Hobbs, 2001; Yin et al., 2020). Most of these concrete structures need repair after their deterioration. The bond between the concrete substrate and repair material usually shows a weak link in the repaired concrete structure (Momayez et al., 2005; Wang et al., 2021). Therefore, for good concrete repair work, sufficient bond strength between the concrete substrate and repair material is required to withstand the stresses in the interface (Emmons and Vaysburd, 1994; Gadri and Guettala, 2017; Garbacz et al., 2017; Abo Sabah et al., 2019; Gomaa et al., 2020). For cementitious repair materials, cement hydration and microstructure evolution play an important role in the bonding properties of the interface between the repair materials and concrete substrate (Courard, 2000; Shi et al., 2021). Courard and Degeimbre (2003), Courard (2005) and Lukovic and Ye (2016) suggested that cement hydration and microstructure development in concrete repairs is influenced by the moisture exchange between the repair material and concrete substrate. Xue et al. (2021) suggested that water exchange typically occurs in the first 8 h after casting repair mortar. In the first 4 h of hydration, the free water transfers from the repair mortar to the old mortar. With the development of hydration (in 4–8 h), capillary pores are produced in the repair mortar, and the capillary pores absorb water from the old mortar. In addition, Zhou et al. (2016) studied the hydration process and microstructure development in concrete repairs. They proposed that after placing repair materials on the concrete substrate, moisture exchange between these two materials takes place. Moisture exchange changes the water content in the repair material and affects cement hydration and the microstructure at the interface. Therefore, it must affect the hydration process of the repair material.
This paper aims to develop a numerical model to understand better the influence of moisture exchange on the cement hydration process and microstructure development of cementitious repair materials. The HYMOSTRUC model is used to simulate the hydration process and to evaluate the pore structure characteristics in the repair materials. A model based on Darcy’s law simulates the water exchange between the repair material and concrete structure in the developed numerical model. The proposed model is then used to simulate the hydration process and porosity development of repair mortar. The simulation results are compared with experimental results to verify the model and study the influence of water exchange on the microstructure development of repair materials during hydration.
Cement hydration in cementitious repair material consumes water, while moisture exchange causes water redistribution in the repair material. These two processes may lead to a change in water content. The change in water content can, therefore, be calculated by summing those caused by cement hydration and moisture exchange:
where ∂θ/∂t is the change rate of the water content and ∂θhy/∂t; and ∂θmx/∂t are the water change rates due to cement hydration and moisture exchange, respectively.
The hydration process of cement mainly depends on the water content (water-cement ratio) in the fresh mixture. When some water moves out from the fresh cement paste, the water left in the paste and the water-cement ratio decrease, decreasing the hydration rate (i.e., leading to a lower hydration degree). Conversely, if some water moves into the hydrating cement paste, the inflow water increases the water content (water-cement ratio), increasing the hydration rate. Therefore, the moisture exchange between the repair mortar and concrete substrate needs to be considered for hydration simulation. Cement hydration influenced by moisture exchange is described in Section 2.1.
As cement hydration proceeds, water is gradually consumed, and hydration products grow into the pore structures. Cement hydration, therefore, has two effects on moisture transport. Firstly, the water consumption due to continuous hydration leads to a decrease in the water content in repair material. Secondly, since the hydration products occupy more space than the cement particles that have hydrated, the formation of hydration products decreases the porosity in the matrix and changes the size of the pores. The water content decrease and pore structure evolution affect capillary pressure, and unsaturated permeability is discussed in Sections 2.2, 2.3.
The HYMOSTRUC model was established by van Breugel (1991) to simulate the hydration process of cement and evaluate the microstructure in hardened cement-based materials. This model was further developed by Koenders (1997) and Ye (2003). Subsequent studies have confirmed that HYMOSTRUC has advantages in simulating cement hydration (Ye et al., 2003; Zhao et al., 2019).
In the HYMOSTRUC model, the cement particles are treated as a series of spheres with different diameters. For a given water-cement ratio, the number of cement particles with determined diameters is constant, and the particles are randomly distributed in the model space. As shown in Figure 1, the hydration of cement is simulated as the growth of the cement particles, consisting of a growing shell of hydration products and a shrinking unhydrated cement core. As the shell of hydration products grows outwardly, the smaller cement particles, located in the vicinity of the larger cement particles, become embedded in the outer shell of the larger cement particles. The stable structure has formed as the hydration shells are linked with each other.
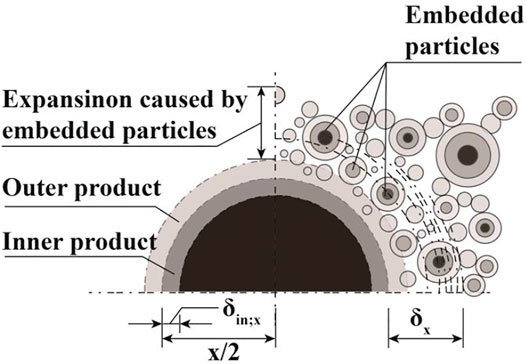
FIGURE 1. Schematic illustration of the growth mechanism of the HYMOSTRUC model (Courard, 2005). The left part shows the growth of a single cement particle and the formation of inner and outer products; the right part shows the embedding of small cement particles in the outer shell of a large cement particle.
The basic formula for determining the rate of hydration of an individual cement particle in the HYMOSTRUC model is described as (Van Breugel, 1991):
where δin,x is the thickness of the inner hydration products in cement particle x; K0 is the basic rate factor constant depending on the cement composition and the degree of hydration; and Le et al. (2013) proposed a series of formulas to calculate the values of K0 of C3S, C2S, C3A and C4AF. Since the volume fraction of the cement components of the cement used in this study is C3S:C2S:C3A:C4AF = 0.65:0.18:0.11:0.06, the average basic rate factor constant K0 is taken to be 0.428 μm/h; Ωi (i = 1, 2, 3) are the reduction factors accounting for the different effects of water; Fi (i = 1, 2) are the temperature-related factors accounting for the effect of curing temperature; δx is the total thickness of the hydration products (i.e., the thickness of the hydration shell shown in Figure 1); δtr is the transition thickness equal δx time that the controlling mechanism changes from the “phase-boundary” stage (β1 = 0 and δtr/δx ≤ 1) to the “diffusion” stage (β1 = 1 and δtr/δx > 1); β1 is a constant; λ is the factor depending on the rate-controlling mechanism. The three water-related factors Ω1, Ω2 and Ω3 are water content-dependent parameters, which are affected by moisture exchange during cement hydration. The details about the relationship between these three factors and moisture exchanged during hydration are described in Supplementary Appendix A1.
The hydration degree of cement particle x can be calculated by dividing the incrementally decreased volume by the initial volume of the cement particle:
where
Then, the overall degree of hydration
where W(z) is the initial mass of cement particle z.
For a given w/c ratio ω0, the volume ratio of water and cement can be expressed by ω0ρce/ρcw, and the initial volume of cement particles in a unit volume of cement paste V0,ce can then be calculated as:
where ρce is the density of cement, which is 3.15 g/cm3; ρw is the density of water, which is 1 g/cm3.
According to Powers’ model (Taylor, 1997), the amount of water consumed by cement hydration can be approximately calculated as:
where β is the volume of the water consumed by the hydration of per unit volume cement; α is the degree of hydration.
The fully hydrated cement contained two types of water, named non-evaporable water and gel water (Taylor, 1997). Non-evaporable water includes chemically bound and interlayer water in hydration products such as C-S-H and AFm (Taylor, 1997). The gel water is the water lost from the C-S-H upon passing from the saturated to the D-dry condition. It comprises part of the gel pore water plus an arbitrarily defined fraction of the interlayer water (Taylor, 1997). The hydration product contains, per g of cement, approximately 0.22 g of non-evaporable water and 0.21 g of gel water (Neville, 1995). Power and Brownyard (1946) proposed that the complete hydration of 1 g cement consumes approximately 0.4 g water. Therefore, considering the gel water in gel pores, β can be calculated as:
According to Mindess and Young (1981), the porosity in hardened cement paste can be divided into capillary and gel porosity. Capillary porosity influences the strength and moisture transport of hardened cement paste, while gel porosity influences the shrinkage and creep properties. This study focuses on the influence of moisture transport from repair materials to concrete substrates on the hydration of repair materials. Therefore, this study considers only the capillary porosity, and the gel porosity is neglected for simplicity. The capillary porosity can be calculated by subtracting the volumes of the unhydrated cement and the hydration products from the total volume of the hardened cement paste. Powers (Powers and Brownyard, 1946) proposed a model to calculate the porosity in hardened cement paste, given as:
The Rayleigh-Ritz distribution (Chaube et al., 1999) is used to predict the size distribution of pores in cement-based materials. It reveals the relationship between the fraction of pores V and the pore radius r. Figure 2 compares the pore size distribution simulated by the Rayleigh-Ritz model and measured by pressurization–depressurization cycling Mercury intrusion porosimetry (PDC-MIP) and Wood’s metal intrusion porosimetry (WMIP). The calculation of the pore size distribution based on the Rayleigh-Ritz model can be expressed as:
where B is the Rayleigh-Ritz pore size distribution constant, representing the peak pore size distribution on a logarithmic scale.
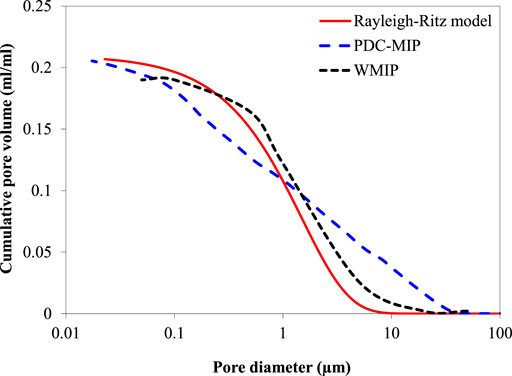
FIGURE 2. Pore size distributions simulated by the Rayleigh-Ritz model and measured by PDC-MIP [after Zhou et al. (2010)] and WMIP (after Willis et al. (1998)].
Moisture transport occurs in porous media in the forms of liquid and vapor. At low relative humidity, water exists mainly in the form of vapor. At high relative humidity, capillary action dominates moisture transport. Capillary action is much faster and in a larger quantity than vapor diffusion. Crausse et al. (1981) suggested that when the relative humidity in the pore system exceeds 4%, the contribution of the vapor phase to overall moisture transport is negligible. In cement paste and concrete, the relative humidity is normally higher than 75% (Neville, 1995). This research, therefore, focuses on capillary action rather than vapor diffusion.
Darcy’s law is used to describe the water transport in cement-based materials, expressed as (Dullien, 1992):
where q is the volumetric flux of water; Kθ is the water permeability, depending on the water content θ and saturation of the pores in the matrix; pt is the pressure that causes the water transport, which is the sum of the capillary pressure p and the hydraulic pressure ph.
The rate of the water content changes due to moisture transport ∂θmx/∂t can be calculated as:
The definitions of the water permeability Kθ and the capillary pressure p are described in detail in Supplementary Appendix A3.
Substituting Eqs 6–12 into Eq. 1, the equation for describing the water content change in repair materials can be expressed as:
The model for simulating cement hydration and moisture transport in repair materials is programmed using MATLAB. The numerical simulation is described in detail in this section.
Previous work has been done to experimentally study the hydration process and microstructure evaluation in concrete repairs with cementitious repair materials (Courard and Degeimbre, 2003). For comparison, this numerical study investigates the same repair cement paste (as shown in Figure 3) with the same material composition. The thicknesses of the repair material and the concrete substrate are both 60 mm. The repair material is ordinary Portland cement paste with a cement-to-water ratio of 0.4. The chemical composition of Portland cement is listed in Table 1. Assume that the concrete substrate consists of two phases, coarse aggregates and mortar. The coarse aggregates are modeled as spheres with given size distribution and randomly distributed in the cube specimen shown in Figure 4. The detailed proportions and coarse aggregates in the concrete substrate are listed in Tables 2, 3.
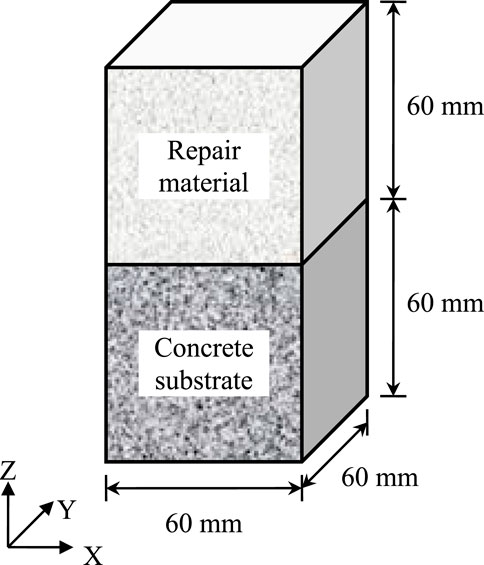
FIGURE 3. Repair system used in the numerical simulation.

TABLE 1. Chemical composition of Portland cement.
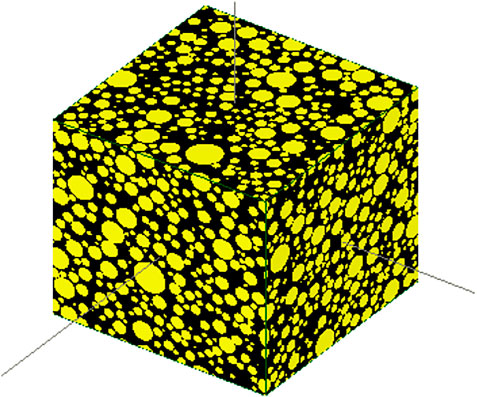
FIGURE 4. Simulated concrete substrate, where the spheres represent coarse aggregates and the rest space represents mortar.

TABLE 2. Mix composition of the substrate concrete.
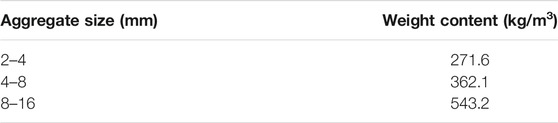
TABLE 3. Proportion of the coarse aggregates in the concrete substrate.
The coarse aggregates occupy 44.4% of the volume of concrete, while the mortar occupies 55.6% of the volume of concrete. The coarse aggregates have very low porosity, and their porosity is neglected. The porosity of the mortar is 14.7%. The degree of saturation of the concrete substrate is 14.4%.
Due to the “wall effect”, the cement particles have a loose packing at the surface of the concrete substrate. The w/c ratio is, therefore, locally increased. In the simulation, the cement particles are considered a group of spheres. The distribution of these spheres on a rigid boundary is used to simulate the packing of cement particles at the surface of the concrete substrate, as shown in Figure 5. The w/c volume ratio from the rigid boundary can be calculated by dividing the number of voxels of cement by that of water. The w/c volume ratio is then converted to the w/c ratio by dividing the w/c density ratio.
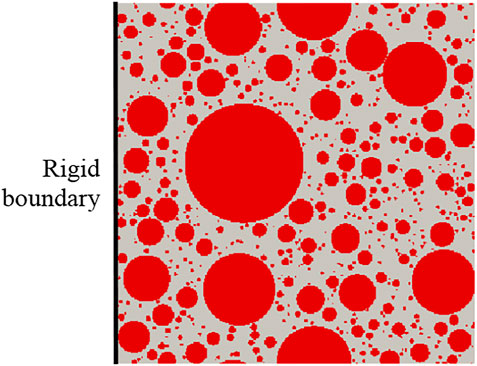
FIGURE 5. Cement particle packing at rigid boundaries (1002 μm2).
Figure 6 shows the local w/c ratio over the distance from a rigid boundary obtained by the numerical model. Close to the rigid boundary, the local w/c ratio is very high. As the distance from the concrete substrate increases, the local w/c ratio decreases. The results indicate that the thickness of the interfacial zone is approximately 20 μm when the w/c ratio of repair cement paste ranges from 0.26 to 0.4. This value agrees well with the experimental results of BSE image analysis (Zhou et al., 2016). In the following discussion, the 20 μm-thick interfacial zone is called the “interface”, distinguished from the “bulk repair material”.
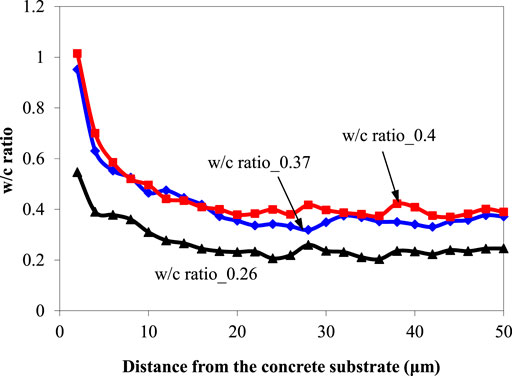
FIGURE 6. Local w/c ratio versus the distance from the concrete substrate in the cement pastes with overall w/c ratios of 0.26, 0.37 and 0.4.
After the repair material is placed on the concrete substrate, the repair material needs several hours to harden. A previous study (Zhou et al., 2016) revealed that an unsaturated concrete substrate absorbs water from a fresh repair material. As mentioned above, the water absorption is driven by the capillary pressure and the hydraulic pressure generated by the gravity force of the fresh repair material. Before the repair material setting, the solid phases, i.e., the cement particles and a small amount of the hydration products, are suspended in water and isolated from each other. Due to the gravitation of cement paste, the free water is pushed out from the repair cement paste to migrate into the concrete substrate. Consequently, the hydraulic pressure can be calculated as follows:
where hr is the thickness of the repair material; and g is the acceleration of gravity.
The loss of water in the repair material reduces the w/c ratio, called the resultant w/c ratio. The resultant w/c ratio ωres (x,y,z) can be calculated as follows:
where Vab (x,y,z) is the volumetric water loss in the repair material due to the water absorption of the concrete substrate.
The setting time of the repair material depends on the w/c ratio. As shown in Figure 7, when the w/c ratio is between 0.3 and 0.5, the setting time is approximately proportional to the w/c ratio of the repair material (Amziane, 2006). The setting time tset can, therefore, be determined as:
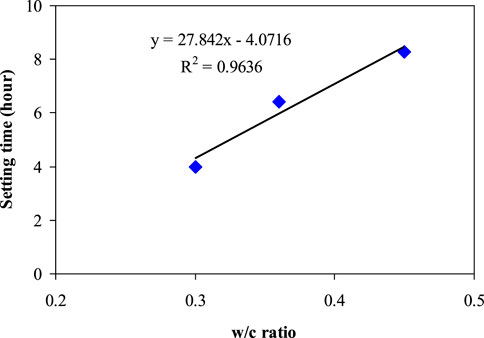
FIGURE 7. Setting time versus the w/c ratio of the cement paste (after Amziane (Mindess and Young, 1981)).
After the repair material setting, a solid framework has formed in the repair material. The loss of water cannot reduce the w/c ratio of the repair material in this stage. The driving force for moisture exchange becomes the capillary gradient in these two materials, and the moisture exchange process can be calculated using Eq. 11. In the simulation, further cement hydration and the change in the porosity in the concrete substrate are not considered. The degree of hydration and the porosity of the repair cement paste cured at 20°C for 28 days are calculated using (Eqs 4–8), respectively.
First, the unsaturated concrete substrate’s water absorption behavior is studied using numerical simulations and experiments. The experimental method follows the European standard EN 480-5 (2005). The concrete specimen prepared based on the mix proportion listed in Table 2 is a cylinder with a diameter of 60 mm and a thickness of 60 mm. The porosity of the specimen is tested by MIP and is 0.144. The specimens are coated with a thin layer of epoxy to prevent water penetration from the side surfaces of the cylinder specimen. After the epoxy hardened, the specimens were suspended on balance and then immersed in water, as shown in Figure 8A. The immersed level is 5 mm. After the specimen comes in contact with water, water is absorbed into the specimen, and the weight of the specimens increases continuously. The weight change of the specimen was measured for 10 h. Three parallel measurements are done.
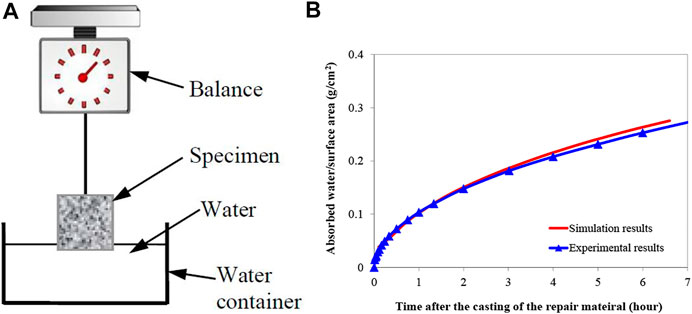
FIGURE 8. Comparison of the amount of water absorbed by the concrete substrate obtained from the numerical simulation and the water absorption test, (A) test setup, and (B) comparison of the simulation and test results.
The numerical model is used to simulate the absorbed water behavior of the concrete substrate based on the same conditions as the test. The comparison of simulation and test results is drawn in Figure 8B. The good agreement between the two curves indicates that the simulation gives a good prediction of the water absorption process of the concrete substrate.
Figure 9 shows the simulated change in the water content profile in the concrete substrate due to water absorption. The water absorption results in an increase in the water content of the concrete substrate. Water in the concrete substrate gradually moves from the surface exposed to the repair material to the bottom.
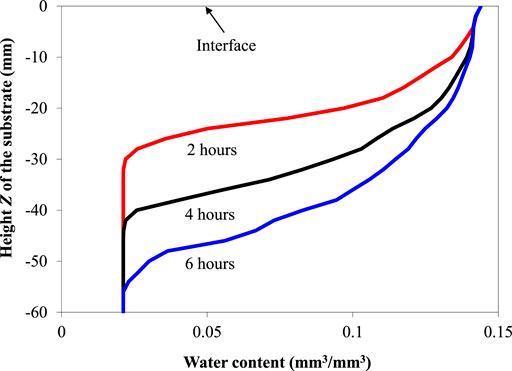
FIGURE 9. Simulated water content in the concrete substrate at 2, 4 and 6 h after placing the repair material.
The water absorption of the concrete substrate causes a reduction in the w/c ratio in the bulk repair material and at the interface. The concrete substrate absorbs 0.28 g/cm2, and the resultant w/c ratio in the bulk repair is 0.37. The simulated resultant w/c ratio agrees well with the value obtained from BSE image analysis, which is 0.36 (Courard and Degeimbre, 2003). Due to the “wall effect”, the interface has a relatively loose particle packing and a higher resultant w/c ratio of 0.53.
Figure 10 shows the water content profile in the repair material and the concrete substrate at curing ages of 1, 7, 21 and 28 days obtained from the simulation. As time elapses, the total water content in the repair material and the concrete substrate decreases. The reason is that cement hydration consumes a part of the water in the repair material.
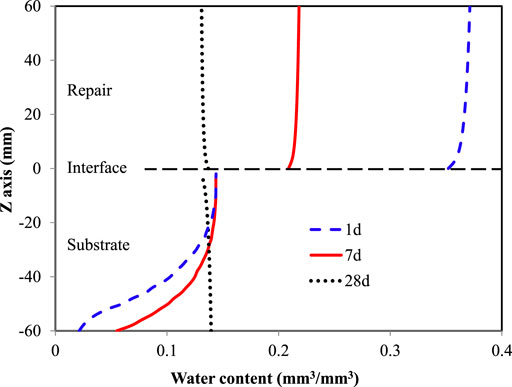
FIGURE 10. Change in the water content of the repair material and the concrete substrate at 1, 7, and 28 days obtained from the numerical simulation.
At 1 and 7 days, in the concrete substrate, the closer to the interface, the higher the water content is. In the repair material, the closer to the interface, the lower the water content is. These results imply that some water moves from the repair material to the concrete substrate driven by the capillary gradient.
At 21 days, the concrete substrate became fully saturated, while the water content of the repair material decreased. The water content distribution in the repair material becomes more uniform, and the water content close to the interface is slightly lower than that at the top. These results imply that the moisture transport process becomes slower, and the repair-substrate system approaches the balanced condition in capillary potential. At 28 days, the water content in the concrete substrate decreases when approaching the repair-substrate interface. In the repair material, the water content close to the interface becomes higher than that at the top. The reason is that as cement hydration proceeds, the water content decreases and the pore sizes decrease. The capillary pressure, therefore, increases. When the capillary pressure in the repair material exceeds that in the concrete substrate, water is forced to flow from the concrete substrate to the repair material.
The hydration degree and porosity of the bulk repair material and the interface are evaluated by simulation and experiment. For experimental research, the initial w/c of repair cement paste is 0.4 (the components are listed in Table 1), and the concrete substrate is prepared using the mix proportion listed in Table 2. The test specimen dimensions are shown in Figure 11A. After curing, small pieces were taken from the specimen to test the hydration degree and porosity. The hydration degree of bulk repair materials with different curing ages is determined by measuring their non-evaporable water content. The porosities of the repair material and the concrete substrates are measured using MIP. The detailed test procedures follow those proposed in Zhou (2011).
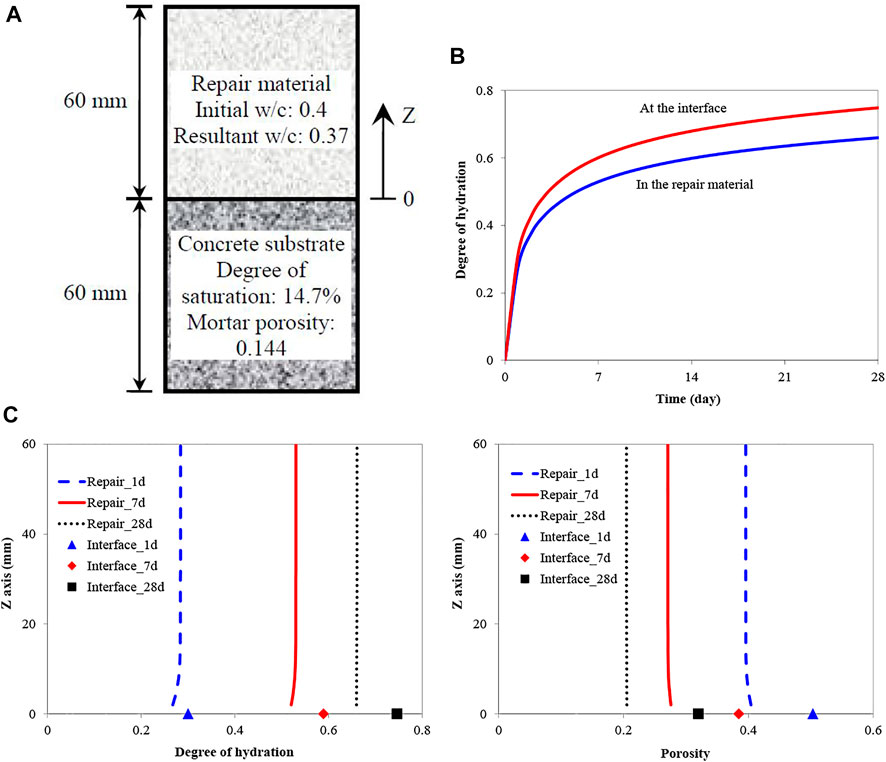
FIGURE 11. Degree of hydration in the bulk repair material and at the interface. (A) In the first 28 days obtained from the simulation, (B) the degree of hydration at 1, 7 and 28 days, (C) porosity at 1, 7 and 28 days.
The numerical model is used to simulate the hydration process of the repair cement mortar based on the same conditions as the test. The comparison of the simulation and experimental results are listed in Table 4. In general, the simulation results agree well with the experimental results. The good agreement between the simulation results and experimental results indicates that the numerical model can accurately simulate the cement hydration process and microstructure development in the repair system.
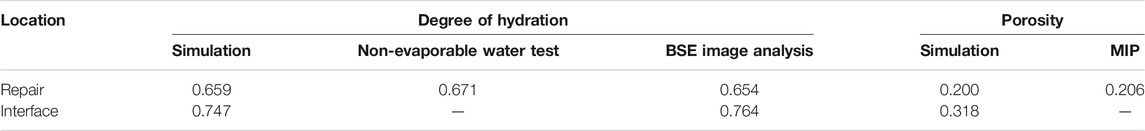
TABLE 4. Comparison between the simulation results and experimental results (Zhou et al., 2016) of the degree of hydration and porosity in the bulk repair material and at the interface.
Now, the numerical model is used to simulate the hydration process of the repair cement paste. The condition and dimension of the repair system used in the simulation are shown in Figure 11A. Figure 11B shows the evolution of the degree of hydration in the bulk repair material (at half height) and at the interface in the first 28 days obtained from the simulation. Due to the “wall effect”, the interface has a higher w/c ratio than the bulk repair material. Therefore, the cement paste shows a higher degree of hydration at the interface.
Figure 11C shows the degree of hydration of the bulk repair material and the interface at 1, 7 and 28 days obtained from the simulation. Since the interface has a higher resultant w/c ratio than the bulk repair material, its hydration rate is higher than that of the bulk repair material. Therefore, the hydration degree of the interface is higher than that of bulk repair material with the same curing age. The results indicate that cement hydration proceeds slower in the bulk repair material closer to the interface, where the bulk repair material loses more water at the early stage. Later, the hydration process in the bulk repair material close to the interface becomes relatively fast since some water flows back to the bulk repair material from the substrate concrete to provide additional water for cement hydration.
Figure 11D shows the simulated porosity of the bulk repair material and the interface at 1, 7 and 28 curing days. Since the interface has a higher resultant w/c ratio than the bulk repair material, the porosity is higher than that in the bulk repair material. In the first 28 days, the porosity of the interface is approximately 1.5 times higher than that of the bulk repair material, which may reduce the bonding strength between the repair material and concrete substrate.
This paper presents a numerical study on the cement hydration and microstructure development of repair materials influenced by moisture exchange. Based on the simulation results, the following conclusions can be drawn:
• The moisture exchange between the repair material and concrete substrate results in a change in the water content in two parts, which affects the cement hydration process and microstructure development in the repair system.
• Before the repair material setting, the water absorption of an unsaturated concrete substrate causes a reduction in the w/c ratio in the repair material, called the resultant w/c ratio. The resultant w/c ratio in the repair material greatly influences the cement hydration and porosity of the repair material.
• After the repair material setting, the cement hydration works as a “motor”. It generates the driving force for moisture transport in the two materials, while water acts as “fuel”, which consumes the “motor” and influences the efficiency of the “motor".
The original contributions presented in the study are included in the article/Supplementary Material, further inquiries can be directed to the corresponding authors.
ML: Numerical simulation and experimental verification JZ: Establish numerical model HL: Model modification and validation analysis YW: Data curation, Writing-original draft.
The authors declare that the research was conducted in the absence of any commercial or financial relationships that could be construed as a potential conflict of interest.
All claims expressed in this article are solely those of the authors and do not necessarily represent those of their affiliated organizations, or those of the publisher, the editors and the reviewers. Any product that may be evaluated in this article, or claim that may be made by its manufacturer, is not guaranteed or endorsed by the publisher.
The authors gratefully acknowledge the financial support of the National Natural Science Foundation of China (Project No. 5217083356), the Natural Science Foundation of Beijing Municipality (Project No. KZ202010005013) and the Scientific Research Program of Tianjin Municipal Education Commission (Project No. 20140913).
The Supplementary Material for this article can be found online at: https://www.frontiersin.org/articles/10.3389/fmats.2022.829743/full#supplementary-material
Abo Sabah, S. H., Hassan, M. H., Muhamad Bunnori, N., and Megat Johari, M. A. (2019). Bond Strength of the Interface between normal concrete Substrate and GUSMRC Repair Material Overlay. Construction Building Mater. 216, 261–271. doi:10.1016/j.conbuildmat.2019.04.270
Amziane, S. (2006). Setting Time Determination of Cementitious Materials Based on Measurements of the Hydraulic Pressure Variations. Cement Concrete Res. 36, 295–304. doi:10.1016/j.cemconres.2005.06.013
Chaube, R., Kishi, T., and Maekawa, K. (1999). Modelling of concrete Performance: Hydration, Microstructure and Mass Transport. first ed. London: CRC Press.
Courard, L. (2005). Adhesion of Repair Systems to concrete: Influence of Interfacial Topography and Transport Phenomena. Mag. Concrete Res. 57, 273–282. doi:10.1680/macr.2005.57.5.273
Courard, L., and Degeimbre, R. (2003). A Capillary Action Test for the Investigation of Adhesion in Repair Technology. Can. J. Civ. Eng. 30, 1101–1110. doi:10.1139/l03-061
Courard, L. (2000). Parametric Study for the Creation of the Interface between concrete and Repair Products. Mat. Struct. 33, 65–72. doi:10.1007/bf02481698
Crausse, P., Bacon, G., and Bories, S. (1981). Etude fondamentale des transferts couples chaleur-masse en milieu poreux. Int. J. Heat Mass Transfer 24, 991–1004. doi:10.1016/0017-9310(81)90130-7
Dullien, F. A. (1992). Porous Media: Fluid Transport and Pore Structure. Second ed. Salt Lake City: Academic Press.
Emmons, P. H., and Vaysburd, A. M. (1994). Factors Affecting the Durability of concrete Repair: the Contractor's Viewpoint. Construction Building Mater. 8, 5–16. doi:10.1016/0950-0618(94)90003-5
EN 480-5 (2005). Admixtures for Concrete, Mortar and Grout - Test Methods - Part 5. London: Determination of Capillary Absorption (in British).
Feldman, R. (1986). Pore Structure, Permeability and Diffusivity as Related to Durability. Rio de Janeiro: 8th International Congress on Chemistry of Cement, 336–356. (in Brazi).
Gadri, K., and Guettala, A. (2017). Evaluation of Bond Strength between Sand concrete as New Repair Material and Ordinary concrete Substrate (The Surface Roughness Effect). Construction Building Mater. 157, 1133–1144. doi:10.1016/j.conbuildmat.2017.09.183
Garbacz, A., Piotrowski, T., Courard, L., and Kwaśniewski, L. (2017). On the Evaluation of Interface Quality in concrete Repair System by Means of Impact-echo Signal Analysis. Construction Building Mater. 134, 311–323. doi:10.1016/j.conbuildmat.2016.12.064
Gomaa, E., Gheni, A., and ElGawady, M. A. (2020). Repair of Ordinary Portland Cement concrete Using Ambient-Cured Alkali-Activated concrete: Interfacial Behavior. Cement Concrete Res. 129, 105968. doi:10.1016/j.cemconres.2019.105968
Hobbs, D. W. (2001). Concrete Deterioration: Causes, Diagnosis, and Minimising Risk. Int. Mater. Rev. 46, 117–144. doi:10.1179/095066001101528420
Koenders, E. (1997). Simulation of Volume Changes in Hardening Cement-Based Materials. Delft: Delft University of Technology.
Le, N. L. B., Stroeven, M., Sluys, L. J., and Stroeven, P. (2013). A Novel Numerical Multi-Component Model for Simulating Hydration of Cement. Comput. Mater. Sci. 78, 12–21. doi:10.1016/j.commatsci.2013.05.021
Lukovic, M., and Ye, G. (2016). Effect of Moisture Exchange on Interface Formation in the Repair System Studied by X-ray Absorption. Materials 9, 2. doi:10.3390/ma9010002
Mehta, P. K., and Monteiro, P. J. (2014). Concrete: Microstructure, Properties, and Materials. fourth ed. New York: McGraw-Hill Education.
Momayez, A., Ehsani, M. R., Ramezanianpour, A. A., and Rajaie, H. (2005). Comparison of Methods for Evaluating Bond Strength between concrete Substrate and Repair Materials. Cement Concrete Res. 35, 748–757. doi:10.1016/j.cemconres.2004.05.027
Powers, T. C., and Brownyard, T. L. (1946). Studies of the Physical Properties of Hardened Portland Cement Paste. J. Am. Concrete Inst. 43, 101–132.
Shi, C., Wang, P., Ma, C., Zou, X., and Yang, L. (2021). Effects of SAE and SBR on Properties of Rapid Hardening Repair Mortar. J. Building Eng. 35, 102000. doi:10.1016/j.jobe.2020.102000
Van Breugel, K. (1991). Simulation of Hydration and Formation of Structure in Hardening Cement-Based Materials. Delft: Delft University of Technology.
Wang, Y. S., Peng, K. D., Alrefaei, Y., and Dai, J. G. (2021). The Bond between Geopolymer Repair Mortars and OPC concrete Substrate: Strength and Microscopic Interactions. Cement and Concrete Composites 119 (2021), 103991. doi:10.1016/j.cemconcomp.2021.103991
Willis, K. L., Abell, A. B., and Lange, D. A. (1998). Image-based Characterization of Cement Pore Structure Using Wood's Metal Intrusion. Cement Concrete Res. 28, 1695–1705. doi:10.1016/S0008-8846(98)00159-8
Xie, T., Gholampour, A., and Ozbakkaloglu, T. (2018). Toward the Development of Sustainable Concretes with Recycled concrete Aggregates: Comprehensive Review of Studies on Mechanical Properties. J. Mater. Civ. Eng. 309, 04018211. doi:10.1061/(ASCE)MT.1943-5533.0002304
Xue, S., Zhang, P., Lehmann, E. H., Hovind, J., and Wittmann, F. H. (2021). Neutron Radiography of Water Exchange across the Interface between Old and Fresh Mortar. Measurement 183, 109882. doi:10.1016/j.measurement.2021.109882
Ye, G. (2003). Experimental Study and Numerical Simulation of the Development of the Microstructure and Permeability of Cementitious Materials. Delft: Delft University of Technology.
Ye, G., van Breugel, K., and Fraaij, A. L. A. (2003). Three-dimensional Microstructure Analysis of Numerically Simulated Cementitious Materials. Cement Concrete Res. 33, 215–222. doi:10.1016/S0008-8846(02)00889-X
Yin, G.-J., Zuo, X.-B., Li, X.-N., and Zou, Y.-X. (2020). An Integrated Macro-Microscopic Model for concrete Deterioration under External Sulfate Attack. Eng. Fracture Mech. 240, 107345. doi:10.1016/j.engfracmech.2020.107345
Zhao, H., Liu, J., Yin, X., Wang, Y., and Huang, D. (2019). A Multiscale Prediction Model and Simulation for Autogenous Shrinkage Deformation of Early-Age Cementitious Materials. Construction Building Mater. 215, 482–493. doi:10.1016/j.conbuildmat.2019.04.225
Zhou, J. (2011). Performance of Engineered Cementitious Composites for Concrete Repairs. Delft: Delft University of Technology.
Zhou, J., Ye, G., and van Breugel, K. (2016). Cement Hydration and Microstructure in concrete Repairs with Cementitious Repair Materials. Construction Building Mater. 112, 765–772. doi:10.1016/j.conbuildmat.2016.02.203
Keywords: numerical simulation, concrete repair, cement hydration, microstructure, moisture transport
Citation: Lan M, Zhou J, Li H and Wang Y (2022) Numerical Simulation on Cement Hydration and Microstructure Development in Repair-Substrate Interface. Front. Mater. 9:829743. doi: 10.3389/fmats.2022.829743
Received: 06 December 2021; Accepted: 14 January 2022;
Published: 03 February 2022.
Edited by:
Zhigang Zhang, Chongqing University, ChinaReviewed by:
Zhidong Zhang, ETH Zürich, SwitzerlandCopyright © 2022 Lan, Zhou, Li and Wang. This is an open-access article distributed under the terms of the Creative Commons Attribution License (CC BY). The use, distribution or reproduction in other forums is permitted, provided the original author(s) and the copyright owner(s) are credited and that the original publication in this journal is cited, in accordance with accepted academic practice. No use, distribution or reproduction is permitted which does not comply with these terms.
*Correspondence: Mingzhang Lan, bGFubWluZ3poYW5nQGJqdXQuZWR1LmNu; Hui Li, aGxhX3p5akBoZWJ1dC5lZHUuY24=
Disclaimer: All claims expressed in this article are solely those of the authors and do not necessarily represent those of their affiliated organizations, or those of the publisher, the editors and the reviewers. Any product that may be evaluated in this article or claim that may be made by its manufacturer is not guaranteed or endorsed by the publisher.
Research integrity at Frontiers
Learn more about the work of our research integrity team to safeguard the quality of each article we publish.