 Saruchi
 Vaneet Kumar2
95% of researchers rate our articles as excellent or good
Learn more about the work of our research integrity team to safeguard the quality of each article we publish.
Find out more
ORIGINAL RESEARCH article
Front. Mater. , 17 February 2022
Sec. Polymeric and Composite Materials
Volume 9 - 2022 | https://doi.org/10.3389/fmats.2022.827314
This article is part of the Research Topic 2021 Retrospective: Polymeric and Composite Materials View all 8 articles
A novel approach was used to synthesize karaya gum-Cu, Ni nanoparticles based bionanocomposite by microwave irradiation method. Synthesized bionanocomposite was characterized by different techniques like Fourier transform infrared spectroscopy (FTIR), Field Emission scanning electron microscopy (FESEM), X-ray diffraction (XRD), High Resolution Transmission Electron Microscopy (HR-TEM), and Energy Dispersive X-Ray Analysis (EDX). The optimized condition for Karaya Gum-Cu-Ni–Bionanocomposite synthesis was the amount of solvent 4 ml, pH 10, time 20 s, power 100 W, monomer, and cross-linker concentration 14.11 mol L-1 and 0.1135 mol L-1, respectively. The maximum % swelling was found to be 1,176%. Different reaction parameters were optimized to get the maximum adsorption of malachite green dye. The maximum dye adsorption was found to be 94.1%. Different models for kinetics and isotherms were applied to analyze the adsorption data. Malachite green sorption onto bionanocomposite is best defined by pseudo second order kinetics, signifying that the dye uptake by the nanocomposite was organized by chemisorption method involving sharing of electrons in-between the cationic part of the dye as well as the anionic part of the bionanocomposite. Correlation coefficient (R2) was close to unity (0.99569). The R2 values of nanocomposite best fit in the Freundlich adsorption isotherm. The study confirmed the synthesized bionanocomposite was an efficient adsorbent for the adsorption of the harmful malachite green dye.
The utilization of synthetic dyes by industries all over the world is negatively impacting living beings to a disquieting level, as these such pollutants contaminate water bodies. Pollution-causing agents like metallic ions, dyes particles, agricultural chemicals, and benzene ring-containing compounds have a dangerous impact on sea creatures, human beings, and nature. The dye-containing water released from industries is a significant matter that requires attention (Mahida and Patel, 2016).
Several dye mills are disposing of dye particles into natural water resources and are the crucial source of organic pollutants. A large amount of discharged dye waste enters our ecological system and directly affects the environment. The dyes degrade into different products that may have toxicity, including cancer-causing agents (Aberkane-Mechebbek et al., 2009). Hence, we must eliminate these noxious and polluting substances as soon as possible by removing dye molecules from the water.
It is quite challenging to remove dye molecules from water resources, particularly when they are present in a very small concentration. Various methods have been employed for the removal of dye molecules from water resources such as sorption, oxidation, degradation with microorganisms, and electrochemical methods. Out of all these methods, sorption is a is highly efficient and an easy method for the removal of dye from wastewater. Hydrogels are a 3D, cross-linked set-up of water-soluble polymers as well as highly absorbent organizations that can be formulated to a diversity of corporeal varieties including slabs, micro-particles, nano-particles, coatings, and films. Due to distinctive features like porosity, water content, elasticity as well as biocompatibility, hydrogels have gained popularity and are being used in the biomedical and agricultural sectors due to their being a very good adsorbent of harmful material (Crini, 2005; Saruchi and Kumar, 2019a; Faisal et al., 2020).
In recent years the super-absorbing nano-composite substance atop Poly (acrylic acid) and calcium hydroxide spherulite have been blended. The process is conceded out via a free radical polymerization process. The synthesis nanocomposite is an efficient dye removal mechanism in an experiment in which the adsorbent was exposed to methylene blue dye. This experimental work matched with Pseudo second order and Freundlich isotherm (Hu et al., 2018; Chowdhury et al., 2019). Hydrogels from acrylic acid (AA) were prepared and transformed to nanocomposites using Dolichos biflorus, alginate, and AAm through a polymerization method. Swelling studies of the synthesized nanocomposites were determined (Shabir et al., 2017; Basu and Samanta, 2018).
In the present work, Karaya gum, which is a natural polysaccharide, was modified with polyacrylic acid. Then Cu-Ni nanoparticles (NPs) were synthesized and later embedded onto the modified karaya gum, leading to the formation of bionanocomposite. Karaya gum has very good adsorption efficiency and when it is combined with Cu-Ni NPs, its efficiency is enhanced. This synthesized bionanocomposite was then used as an adsorbent for the adsorption of harmful malachite green dye.
Karya gum (Kshipra Biotech Private Limited) was used as a core component. Ammonium persulphate (Avantor Performance Material India Limited) was used as an initiator. N,N′- Methylenebisacrylamide (MBA) (Loba chemie laboratory reagent and fine chemicals) was used as a crosslinker. Acrylic acid was used as a monomer. Copper sulfate, nickel sulfate, sodium hydroxide, and hydrazine solution (Loba chemie laboratory reagent and fine chemicals) were used as precursors for the synthesis of nanoparticles. All the solutions used in the present work were prepared in double-distilled water.
Karaya gum (1 g) was subjected to the known volume of deionized water in a reaction flask. Then APS was added to it with continuous stirring followed by the addition of MBA. In the end, acrylic acid was added slowly to the reaction mixture, and stirred thoroughly until a homogenous mixture was obtained. The homogeneous reaction mixture was then microwaved. The hydrogel obtained was dried to constant weight. Diverse reaction parameters like monomer, amount of solvent, cross linker, initiator, reaction time, power, and pH were optimized with respect to percentage swelling (Ps) to attain a synthesized sample with maximum swelling capacity. Ps was calculated as per the equation given below (Kaith et al., 2010; Naushad et al., 2015; Saruchi and Kumar, 2019b; Saruchi KumarV. et al., 2019; Saruchi K. et al., 2019; Mittal et al., 2020a).
0.05 M solution of CuSO4 was prepared by solubilizing 1.8 g of CuSO4 in distilled water. Then, a 0.05 M solution of NiSO4 was prepared by solubilizing 0.65 g of NiSO4 in distilled water. Both the prepared solutions were mixed with constant stirring and the volume of the solution was raised to 200 ml. The solution was maintained at pH with the help of 0.1 M NaOH solution. 10 ml of hydrazine solution was added to the above prepared solution. The mixture was autoclaved for 3 h and sonicated for about 6 h. The solution was filtered through whatman filter paper and dried in a hot air oven. The particles obtained were found to be in the nanoparticle range (50 nm).
In total, 1 g of hydrogel was synthesized by microwave condition and taken in a beaker with a specific amount of distilled water. Synthesized NPs were added with constant stirring. The mixture was thoroughly mixed and kept for 24 h. After 24 h APS was added to the above mixture and exposed to microwave radiations for 20 s. The amount of nanoparticles added was optimized and the rest of the conditions were kept the same as for the synthesis Kg-cl-Poly (AA). The nanocomposite obtained was washed with distilled water (DW) and dried in a hot air oven.
Samples were completely dried and finely powdered before conducting FTIR. FTIR spectra of the samples were studied from 500 to 4,000 cm−1 on a Perkin Elmer RXI spectrophotometer using KBr pellets (Sigma Aldrich).
The IR Spectrum of Kg-cl-poly (AA) as shown in Figure 1A, exhibits a concentration of absorption band at 2,945 cm−1 which is because of the C-H stretching of the CH2 group, and the 2661cm−1 measurement is because of O-H stretching, the 1702 cm−1 is because of C=O stretching of the COOH group in poly acrylic acid, 1,407 cm−1 is due to C-H deformation of C-H group, 1,169 cm−1 because of stretching vibration of C-O in the rings, and 494 cm−1 is because of pyranose ring.
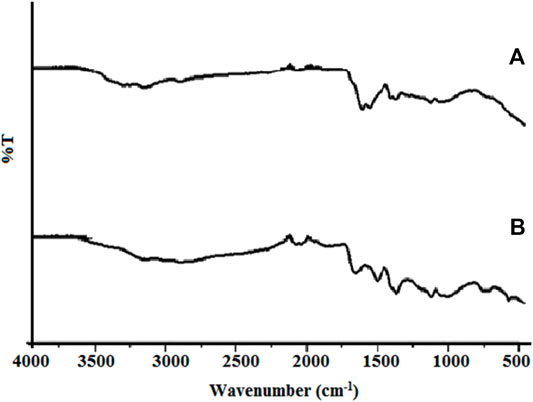
FIGURE 1. (A,B) FTIR spectra of (A) Kg-cl-poly (AA) and (B) Kg-cl-poly (AA)-Cu-Ni bionanocomposite.
The FTIR of Kg-cl-poly (AA)-Cu-Ni bionanocomposite shows an absorption band at 3,337cm−1 pertaining to O-H expansion of intermolecular hydrogen linked OH* cluster. N-H expansion of NH3+, C-H expansion of methyl cluster is seen on 2,936 cm−1, O-H expansion of chelate compound is seen on 2,522 cm−1, N-H expansion of NH2+ is seen on 2322cm−1, the intensity of peak on 2,115 cm−1 refers to C≡C expansion of mono-substituted groups. C=O expansion of amides is seen at 1,651 cm−1. C=C expansion of conjugated dienes was seen at 1,601 cm−1. The potency of a peak on 1,414 cm−1 is pertaining to the C-H deformation of the C-H cluster. The absorption band on 1,168 cm−1 pertains to the C-O expansion of secondary alcohol and the tip on 1,104 cm−1 matches the C-C expansion of the C-C bond (Figure 1B).
The surface morphology of synthesized Kg-cl-poly (AA) and Kg-cl-poly (AA)-Cu-Ni bionanocomposite was examined by Field Emission Scanning Electron Microscopy (FESEM) that was further synchronized with microscopic rays upholding a diminutive volume over a great distance. FESEM of the samples was done by Mc 1,000 Ion sputter Hitachi.
We observed a ridge-like structure with depressions and pits, which ranges uniformly on the Kg-cl-poly (AA) sample, which is not seen in the backbone of other literature. The ridged arrangement present on Kg-cl-poly (AA) exhibits morphological alteration through chemical modification of backbone through grafting and cross-linking (Figure 2A), which is because of the presence of covalent bonding amid polymer chains on cross-linking through N, N-Methylenebisacrylamide (Saruchi et al., 2018). The nanoparticles when incorporated with Kg-cl-poly (AA), undergoes interaction with poly (AA) and nanoparticles, definitely exhibiting morphological changes in the backbone. However, the FESEM of synthesized bionanocomposite shows a highly discontinuous and rough surface in comparison to IPN prepared under in-air conditions (Figure 2B).
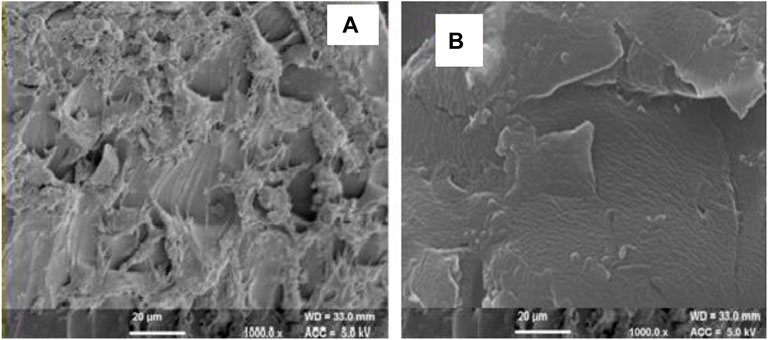
FIGURE 2. (A,B) FESEM of (A) Kg-cl-poly (AA) and (B) Kg-cl-poly (AA)-Cu-Ni-bionanocomposite.
The x-ray diffraction studies of samples were premeditated on X’ Pert Pro and the coherence length of the samples under consideration were calculated by the Schherer equation. XRD studies were performed to analyze the crystalline nature of Kg-cl-poly (AA) and bionanocomposites. The coherence length of Kg-cl-poly (AA) and Kg-cl-poly (AA)-Cu-Ni bionanocomposite was found to be 0.986 and 0.73216, respectively (Figure 3A,B). The maximum peak corresponds to 2Ɵ = 30.044 for bionanocomposite.
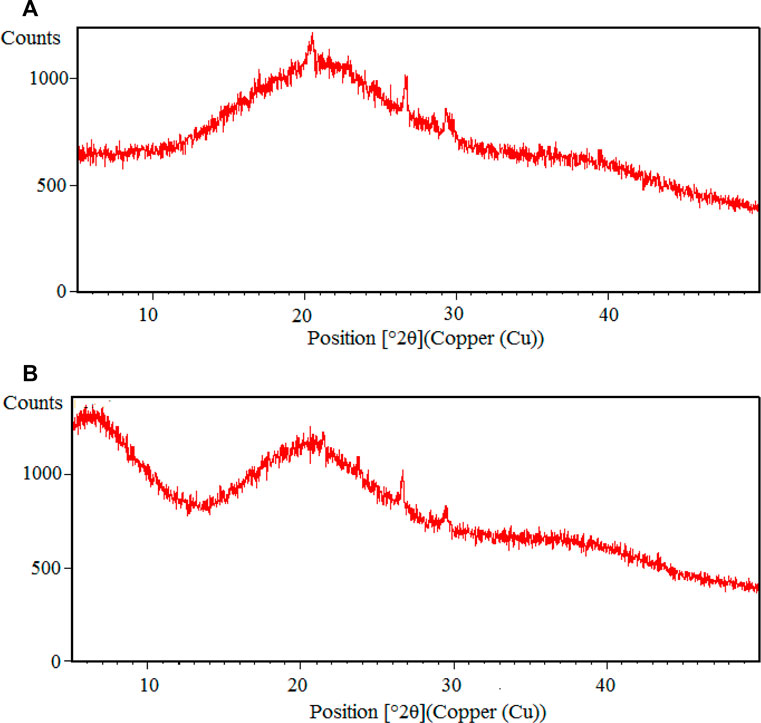
FIGURE 3. (A,B) XRD of (A) Kg-cl-poly (AA) and (B) Kg-cl-poly (AA)-Cu-Ni-bionanocomposite.
Particle shape and size were investigated through HR TEM, which is a highly specialized technique for observing the characteristics of very small samples. TEM micrograph of nanoparticles was performed and some agglomerated particles were seen in the micrograph (Figure 4). The NPs are observed in the form of big spots 12–35 nm), because of the tendency of metallic particles to undergo agglomeration. The metals have properties of agglomeration due to the high surface energy and surface tension of the ultrafine nanoparticles therefore Cu-Ni nanocomposite showed such globular structures on its surface (Saruchi KumarV. et al., 2019).
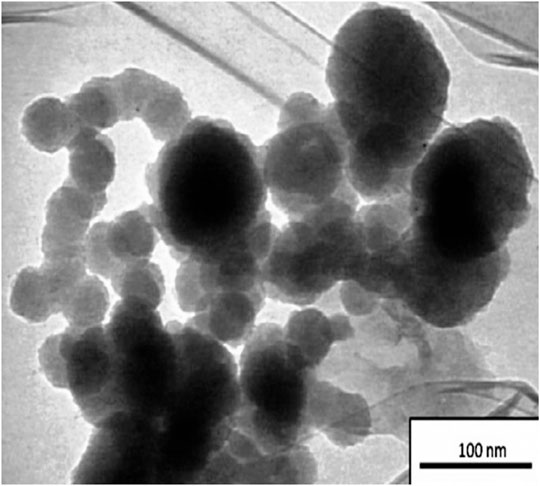
FIGURE 4. HRTEM of synthesized Cu-Ni nanoparticles.
EDS was performed by SU8010 HITACHI. This analytical technique was used to determine the elements present in the nanocomposites as well as their relative abundance. This analytical technique helped in determining the abundance of the elements present in the nanocomposites with the help of an X-ray source. Carbon, oxygen, and nitrogen were found to be the main elements present in Kg-cl-poly (AA). The atomic % of carbon in Kg-cl-poly (AA) is 46.31%. The atomic percentage of oxygen and nitrogen is 36.37 and 17.31%, respectively (Figure 5A). EDX in the case of synthesized bionanocomposite showed the following elements with their atomic (%): carbon (68.75%), oxygen (31.02%), nickel (0.04%), and copper (0.19%) (Figure 5B). The results justify the presence of Cu and Ni as a nanoparticle in bionanocomposite, which is not present in Kg-cl-poly (AA).
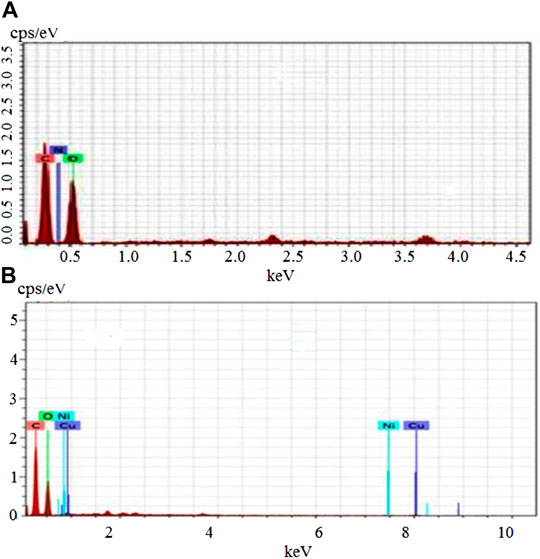
FIGURE 5. (A,B) EDS of (A) Kg-cl-poly (AA) and (B) Kg-cl-poly (AA)-Cu-Ni-bionanocomposite.
The different reaction parameters were optimized with respect to percentage swelling and the details of the outcome are given below:
It is clear from Figure 6A that the Ps augmented along with amplification in reaction time and reached a maximum value of 874% in 20 s, respectively. But on increasing reaction time, the Ps declines. The rise in percent swelling is primarily due to the generation of active sites on the backbone as well as on the monomer chain. On further mounting-up time duration ahead of optimum point, there is a drop in percent swelling which might be due to extreme cross-linking on greater exposure to microwave radiation that in turn leads to less significant fluid uptake. Therefore, the percentage swelling subsides on further raising reaction time.
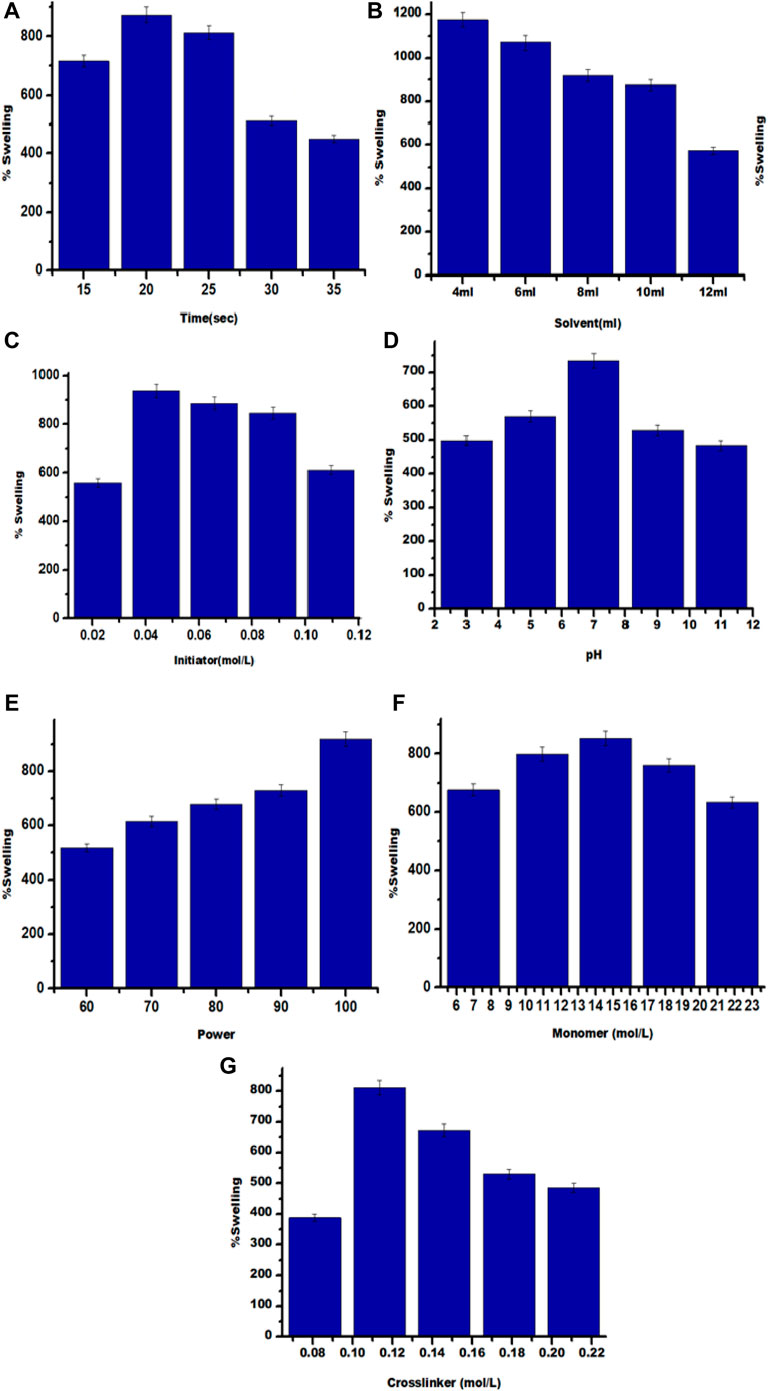
FIGURE 6. (A-G) Impact of (A) Time; (B) Solvent; (C) Initiator concentration; (D) pH; (E) Power; (F) Monomer concentration; (G) Cross linker concentration on Ps of Kg-cl- poly (AA).
Maximum Ps 1,176% was observed with 4 ml solvent under the influence of microwave radiations (Figure 6B). On further increasing the amount of solvent, swelling decreased. It may be due to the reason that excess hydroxyl free radicals terminate the chain reaction, thereby suspending the polymerization reaction.
With the increase in the concentration of initiator, percentage swelling was increased up to optimum level, exhibiting maximum swelling of 937% and decreased thereafter (Figure 6C). It is attributed to the reason that with an increase in the amount of initiator, the concentration of sulfate-free radical as well as hydroxyl free radicals increases, which assists in the generation of more active sites and enhances propagation of polymeric chains, thereby increasing Ps. However, beyond the optimum concentration of APS, excessive sulfate free radical and hydroxyl free radicals are produced, which leads to the termination of the reaction (Saruchi et al., 2020a).
The highest % swelling (734%) in the presence of microwave radiations was determined in a neutral medium (Figure 6D). The pH based ionization of the functional groups present in the polymeric matrix is accountable for swelling. Ps was found to decrease in acidic as well as basic medium due to suppression of the formation of persulfate ions, untimely leading to termination of polymerization reaction as a result of which, polymerization reaction gets terminated and hence % swelling decreases (Rizwan et al., 2017).
Maximum Ps (918%) was attained at 100 MWP (Figure 6E). MW power below 100% caused a reduction of Ps, which might be credited to the generation of an inadequate number of *OH and SO4-* ions. Whereas, the increase in MW power activates backbone radicals thereby, enhancing the gel content and Ps (Kaith et al., 2012).
Under the influence of microwave radiation, optimum Ps was observed to be (852%) at a monomer concentration of 14.1752 mol L-1 (Figure 6F). Initially, by increasing the amount of monomer, Ps increased because of the accessibility of a sufficient number of hydrophilic groups present on the polymer chain. It results in H-bonding between acrylic acid and water molecules, thereby increasing swelling. However, beyond optimum concentration, the network density increases and there is reduced accessibility of water molecules towards COOH entities in a graft polymerized structure, thus decreasing swelling.
Maximum percent swelling with MBA concentration 0.1135 mol L-1 was found to be (811%) (Figure 7G). The Ps increase initially due to the development of cross-links in between the polymeric chains. A decrease in % swelling was observed by increasing cross-linker concentration beyond optimum concentration. It may be due to the reason that the density of the polymer matrix increases as a result of which the matrix turns is more compact and the pore size also reduces and hence, percentage swelling also decreases (Chavda and Patel, 2011).
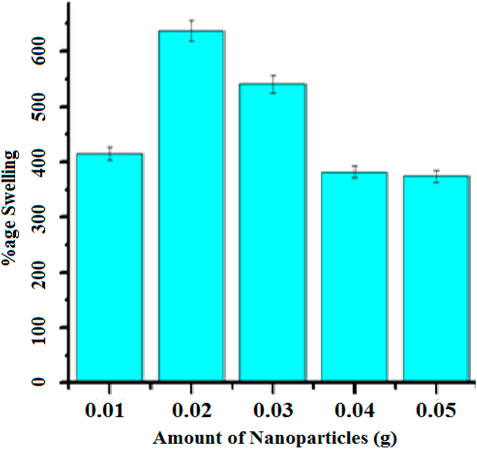
FIGURE 7. Impact of amount of nanoparticles on Ps of Kg-cl-poly (AA)-Cu-Ni bionanocomposite.
Correspondingly the amount of nanoparticles added for synthesizing Kg-cl-poly (AA)-Cu-Ni bionanocomposite was optimized, varying the amount of nanoparticles from (0.01–0.05 g). The highest percent swelling was determined to be 637% at 0.02 g of nanoparticles (Figure 7), but with the increase in nanoparticles % swelling was found to decrease because of reduction in the available free volumes in the matrix. Moreover, the agglomeration of nanoparticles takes place, which resists the swelling of polymers.
It is clear from these results that initial adsorption increases and then an equilibrium stage is reached at 16 h. The maximum % removal was 91.4%, as seen in Figure 8A. Initially, sufficient spaces are available to accommodate dye particles, which is why the % removal upsurges. But after a time gap of 16 h, a monolayer of adsorbate is formed over the adsorbent surface which further slows dye removal (Saruchi et al., 2018).
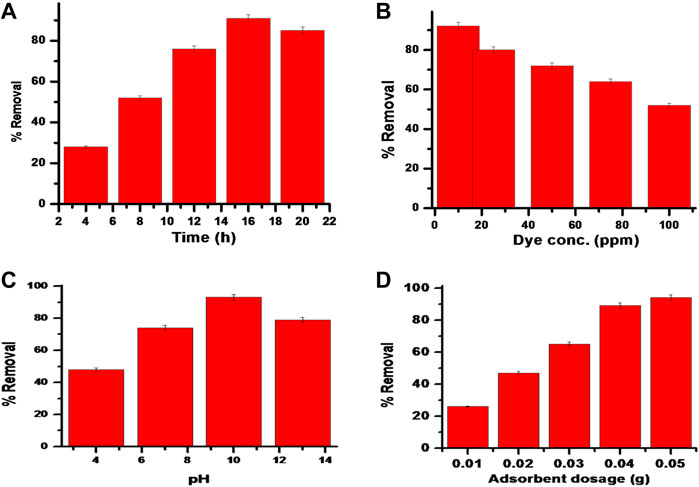
FIGURE 8. (A-D) Impact of (A) Time; (B) Dye concentration; (C) pH and (D) Adsorbent dosage on % removal of dye by Kg-cl-poly (AA)-Cu-Ni bionanocomposite.
Variable concentrations of dye 10–100 ppm were considered for analyzing the impact of dye concentrations over the exclusion of dye. The increase in dye concentration lowers the absorption of dye due to decreased available active sites (Saruchi KumarV. et al., 2019). The result shows that the highest % removal of dye was determined to be 92.3% with a 10 ppm concentration of dye solution (Figure 8B).
Dye removal is dependent upon the pH of the aqueous solution. Any variation in pH causes a change in ionization of dye molecules and also brings about a difference in surface characteristics (Malakootian and Heidari, 2018). Dye adsorption was studied at different pHs (4,7, 10, and 13). pHpzc indicates the point where the net charge on the adsorbent surface is zero. The pHzac value of the synthesized bionanocomposite was found at pH 9. The highest % removal of malachite green 93% was studied at pH 10 (Figure 8C). The removal of dye was less in acidic pH. As Malachite green dye is a cationic dye, therefore it supports the adsorption under alkaline pH. Under alkaline pH conditions, the positive charge with the solution interface diminishes, the surface area of the sorbent seems to be charged negatively, and the cationic dye sorption increases. On the other hand, under acidic pH, the positive charge in the interface of solution enhances and the surface of the sorbent seems to be positively charged, leading to a decrease in cationic dye removal (Seow and Lim, 2016).
The impact of prepared Kg-cl-poly (AA)-Cu-Ni bionanocomposite dosage over dye extraction was analyzed by considering a variable dose of 0.01–0.05 g/L. Dye exclusion using variable dose is exhibited in Figure 8D. It is clear from the result that by enhancing the amount of dose %, removal is enhanced. The highest % removal of 94.1% was determined using 0.05 g/L of the sample dose. This may be due to increased accessibility of vacant spaces over the adsorbent surface (Naushad and ALOthman, 2015; Saruchi et al., 2016; Saruchi K. et al., 2019; Mittal et al., 2020b; Mittal et al., 2020c).
Synthesized Kg-cl-poly (AA)-Cu-Ni bionanocomposite removed a greater amount of malachite green dye by 94.1% from aqueous solutions. Different models for kinetics, as well as isotherms, were applied to analyze the adsorption data.
The adsorption data of Kg-cl-poly (AA)-Cu-Ni in the case of malachite green dye was analyzed for pseudo first order and pseudo second order equations (Naushad, 2014; Mittal et al., 2016; Naushad et al., 2016; Saruchi K. et al., 2019; Naushad et al., 2019; Saruchi et al., 2020a; Saruchi et al., 2020b; Sethi et al., 2020).
Lagergren’s Pseudo First order Equation was applied to the experimental data:
where qe (mg g−1) and qt (mg g−1) refer to the amount of sorbed dye at equilibrium and time t, whereas k1 refers to first order rate constant. Slope, represented as (–k1) and the intercept represented as (ln qe) in-between ln (qe—qt), as well as t was determined (Santhi et al., 2009). The R2 value was determined as 0.91814, moreover, the k1 value was analyzed to below 0.21871, specifying that pseudo-first order is not fitted to the experimental data (Figure 9A).
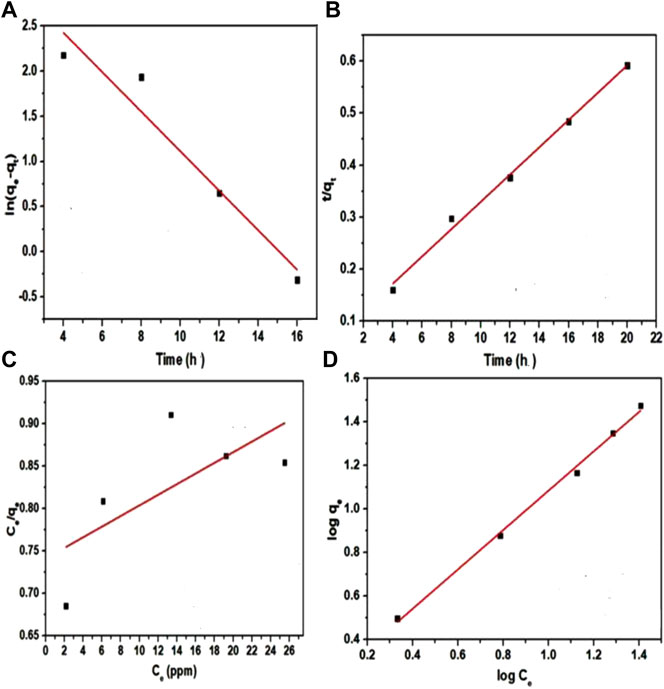
FIGURE 9. (A-D) (A) Pseudo first order kinetics; (B) Pseudo second order kinetics; (C) Langmuir adsorption isotherm and (D) Freundlich adsorption isotherm.
Likewise, pseudo second order kinetics were applied to the experimental data using the equation:
where qe and qt (mg g−1) refer to the amount of sorbed dye at equilibrium and at the time, k2 refers to the second order rate constant. From the plot t/q t against t, k2, and qe values were determined from intercept (1/k2 q2) and slope (1/qe) (Zhang et al., 2017). In the case of bionanocomposite, the R2 value was determined to be closer to unity (0.99271) and k2 was determined to be (1.0253) (Figure 9B). Malachite green sorption onto bionanocomposite is best defined by pseudo second order kinetics, signifying that the dye uptake by the nanocomposite was organized by chemisorptions method involving the sharing of electrons in-between cationic parts of dye as well as the anionic parts of the bionanocomposite.
The theoretical and experimental data of the best-presented models were studied by the coefficient of the determination value (R2). Both these values were produced from varied models. These data were fitted into different error analysis equations and the results showed that the minimum value has minimum error.
The equation of error analysis is given below:
Adsorption isotherm was studied by Langmuir adsorption isotherm and Freundlich adsorption isotherm. Langmuir adsorption isotherm considers a monolayer type of adsorption over the surface bearing a definite amount of active sites. Once these spaces are occupied, no further adsorption occurs; whereas, the Freundlich adsorption isotherm refers to the multi-layered adsorption process (Gomez et al., 2014).
Langmuir isotherm is given by the equation:
Where Ce (mg L−1) represents the equilibrium concentration of malachite green dye, qe refers to the quantity of sorbed dye at equilibrium (mg g−1), b refers to Langmuir constant and Qm represents the monolayer capacity. 1/qe against Ce was plotted to calculate b as well as Qm from obtained intercept and slope (Idan et al., 2018). The R2 value was determined as 0.30911, which was significantly less. Langmuir adsorption isotherm could not be fitted to the experimental data linearly (Figure 9C).
Freundlich adsorption isotherm is expressed by the equation:
where kf (mg/g) refers to the sorption capability, 1/n refers to the heterogeneity factor. The slope (1/n), as well as the intercept (lnkf), was determined by plotting lnqe versus lnCe. The assessed values of 1/n specifies that adsorption isotherm is favorable (0 < 1/n < 1), unfavorable (1/n > 1) or it is irreversible in its nature (1/n = 0) (Kaur and Jindal et al., 2019).
R2 was determined to be 0.99569. The correlation coefficient values of nanocomposite best fit the Freundlich adsorption isotherm (Figure 9D). The error function of different kinetic models was studied and compared, which showed that Freundlich has a minimum experimental error, meaning that it best represented the present experimental data and thus, was best suited for the present work.
The kinetic parameters for the adsorption of malachite green over synthesized bionanocomposite are given in Table 1 and the isotherm parameters for the adsorption of malachite green over synthesized bionanocomposite are given in Table 2.
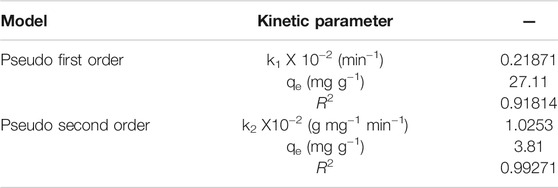
TABLE 1. Kinetic parameters for the adsorption of malachite green over synthesized bionanocomposite.
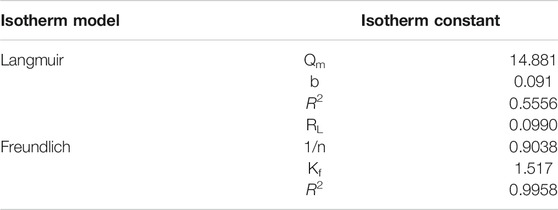
TABLE 2. Isotherm parameters for the adsorption of malachite green over synthesized bionanocomposite.
This study showed synthesized an efficient bionanocomposite of Karya gum and Cu-Ni nanocomposite. TEM showed that nanoparticles were found in the range of 12–35 nm. The maximum dye removal was found to be 94.1%. The maximum malachite green dye adsorption occurred at dye concentration 10ppm, pH 10, adsorbent dosage 0.05 g/L, and after 16 h of contact time. Langmuir adsorption isotherm could not be fitted to the experimental data linearly. R2 was determined to be 0.99569. The correlation coefficient values of nanocomposite best fit in the Freundlich adsorption isotherm. Adsorption isotherm was studied by Langmuir adsorption isotherm and Freundlich adsorption isotherm. The R2 value and error analysis results showed that Freundlich is best suited to the present experimental data. The results clearly showed that synthesized bionanocomposite was very efficient for the adsorption of malachite green dye. Thus, it can be concluded that synthesized bionanocomposite was an eco-friendly and efficient device for the removal of harmful dye and can be used in the near future to remove such type of water pollutant.
The original contributions presented in the study are included in the article/Supplementary Material, further inquiries can be directed to the corresponding author.
All authors listed have made a substantial, direct, and intellectual contribution to the work and approved it for publication.
The authors declare that the research was conducted in the absence of any commercial or financial relationships that could be construed as a potential conflict of interest.
All claims expressed in this article are solely those of the authors and do not necessarily represent those of their affiliated organizations, or those of the publisher, the editors and the reviewers. Any product that may be evaluated in this article, or claim that may be made by its manufacturer, is not guaranteed or endorsed by the publisher.
Authors S and VK are thankful to the CT Group of Institutions, Jalandhar for providing the infrastructure for carrying out this research work. AAG is grateful to the Researchers Supporting Project number (RSP-2021/407), King Saud University, Riyadh, Saudi Arabia for the financial support.
The Supplementary Material for this article can be found online at: https://www.frontiersin.org/articles/10.3389/fmats.2022.827314/full#supplementary-material
Aberkane-Mechebbek, L., Larbi-Youcef, S. F., and Mahlous, M. (2009). Adsorption of Dyes and Metal Ions by Acrylamide - Co - Acrylic Acid Hydrogels Synthesized by Gamma Radiation. Msf 609, 255–259. doi:10.4028/www.scientific.net/msf.609.255
Basu, S., Samanta, H. S., and Ganguly, J. (2018). Green Synthesis and Swelling Behavior of Ag-Nanocomposite Semi-IPN Hydrogels and Their Drug Delivery Using Dolichos Biflorus Linn. Soft Mater. 16, 7–19. doi:10.1080/1539445x.2017.1368559
Chavda, H., and Patel, C. (2011). Effect of Crosslinker Concentration on Characteristics of Superporous Hydrogel. Int. J. Pharma Investig. 1, 17–21. doi:10.4103/2230-973x.76724
Chowdhury, A., Khan, A. A., Kumari, S., and Hussain, S. (2019). Superadsorbent Ni-Co-S/SDS Nanocomposites for Ultrahigh Removal of Cationic, Anionic Organic Dyes and Toxic Metal Ions: Kinetics, Isotherm and Adsorption Mechanism. ACS Sustain. Chem. Eng. 7, 4165–4176. doi:10.1021/acssuschemeng.8b05775
Crini, G. (2005). Recent Developments in Polysaccharide-Based Materials Used as Adsorbents in Wastewater Treatment. Prog. Polym. Sci. 30, 38–70. doi:10.1016/j.progpolymsci.2004.11.002
Faisal, A. A. H., Al-Wakel, S. F. A., Assi, H. A., Naji, L. A., and Naushad, M. (2020). Waterworks Sludge-Filter Sand Permeable Reactive Barrier for Removal of Toxic lead Ions from Contaminated Groundwater. J. Water Process Eng. 33, 101112. doi:10.1016/j.jwpe.2019.101112
Gomez, R., Ortega, A., Lazo, L., and Burillo, G. (2014). Retention of Heavy Metal Ions on Comb-Type Hydrogels Based on Acrylic Acid and 4-Vinylpyridine Synthesized by Gamma Radiation. Radiat. Phys. Chem. 102, 117–123.
Hu, X.-S., Liang, R., and Sun, G. (2018). Super-adsorbent Hydrogel for Removal of Methylene Blue Dye from Aqueous Solution. J. Mater. Chem. A. 6, 17612–17624. doi:10.1039/c8ta04722g
Idan, I., Abdullah, J., Choong, C., and Jamil, S. (2018). Equilibrium, Kinetics and Thermodynamic Adsorption Studies of Acid Dyes on Adsorbent Developed From Kenaf Core Fiber. Adsorp. Sci. Technol. 36, 694–712.
Kaith, B. S., Jindal, R., and Mittal, H. (2010). Superabsorbent Hydrogels from Poly (Acrylamide-co-acrylonitrile) Grafted Gum Ghatti with Salt, pH and Temperature Responsive Properties. Der chemica sinica 1, 92–103.
Kaith, B. S., Saruchi, Jindal. R., Jindal, R., and Bhatti, M. S. (2012). Screening and RSM Optimization for Synthesis of a Gum Tragacanth-Acrylic Acid Based Device for In Situ Controlled Cetirizine Dihydrochloride Release. Soft Matter 8, 2286–2293. doi:10.1039/c2sm07033b
Kaur, K., and Jindal, R. (2019). Comparative Study on the Behaviour of Chitosan-Gelatin Based Hydrogel and Nanocomposite Ion Exchanger Synthesized Under Microwave Conditions Towards Photocatalytic Removal of Cationic Dyes. Carbohydr. Polym. 207, 398–410.
Mahida, V. P., and Patel, M. P. (2016). Removal of Some Most Hazardous Cationic Dyes Using Novel Poly (NIPAAm/AA/N-allylisatin) Nanohydrogel. Arabian J. Chem. 9, 430–442. doi:10.1016/j.arabjc.2014.05.016
Malakootian, M., and Heidari, M. (2018). Reactive orange 16 Dye Adsorption from Aqueous Solutions by Psyllium Seed Powder as a Low-Cost Biosorbent: Kinetic and Equilibrium Studies. Appl. Water Sci. 8, 2190–5487. doi:10.1007/s13201-018-0851-2
Mittal, H., Al Alili, A., and Alhassan, S. M. (2020a). High Efficiency Removal of Methylene Blue Dye Using κ-carrageenan-poly(acrylamide-co-methacrylic acid)/AQSOA-Z05 Zeolite Hydrogel Composites. Cellulose 27, 8269–8285. doi:10.1007/s10570-020-03365-6
Mittal, H., Al Alili, A., and Alhassan, S. M. (2020b). Solid Polymer Desiccants Based on Poly(acrylic Acid-Co-Acrylamide) and Laponite RD: Adsorption Isotherm and Kinetics Studies. Colloids Surf. A: Physicochemical Eng. Aspects 599, 124813. doi:10.1016/j.colsurfa.2020.124813
Mittal, H., Kumar, V., Saruchi, R. S. S., and Ray, S. S. (2016). Adsorption of Methyl Violet from Aqueous Solution Using Gum xanthan/Fe3O4 Based Nanocomposite Hydrogel. Int. J. Biol. Macromolecules 89, 1–11. doi:10.1016/j.ijbiomac.2016.04.050
Mittal, H., Morajkar, P. P., Al Alili, A., and Alhassan, S. M. (2020c). In-Situ Synthesis of ZnO Nanoparticles Using Gum Arabic Based Hydrogels as a Self-Template for Effective Malachite Green Dye Adsorption. J. Polym. Environ. 28, 1637–1653. doi:10.1007/s10924-020-01713-y
Naushad, M., and ALOthman, Z. A. (2015). Separation of Toxic Pb2+metal from Aqueous Solution Using Strongly Acidic Cation-Exchange Resin: Analytical Applications for the Removal of Metal Ions from Pharmaceutical Formulation. Desalination Water Treat. 53, 2158–2166. doi:10.1080/19443994.2013.862744
Naushad, M., Alqadami, A. A., AlOthman, Z. A., Alsohaimi, I. H., Algamdi, M. S., and Aldawsari, A. M. Adsorption Kinetics, Isotherm and Reusability Studies for the Removal of Cationic Dye from Aqueous Medium Using Arginine Modified Activated Carbon, J. Mol. Liquids 293 (2019) 111442. doi:10.1016/j.molliq.2019.111442
Naushad, M., Mittal, A., Rathore, M., and Gupta, V. (2015). Ion-exchange Kinetic Studies for Cd(II), Co(II), Cu(II), and Pb(II) Metal Ions over a Composite Cation Exchanger. Desalination Water Treat. 54, 2883–2890. doi:10.1080/19443994.2014.904823
Naushad, M. (2014). Surfactant Assisted Nano-Composite Cation Exchanger: Development, Characterization and Applications for the Removal of Toxic Pb2+ from Aqueous Medium. Chem. Eng. J. 235, 100–108. doi:10.1016/J.CEJ.2013.09.013
Naushad, M., Vasudevan, S., Sharma, G., Kumar, A., and Alothman, Z. A. (2016). Adsorption Kinetics, Isotherms, and Thermodynamic Studies for Hg2+ Adsorption from Aqueous Medium Using Alizarin Red-S-Loaded Amberlite IRA-400 Resin. Desalination Water Treat. 57 (39), 18551–18559. doi:10.1080/19443994.2015.1090914
Rizwan, M., Yahya, R., Hassan, A., Yar, M., Azzahari, A. D., Selvanathan, V., et al. (2017). pH Sensitive Hydrogels in Drug Delivery: Brief History, Properties, Swelling, and Release Mechanism, Material Selection and Applications. Polymers (Basel) 9, 13. doi:10.3390/polym9040137
Santhi, T., Manonmani, S., Smitha, T., and Mahalakshmi, K. (2009). Adsorption of Malachite Green From Aqueous Solution Onto a Waste Aqua Cultural Shell Powders (Prawn waste): Kinetic. Rasayan J. Chem. 2, 813–824.
Saruchi, K. V., and Kumar, V. (2019a). Adsorption Kinetics and Isotherms for the Removal of Rhodamine B Dye and Pb+2 Ions from Aqueous Solutions by a Hybrid Ion-Exchanger. Arabian J. Chem. 12, 316–329. doi:10.1016/j.arabjc.2016.11.009
Saruchi, K. V., Kumar, V., Kaith, B. S., and Jindal, R. (2016). Synthesis of Hybrid Ion Exchanger for Rhodamine B Dye Removal: Equilibrium, Kinetic and Thermodynamic Studies. Ind. Eng. Chem. Res. 55 (39), 10492–10499. doi:10.1021/acs.iecr.6b01690
Saruchi, K. V., and Kumar, V. (2019b). Separation of Crude Oil from Water Using Chitosan Based Hydrogel. Cellulose 26, 6229–6239. doi:10.1007/s10570-019-02539-1
Saruchi, K. V. S., Thakur, P., and Kumar, V. (2019b). Kinetics and Thermodynamic Studies for Removal of Methylene Blue Dye by Biosynthesize Copper Oxide Nanoparticles and its Antibacterial Activity. J. Environ. Health Sci. Engineer 2817 (1), 367–376. doi:10.1007/s40201-019-00354-1
Saruchi, K. V., Kumar, V., Mittal, H., and Alhassan, S. M. (2019a). Biodegradable Hydrogels of Tragacanth Gum Polysaccharide to Improve Water Retention Capacity of Soil and Environment-Friendly Controlled Release of Agrochemicals. Int. J. Biol. Macromolecules 132, 1252–1261. doi:10.1016/j.ijbiomac.2019.04.023
Saruchi, S. M., Sharma, M., Hatshan, M. R., Kumar, V., and Rana, A. (2020a). Sequestration of Eosin Dye by Magnesium (II)-Doped Zinc Oxide Nanoparticles: Its Kinetic, Isotherm, and Thermodynamic Studies. J. Chem. Eng. Data 66, 646–657. doi:10.1021/acs.jced.0c00810
Saruchi, S. M., Verma, R., Kumar, V., and ALOthman, A. A. (2020b). Comparison between Removal of Ethidium Bromide and Eosin by Synthesized Manganese (II) Doped Zinc (II) Sulphide Nanoparticles: Kinetic, Isotherms and Thermodynamic Studies. J. Environ. Health Sci. Engineer 18, 1175–1187. doi:10.1007/s40201-020-00536-2
Saruchi, V. K., Kumar, V., Rehani, V., and Kaith, B. S. (2018). Microwave-assisted Synthesis of Biodegradable Interpenetrating Polymer Network of Aloe Vera-Poly(acrylic Acid-Co-Acrylamide) for Removal of Malachite green Dye: Equilibrium, Kinetics and Thermodynamic Studies. Iran Polym. J. 27, 913–926. doi:10.1007/s13726-018-0665-y
Seow, T., and Lim, C. (2016). Removal of Dye by Adsorption: A Review. Int. J. Appl. Eng. Res. 11, 2675–2679.
Sethi, S., Kaith, B. S., Saruchi, K. V., and Kumar, V. (2019). Fabrication and Characterization of Microwave Assisted Carboxymethyl Cellulose-Gelatin Silver Nanoparticles Imbibed Hydrogel: Its Evaluation as Dye Degradation. Reactive Funct. Polym. 142, 134–146. doi:10.1016/j.reactfunctpolym.2019.06.014
Sethi, S., SaruchiKaith, B. S., Kaith, B. S., Kaur, M., Sharma, N., and Kumar, V. (2020). Cross-linked Xanthan Gum-Starch Hydrogels as Promising Materials for Controlled Drug Delivery. Cellulose 27, 4565–4589. doi:10.1007/s10570-020-03082-0
Shabir, F., Erum, A., Tulain, U. R., Hussain, M. A., Ahmad, M., and Akhter, F. (2017). Preparation and Characterization of pH Sensitive Crosslinked Linseed Polysaccharides-Co-Acrylic Acid/methacrylic Acid Hydrogels for Controlled Delivery of Ketoprofen. Designed monomers Polym. 20, 485–495. doi:10.1080/15685551.2017.1368116
Keywords: karaya gum, copper-nickel nanoparticles, bionanocomposite, malachite green dye, kinetic adsorption models
Citation: Saruchi , Kumar V, Ghfar AA and Pandey S (2022) Microwave Synthesize Karaya Gum-Cu, Ni Nanoparticles Based Bionanocomposite as an Adsorbent for Malachite Green Dye: Kinetics and Thermodynamics. Front. Mater. 9:827314. doi: 10.3389/fmats.2022.827314
Received: 01 December 2021; Accepted: 17 January 2022;
Published: 17 February 2022.
Edited by:
Robert Li, City University of Hong Kong, Hong Kong SAR, ChinaReviewed by:
Khalid Z. Elwakeel, Jeddah University, Saudi ArabiaCopyright © 2022 Saruchi, Kumar, Ghfar and Pandey. This is an open-access article distributed under the terms of the Creative Commons Attribution License (CC BY). The use, distribution or reproduction in other forums is permitted, provided the original author(s) and the copyright owner(s) are credited and that the original publication in this journal is cited, in accordance with accepted academic practice. No use, distribution or reproduction is permitted which does not comply with these terms.
*Correspondence: Saruchi, c3VydWNoaW5pdGoxNUBnbWFpbC5jb20=
Disclaimer: All claims expressed in this article are solely those of the authors and do not necessarily represent those of their affiliated organizations, or those of the publisher, the editors and the reviewers. Any product that may be evaluated in this article or claim that may be made by its manufacturer is not guaranteed or endorsed by the publisher.
Research integrity at Frontiers
Learn more about the work of our research integrity team to safeguard the quality of each article we publish.