 Claudia Jimenez Martin
 Vincent K. Maes
 Turlough McMahon
 James Kratz
95% of researchers rate our articles as excellent or good
Learn more about the work of our research integrity team to safeguard the quality of each article we publish.
Find out more
ORIGINAL RESEARCH article
Front. Mater. , 01 March 2022
Sec. Mechanics of Materials
Volume 9 - 2022 | https://doi.org/10.3389/fmats.2022.825830
This article is part of the Research Topic Mechanical Testing of Composite Precursors View all 7 articles
The increased production rate targets of the aerospace industry has driven the development of dry fibre processes and biaxial Non-Crimp Fabrics (NCFs). Understanding the forming behaviour of NCFs at scale is key to achieving high quality parts at high rates. The bias extension test is commonly used to characterise the shear behaviour of dry fabrics, for example as input to drape forming models. In industry, it is still often used as a standalone material selection tool as part of initial material selection processes. It is however well known that the boundary conditions of this test are often not representative of full-scale forming trials. A direct comparison with wrinkles observed during a forming experiment is carried out to show that the bias extension test overpredicts wrinkle height. Overall, the bias extension is considered unsuitable on its own for predicting preform quality in an NCF forming process where excess length is generated due to part geometry. If the bias extension is to be used as an NCF material ranking tool, wrinkle height data should be captured alongside force shear data, as shown in this study.
As the commercial aerospace industry moves to high-rate processes for the next generation single aisle aircraft model, the need for a standardised test to select the best performing dry fabric is ever more relevant. However, the behaviour of dry fibre textiles is highly heterogenous and remains poorly understood, leading to “challenging problems trying to create reliable and repeatable methods” to investigate material properties (Bekampiene and Domskiene, 2009). The forming of the reinforcement material into the final part geometry is prone to various defects associated with the intrinsic properties of textile preforms: low out-of-plane buckling resistance, minimal extensibility in the fibre directions, low initial shear stiffness, and exponential stiffening at high angles of shear (Turk et al., 2019). In-plane shear is the dominant deformation mechanism in forming (Lomov, 2016), resulting in large rotations in the fibre direction and a change in the net shape of the material (Thompson et al., 2018).
Bench top tests such as the bias extension or picture frame test are commonly used to determine the shearing profile of the material. Together with tests in bending, compaction, and friction, they can help characterise the mechanical response of fabrics during a forming process. However, in industry the bias extension test is commonly used as a standalone material pre-selection tool before subsequent forming trials. This is why direct correlation between material performance during such tests and during forming over complex 3D geometries is of industrial interest and relevance. The bias extension is a tensile test carried out in a mechanical test frame which in theory generates uniform shear in test specimens. Two edges of a rectangular strip of material are clamped in the bias direction to the loading. The result is a non-homogenous deformation of the material sample with three regions: no shear, half-sheared and fully sheared (Montazerian et al., 2019) (see Figure 1). Limitations to this idealised behaviour arise in the form of tow slippage and out-of-plane deformations in the fabric sample.
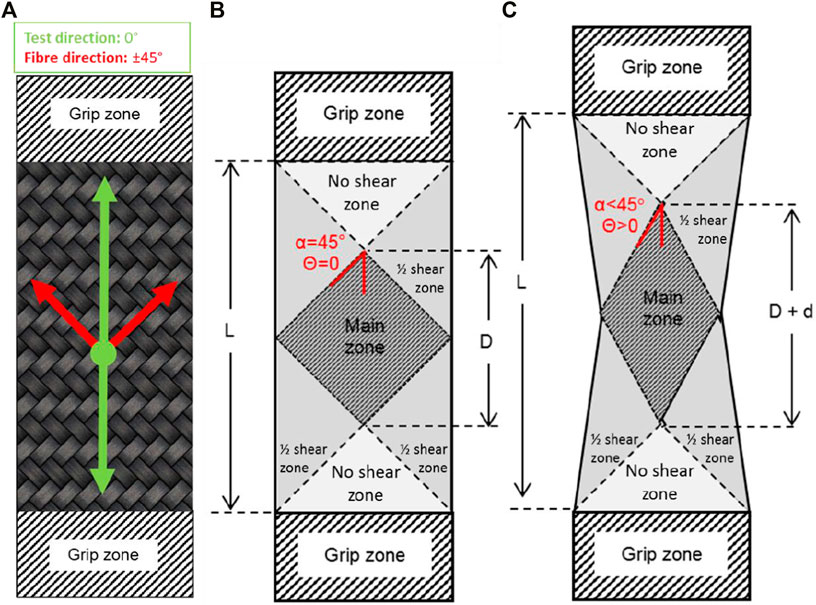
FIGURE 1. (A) fibre direction relative to load direction. (B) Undeformed specimen (C) Deformed sample during test
Non-Crimp Fabrics (NCFs) are currently being investigated as they can offer higher deposition rates for primary aerostructures than the current state of the art technologies. Due to the architecture of the fabric being stitched instead of woven, they may show higher mechanical performance than woven fabrics. However, this also affects the shear behaviour, as the “cross-over points” between tows around which rotation occurs are not present in stitched NCFs. This cannot be ignored when using tools such as the bias extension or kinematic drape solvers for predicting NCF behaviour, as both rely on Pin Jointed Net (PJN) assumption (fibre yarns are free to rotate at cross over points). As such, the suitability of the bias extension test for use on NCF fabrics has been questioned in the literature. In fact, Lomov et al. argue that the bias extension test, though widely applied to woven fabrics, should not be used for NCFs because of the asymmetry of the deformation introduced by the stitching and the difficulty to interpret results due to this (Lomov, 2016).
This study presents an experimental campaign on both bias extension and forming test set ups. 2D Digital Image Correlation (DIC) cameras were used to capture the in-plane shear behaviour of six NCF samples in the bias extension test. Using 3D DIC cameras, out-of-plane data is extracted from the bias extension trials. This is correlated to out-of-plane defects observed in the forming trials. The forming geometry is considered highly representative of a full scale aerostructure due to its size (span length is within the same order of magnitude as a full-scale structure) and the geometrical features included (ramps and radii). The analysis is complemented by a kinematic drape simulation on the forming geometry, which is used to bridge between bias extension shear and forming wrinkle results. The main research gap this study addresses is the lack of correlation between fabric behaviour observed in the bias extension versus that in representative forming trials, as illustrated in the discussion on formability provided in the next section. The geometry chosen and its comparatively larger size to most geometries used in the literature lead to an analysis that is industrially relevant. The size of the material matrix tested allows for insights into the effect of NCF architecture on fabric defects. This was used to assess the bias extension test as a material selection tool. Overall, the study is a critique on the suitability of tests like the bias extension as tools to inform material formability over large complex geometries.
Formability of fabrics over 3D complex shapes has been extensively covered in the literature (Hancock and Potter, 2006; Tanaka et al., 2014; Chen et al., 2017). However the quest to use formability as a quantitative property and metric to aid material selection still remains. Numerous studies (Haanappel et al., 2014; Hallander et al., 2015) exist that choose “representative” tooling geometries over the bias extension, discussed in this paper, to characterise material formability. This is due to the difference in loading and “boundary conditions” of the fabric in both tests. The loading on a dry fibre preform during a forming experiment is multiplanar and multidirectional compared to the unidirectional tensile test that is the bias extension. For multilayer forming, complex interactions between the fabric layers and the diaphragm also play a part. It is stipulated that wrinkles occurring in the bias extension test occur as a result of tow buckling after no more shearing and tow slipping can occur, whereas wrinkling in a preform is most likely caused by a combination of forces. Figure 2 shows the forces acting on a preform in a single diaphragm forming process over two common geometry features: a concave or female radius and a convex or male radius.
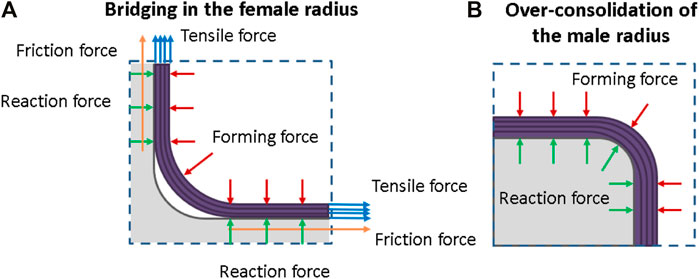
FIGURE 2. Force schematic for a female radius (A) and a male radius (B) in a single diaphragm forming set up.
There have been many approaches addressing this limitation of tests like the bias extension. Advances in the industry have gone as far as the release of an ISO standard on drapability of fabrics and non-wovens utilising TexTechno’s DRAPETEST instrument (Mason, 2021). While this shows potential for a repeatable draping test, the risk of producing data that is not actionable is present. Overall, no established link between material draping test results and manufacturing recommendations in the industry has been observed.
Formability analyses are generally limited by both size of the test geometry and size of the data set tested. Comparative studies of materials of different architectures are therefore scarcely available in the literature. Those that are published mostly focus on woven dry fabrics rather than NCFs. The reader is referred to the work of Hallander et al. (Hallander et al., 2013) presenting forming trials on a spar geometry with a flange recess area. Though a comprehensive study of material parameters over a complex shape is shown, the size of the geometry leads to questions on how transferrable the results are to full scale forming experiments. This paper avoids this limitation through the use of a large-scale geometry (2 m in span) leading to representative preform wrinkles to compare to.
Referring to studies that do use tensile tests (bias extension, picture frame), experimentation with the standard set up of material test rigs has addressed some of the limitations of these tests. Montazerian et al. (Montazerian et al., 2019) present a frameless picture frame test that helps eliminate close-to-arm fiber bending, a phenomenon which occurs near the clamped edges of the fabric specimen and introduces undesired fabric deformation. Rashid et al. (Rashidi and Milani, 2018) propose a new approach to the bias extension test by introducing biaxial tension, introducing additional forces to “dewrinkle” fabric specimens and using this as a way to parametrise the formability. The effect of sample size was investigated by Giorgio et al. for twill weave fabrics (Giorgio et al., 2018) and results showed an inverse relationship between sample size and critical values of shear angle, with larger samples wrinkling at smaller angles.
Forming prediction codes using FE model approaches are also becoming increasingly available. The reader is referred to the work of Boisse et al. (Boisse et al., 2011; Barbagallo et al., 2017; Boisse et al., 2018; Guzman-Maldonado et al., 2019). However, industry still heavily relies on kinematic drape solvers, such as those readily available in composite CAD software. This paper acknowledges this tendency and endeavours to create links between shear angles and wrinkle sizes using CATIA’s producibility tool. In fact, Boisse (Boisse et al., 2011) found that there is no direct relation between shear angle and wrinkling when simulating textile composite reinforcements over a double curved surface. Though this serves as an indication of the expected result, this paper studies this relation through a kinematic drape solver on a representative aerostructure geometry.
The methodology of this study was as follows:
1. Assess the NCF material formats tested in the bias extension against the PJN model.
2. Assess the bias extension test as a material selection tool for six material samples and six material parameters, varying one parameter at a time (see Table 1). The two criteria to assess material behaviour were force versus shear trend and maximum wrinkle height versus shear trend.
3. Assess the bias extension test against forming experiments using a kinematic drape solver to link the two. Figure 3 shows a schematic of the three test methods used (bias extension, forming and kinematic drape), the test outputs and criteria used to assess the tests as formability tools.
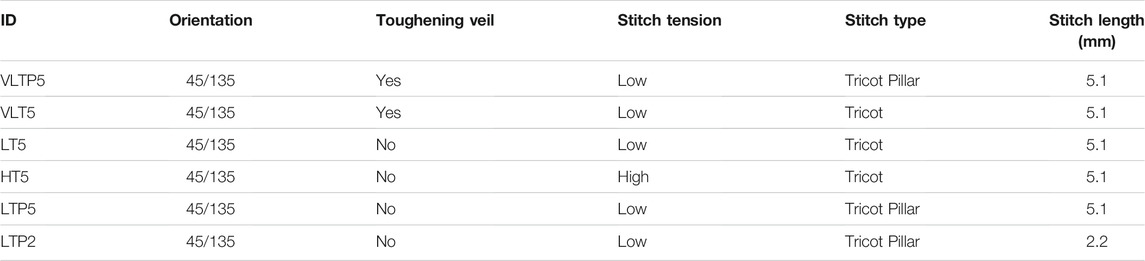
TABLE 1. Material formats tested in forming and bias extension tests, with parameter change between adjacent rows highlighted.
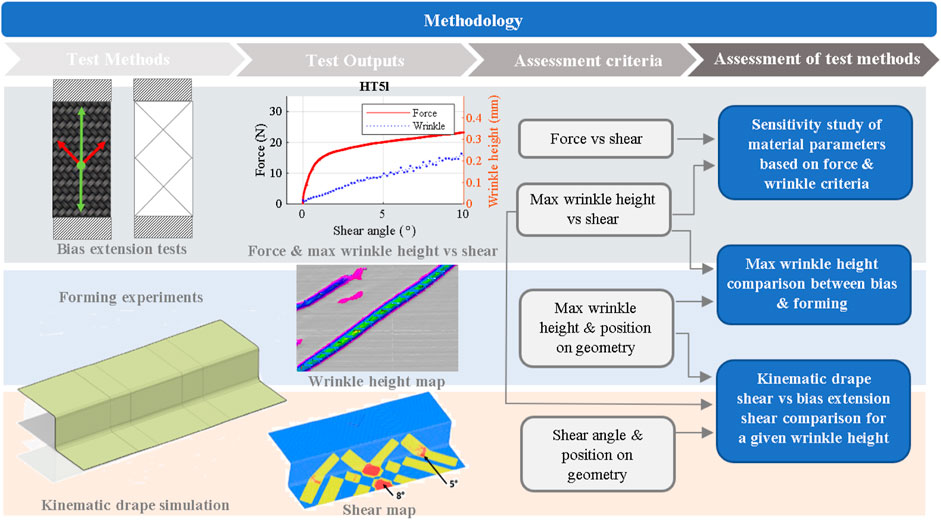
FIGURE 3. Summary schematic of methodology proposed.
Bias extension trials were carried out on six different biaxial NCFs (see Table 1), with parameters varying between stitch type (tricot, tricot-pillar and pillar), stitch length and stitch tension, as well as the addition of toughening veil or not. All samples were biaxial 45°/135° non crimp fabrics with a 536gsm areal weight and a polyamide stitching yarn with nominal areal weight of 4gsm.
A Digital Image Correlation (DIC) camera system was used to obtain the “measured shear angle” and correlate this to the force. Additionally, a two-camera 3D DIC system was deployed to obtain out-of-plane wrinkling occurring at the critical shear angles, thus providing data comparability with both the forming trials and the kinematic drape simulation. The software used was GOM Aramis compatible with the DIC hardware, using pattern recognition to track points on the sample as it deforms. The two DIC systems used were:
- iMetrum UVX Flexi–single camera system to track points in 2D. Used to measure shear angles.
- GOM ARAMIS–two camera system to track points in 3D. Used to measure out-of-plane undulation and buckling.
The test specimens were treated with mattifying spray to reduce the reflectivity of the fabric. A random speckle pattern was subsequently applied using white spray paint to improve point tracking in the DIC software. A water-based paint was chosen to avoid reaction of solvents with fabric binder. The final step was the application of a geometric pattern using a stencil. This was used to help accurately set up the test samples in the machine and as a visual aid to material deformation. Fabric samples were scanned on both sides, referred to as “stitch side” and “loop side”, where the stitch side is defined as that which shows the stitching yarn pattern. As it was only possible to capture one side at a time, a minimum of two tests were carried out per fabric sample. The test setup was an Instron 1kN load cell with a pair of adjustable grips with 150 mm × 50 mm serrated jaw faces to directly grip the samples. The samples were cut to a size of 320 mm × 110 mm, with a gauge size of 220 mm (height) x 110 mm (width) once gripped. Each test was run for 1 min at a constant crosshead displacement rate of 10 mm/min. Tests were terminated earlier if significant tow slippage or dislocation was observed on the visible face.
Firstly, the shear strain data for the six NCF formats was compared against the PJN model prediction. The shear angle equation dictated by the PJN model is as follows:
where
Under PJN assumption, the graph of measured shear versus strain is a straight line. To track the “true”| shear of the fibres in the material sample, 12 markers are placed in the “main zone” of the fibre sample (see Figure 4). 2D DIC is used to track the positions of these markers as the sample is pulled in tension. Shear is calculated separately for both fibre directions (direction 1 for +45° and direction 2 for −45°) and plotted against the PJN model. Both directions are tracked on both the stitch and loop side, though only one fibre direction is visible in each (+45° on the stitch side and −45° on the loop side). The strain was calculated by dividing the extension (crosshead displacement) by the initial sample height.
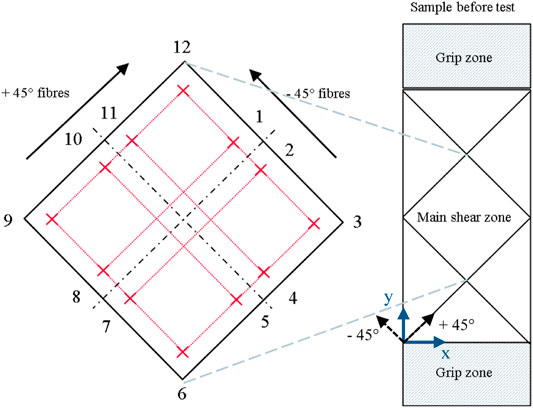
FIGURE 4. Schematic of marker positions on bias extension sample for 2D DIC tracking.
A sensitivity study was also performed. Two criteria were used to assess the effect of material parameters in the bias extension test, captured by 2D and 3D DIC respectively:
- Force vs shear curves for six material samples with one parameter change at a time (e.g., veil, no veil)
- Maximum wrinkle height vs shear curve for six material samples with one parameter change at a time, where maximum wrinkle height was the maximum value extracted from the central main shear zone at every time interval (every 10th of a second).
Forming experiments were carried out on a representative aerospace geometry shown in Figure 5. The geometry contains features such as ramps, changing web depth, and radii. The ramps have a gradient of 1:40 and recede towards the centre of the geometry creating an excess in fabric length. The footprint of the tool was 0.9 m × 1.9 m (chord x span length), a sizeable increase from any forming geometries currently available in the literature. To fix the kinematics of the diaphragm, the tool was placed in an enclosed perimeter, a “bathtub”, of footprint 3.1 m × 2 m (chord x span length). The NCF material was placed on the geometry upper surface or “skin” and left to drape over the vertical “web” and rest on the lower surface or “flange” under its own weight. The dimensions of the ply were 0.9 m × 1.5 m (chord x span length). A non-reusable diaphragm was sealed to the top edges of the “bathtub” tool and vacuum was pulled until the fabric conformed to the geometry. The preform surface was scanned while still under vacuum with a GOM Triple Scanner system and interrogated for wrinkle dimensions using Polyworks software.
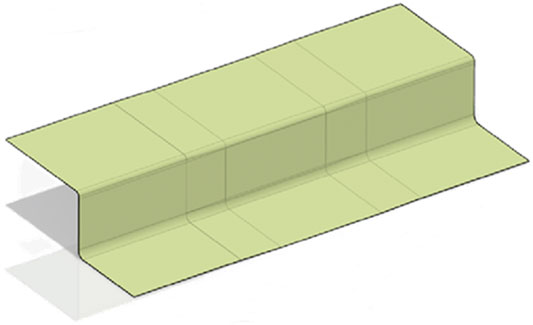
FIGURE 5. Representative geometry used for forming trials.
For this study, the CATIA producibility tool was used to predict the areas of highest fabric shear. The shear values were then allocated to wrinkle heights extracted from the forming trials. This provided a direct comparison with the wrinkle shear behaviour obtained in the bias extension tests. The analysis was run to optimise shear, with a 3 mm × 3 mm mesh size and a warning and limit angle of 2° and 4° respectively. It is important to note the warning and limit angles were purely for visualisation of the shear map and not a property associated to the material–kinematic drape simulations do not take material properties into account and assume a Pin Jointed Net behaviour of the mesh. The mesh size was selected to match the stitch size, though there is no evidence in the literature to suggest this should influence the result. The seed point was chosen to match the kinematics of the diaphragm during the forming trials performed in the bathtub set up. The models assumed a pin jointed net behaviour to produce the mesh and do not predict any out-of-plane behaviour. No material properties are used as inputs and the analysis simulated a mesh being applied to the surface and the distortion due to the geometrical features of the surface.
Shear is the main mechanism allowing woven fabrics to conform to double curvature shapes. The mechanics of shearing depend on yarn rotation at crossover points of woven textiles. In the case of non-crimp fabrics, there are no such points as the two orientations are stitched rather than woven together. Though many have stipulated the stitch to be the point of rotation for Non-Crimp Fabrics, other mechanisms such as tow sliding dominate when applying tension to a fabric sample.
The bias extension test assumes Pin Jointed Net behaviour during shearing of fabrics. If this test is to be used to predict the shear behaviour and by extension the “formability” of dry fibre NCFs, then the fabric sample should follow the PJN model. Figure 6 shows shear vs strain data for six fabric samples alongside that predicted by the PJN model. An “s” and an “l” by the fabric sample ID denominates the stitch and loop side respectively. Fabric samples were tracked in both fibre directions (+45° and −45°) and on both stitch and loop side. Only one fibre direction is visible on either side (+45° on the stitch and −45° on the loop). The second fibre direction is tracked through the diagonal markers orthogonal to the visible fibre direction.
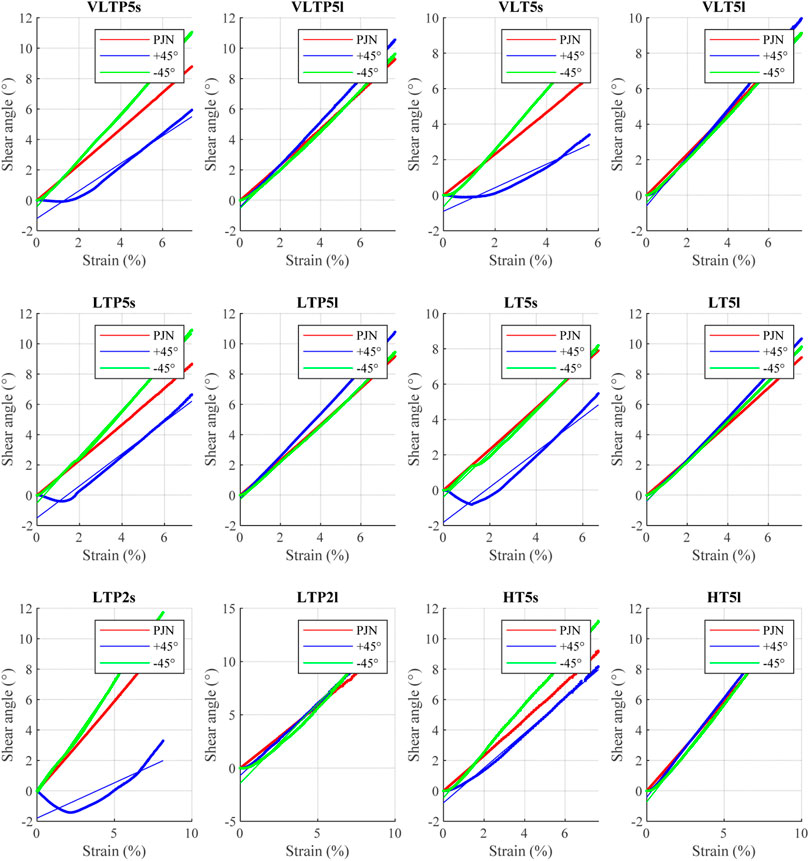
FIGURE 6. Shear vs strain plots for six NCF formats compared to PJN model, stitch and loop side, 45 and −45 fibre shear directions shown.
Results show the difference in behaviour between the two fibre directions, showing the asymmetric nature of NCFs in shear. The most noticeable deviation to the Pin Jointed Net model is observed in the +45° fibres on the stitch side of all low tension samples (all but HT5). This suggests stitch tension is a driving parameter in the shear of NCFs. The negative shear shown in the +45° fibre curves is due to an overall rotation of the free fibres in the specimen. The free fibres are those that are not constrained by the top and bottom clamps. Figure 7 shows a diagram explaining this deformation mechanism. The unconstrained fibres linked through the stitches to those constrained cause the ‘free fibre zone’ to rotate producing an initial negative shear in the +45° fibres. This phenomenon is characteristic of NCFs and strengthens the case for the PJN model being inappropriate for these materials.
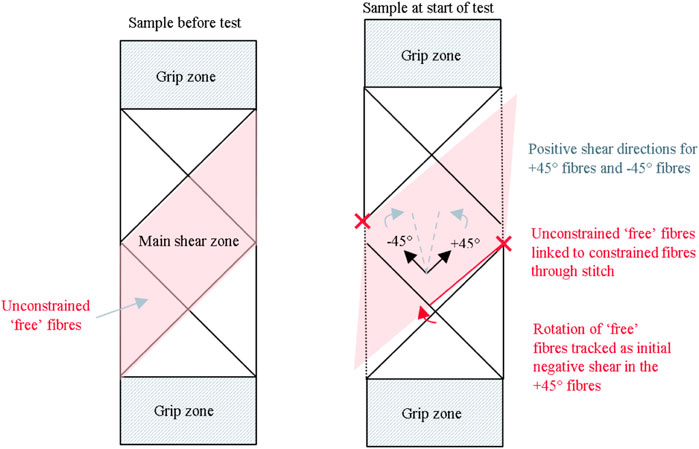
FIGURE 7. Schematic showing initial negative shear behaviour of fabric samples.
In general, the fabric loop side follows PJN more closely than the stitch side, on both fibre directions. All tricot pillar material samples deviated from PJN behaviour, with the shorter stitching showing the worst deviation. Stitch tension and stitch length can be said to be the key drivers to the shearing behaviour of NCFs, with stitch type following closely. Overall, a high tension, longer stitch length tricot pattern is preferred as it is likely to shear rather than slide, a behaviour that is easier to predict with a model such as the Pin Jointed Net.
It is recognised that the bias extension is a convenient test to observe shear behaviour of many fabric samples in a time and resource effective manner. In the context of an industrial material characterisation campaign, material quantities are much lower by comparison to a representative scale geometry (order of magnitude of metres). The rationale behind this section of the study is therefore to assess the bias extension test as a method for material selection. The sensitivity study performed shows the effect of six material parameters on the bias extension result based on two criteria: force versus shear and maximum wrinkle height versus shear. Images of the fabric specimens are also shown to support the qualitative analysis.
The force versus shear curves for the six material parameters tested are shown in Figure 8. Force versus shear is the metric that is conventionally used to observe the behaviour of a fabric sample in tensile tests like the bias extension. In all material samples an initial steep rise in force is observed with almost no shear increment. This is likely due to the tow sliding observed during visual inspection of the samples. An initial negative shear is telling of rotation of the free fibre zone as shown in Figure 7. This behaviour is observed in all low tension non veiled fabrics. It is possible that the powdered veil could add friction and therefore prevent tow rotation. The resistance to tow rotation and therefore shear provided by the veil can be seen in the form of steep force gradients after the initial rise. The effect of added veil is most noticeable in the tricot samples (LT5 and VLT5) where the non-veiled fabric plateaus at higher shear angles, implying a loss of sample stability, through tow dislocation or stitch breakage. Finally, the most noticeable force shear behaviour was that of the short stitch sample. This sample dislocated along a tow at the beginning of the test, therefore decreasing sharply the amount of force needed to achieve the constant displacement rate (10 mm/min) as the tows are free to slide along each other.
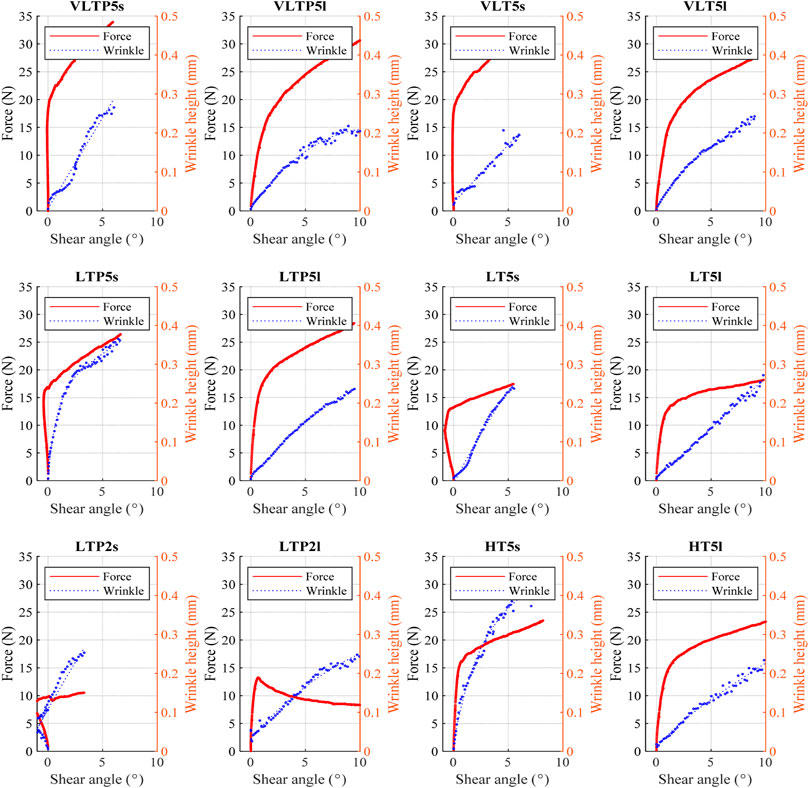
FIGURE 8. Force and wrinkle versus shear plots for six NCF formats, stitch and loop side shown.
The out-of-plane displacement in the form of wrinkle height was also captured for the sensitivity study. The maximum wrinkle height from the fabric specimen was taken at every shear angle calculated. The aim was to assess this as a metric to assess bias extension results. The first observation made is that the wrinkle shear behaviour is independent of the force shear curve, as seen in the comparison of samples VLT5 and LT5. Whereas the application of veil increases the force per unit shear required, the wrinkle shear remains similar for both samples, both in gradient and in magnitude. Equally, in samples such as LTP2 and HT5s, though the force plateaus after a dislocation of the tows, the wrinkle height continues to increase. This suggests that only extracting force shear data from bias extension tests does not give an estimate of the wrinkling behaviour of the fabric that may then occur in a forming trial.
Nevertheless, the wrinkle shear data should be complimented by visual observation of the wrinkling of the specimens. As wrinkling of dry fibre fabrics is a complex phenomenon, qualitative analysis remains key to obtaining a better understanding. Figure 9 shows the appearance of the six NCF material formats tested at approximately 25 mm of crosshead displacement. An overall difference in wrinkling behaviour is observed between the stitch and the loop side of the samples. Whereas the loop side of the fabric shows vertical wrinkling constrained by the stitching aligned in the direction of loading, the stitch side allows wrinkles to traverse across tows as well as stitches. A regular pattern is observed on samples LTP5 and HT5, with the tricot pillar material showing spacing between wrinkle “rows” where the pillar stitch is present. This suggests the wrinkle behaviour is affected by stitch architecture, where a tricot stitch produces compression of the fibres as the diagonal yarn angle changes under load. On the reverse (loop) side, this reduces the spacing between the stitches and leads to the vertical wrinkle patterns observed. Figure 10, adapted from Thompson et al. (Thompson et al., 2018) shows a tricot pillar stitch with the stipulated compression zones leading to the observed wrinkle pattern.
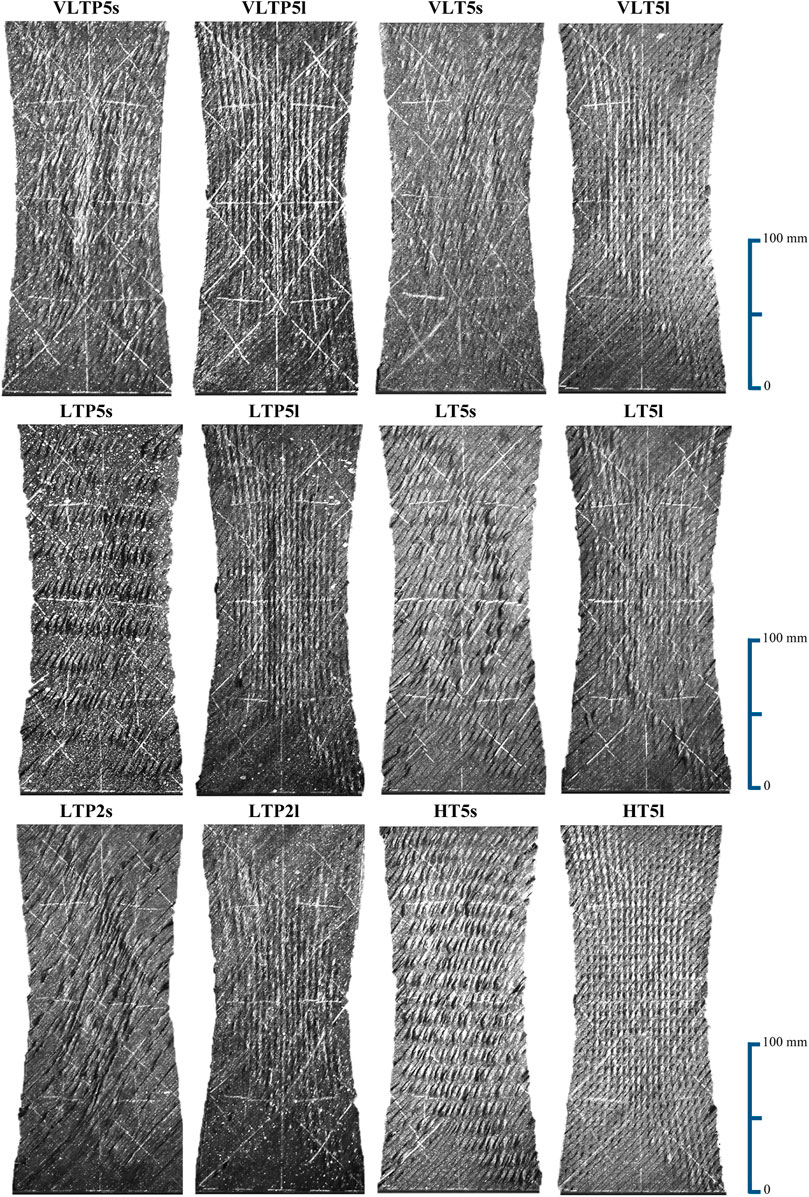
FIGURE 9. Bias extension appearance for six NCF formats, stitch and loop side shown.
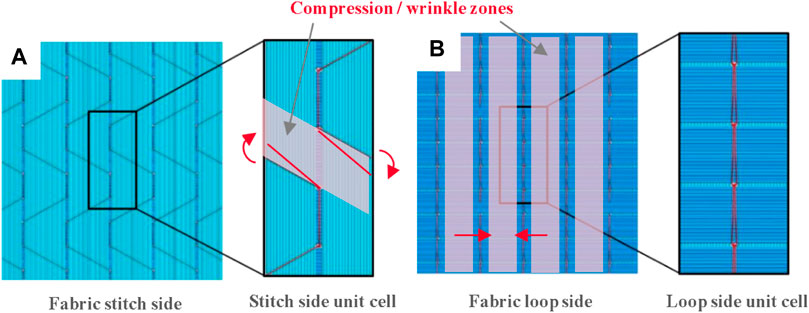
FIGURE 10. Adapted from Thompson et. al (Thompson et al., 2018) (A) stitch view of biaxial NCF (B) loop view (C) schematic of one unit cell in 3D.
When comparing numerical wrinkle data to the specimen wrinkle appearance, the two highest wrinkle specimens, LTP5s and HT5s correlate with the two worse specimens upon visual inspection. However, though the appearance of the veil specimens is better in terms of less wrinkling, this does not correlate numerically. Overall, both force versus shear and wrinkle versus shear metrics revealed key information regarding key drivers in NCF specimen behaviour. The lack of correlation between the two suggests the need for both metrics to be tracked if bias extension tests are to be carried out as a tool to inform NCF formability, where wrinkling is a key phenomenon. Qualitative assessment of wrinkling should not be bypassed to support the numerical trends extracted.
This section of the study aims to create a direct link between bias extension test results and industrial scale forming experiments, through comparison of wrinkle data. Figure 11 shows the maximum wrinkle height captured in both tests for the six material formats. Both stitch and loop side wrinkle heights are shown, captured at the end of the sample extension. Results show a higher maximum wrinkle height from the bias extension in all cases. The loop side of the sample shows better correlation with the forming results. An assumption could be made that the forming result is a net effect of both stitch and loop side, in which case an average between the two should be compared. However, this numerical comparison should be interpreted with care, as though the parameter used is the same (wrinkle height), the phenomena through which the wrinkles are produced are drastically different. The bias extension is a unidirectional tensile test, whereas forming of a fabric on a complex geometry requires a combination of tension, compression, and shear. The complex interactions between tool surface and diaphragm also play a part. In fact, the out-of-plane compression applied by a single diaphragm forming process may also aid in the resulting lower forming wrinkle heights.
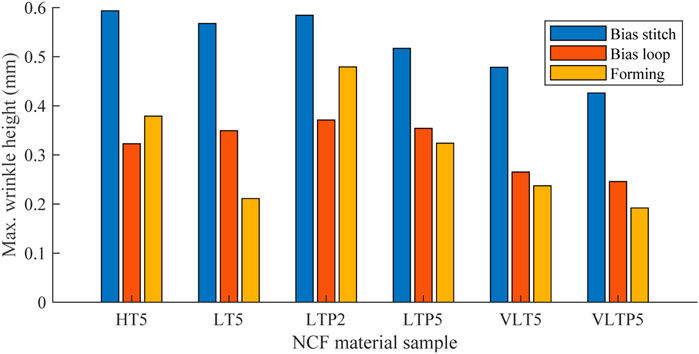
FIGURE 11. Bar chart comparing bias extension and forming maximum wrinkle height values for six NCF formats.
In the light of the complex comparison attempted between the two tests and to aid the numerical study, a qualitative assessment is once again presented. Figure 12 shows a photograph of a wrinkle caused by the ramp features on the representative geometry chosen. The wrinkle is photographed and scanned under vacuum. As seen, the wrinkle follows the direction of the ramp, as this is a geometry driven defect. No other defect is seen on the formed ply, unlike the sparsely located wrinkles on the NCF material sample. This is due to the large area of the ply (2 × 2 m), where the wrinkle is constrained by the surrounding fibres. A bias extension specimen of dimensions 220 × 110 mm is largely dominated by “edge effects”, i.e. the fibre free area highlighted in Figure 7, leading to phenomena such as tow sliding. In the close-up photograph, minimal fibre distortion or damage is observed in the out-of-plane wrinkle, whereas the bias extension allows much higher tow movement to occur leading to fibre damage. This again is observed in the forming set up once the vacuum is released, and the ply fibres “relax”.
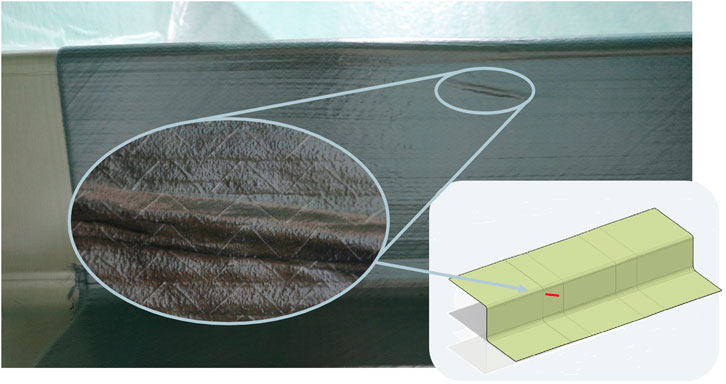
FIGURE 12. Photograph of wrinkle observed during forming trial including (A) Close up photograph of wrinkle and (B) location marked on CAD geometry.
Alongside tensile tests like the bias extension, simulation tools in the form of kinematic drape solvers are commonly used in industry to predict NCF formability. Kinematic drape solvers also rely on a PJN model to predict areas of shear based on geometric constraints. The shear predicted by the kinematic drape solver was compared to that of the bias extension, with the aim to assess them against each other as tools to predict material formability. Figure 13 shows the resultant shear map obtained for the ramp geometry used in the forming trials. The resultant map shows no shear on the top surface as this is a single curvature geometry. The web and flange both have shear zones as the mesh must overcome the radius and ramp features. The shear pattern appears to be almost symmetric due to the ramps being equal in size.
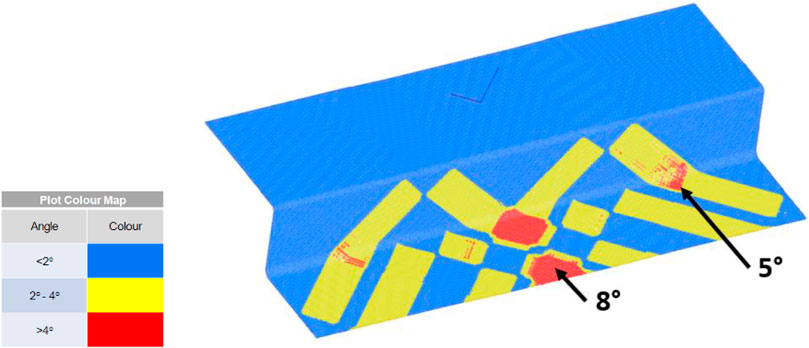
FIGURE 13. Kinematic drape model shear map on ramp geometry.
The wrinkle heights extracted from the forming experiments were assigned shear angles based on wrinkle location within the kinematic shear map. Table 2 shows the results compared to those assigned using the bias extension wrinkle shear profiles for each material. The kinematic drape model did not change for the six NCF formats, as no material properties are considered. Results show very poor correlation in terms of shear dimension, with the bias extension predicting up to ten times higher shear for the wrinkle values provided. This shows the importance of geometry in the resultant shear, as this is the main input in the kinematic drape simulation and is not accounted for in the bias extension. However, there was a general agreement between bias extension and kinematic draping in terms of ranking (VLT5 showing the lowest shear angles and HT5 the highest). The results from this analysis must be taken with care, as the inputs and boundary conditions for both tests are different, as was the case for the bias and forming trials.

TABLE 2. Comparison of shear angles predicted by the bias extension test vs kinematic drape model.
This study presented a critical analysis of the bias extension as a suitable tool to rank NCF formability. It has been stipulated in the literature that NCFs do not exhibit pure shear when tensioned in the same way woven fabrics do. The results presented in this study confirmed this by demonstrating poor correlation between the Pin Jointed Net analysis and NCF shear strain deformation. The kinematic drape simulation, though using the same PJN model, predicted much lower shearing, showing the importance of geometry in the resultant preform shear, an element that is not accounted for in the bias extension. Despite this limitation, the bias extension tests showed the existence of other predominant phenomena in NCFs such as tow slippage, which ultimately affect the force shear result.
The sensitivity study on different NCF materials showed the difference in results between the conventional force versus shear data captured in a bias extension test and the novel wrinkle height versus shear introduced in this study in terms of assessing and ranking formability of different NCF materials. The results showed the force shear data was not a good measure of the sample wrinkling behaviour, as the material parameters driving both trends are different.
Tracking wrinkle development during the bias extension test was found to give a partial indication on formability, with best performing samples showing overall lower levels of wrinkling in at scale forming trials as well. However, upon observation of wrinkle appearance in the bias extension compared to that seen in a forming experiment over a complex geometry, the fibre deformation modes were found to differ due to the vastly differing boundary conditions and sample sizes in either test. A numerical comparison showed overall higher wrinkling results predicted by the bias extension over the forming results. In order to capture the forming of NCFs at scale parts, the bias extension should be complimented by other benchtop tests that can characterise the remaining deformation modes driving preform results such as compression and bending. If the bias extension is to be used as an NCF material ranking tool, wrinkle height data should be captured alongside force shear data. In the meantime, the hunt for a standardised formability evaluation test continues.
The original contributions presented in the study are included in the article/supplementary material, further inquiries can be directed to the corresponding author.
CJ-M: Conceptualization, Methodology, Validation, Formal analysis, Investigation, Data Curation, Writing–Original Draft, Visualization. VM: Conceptualization, Formal analysis, Writing–Original Draft, Visualization. TM: Conceptualization, Resources, Writing–Review; Editing, Supervision, Funding acquisition. JK: Conceptualization, Writing–Review; Editing, Supervision.
A studentship for author CJ-M was part-supported by Airbus and author TM is employed by Airbus.
The remaining authors declare that the research was conducted in the absence of any commercial or financial relationships that could be construed as a potential conflict of interest.
All claims expressed in this article are solely those of the authors and do not necessarily represent those of their affiliated organizations, or those of the publisher, the editors, and the reviewers. Any product that may be evaluated in this article, or claim that may be made by its manufacturer, is not guaranteed or endorsed by the publisher.
This work was supported by the EPSRC Centre for Doctoral Training in Composites Manufacture (EP/L015102/1) and the Airbus Wing of Tomorrow programme, part funded by the UK’s Aerospace Technology Institute. The authors would like to thank the National Composites Centre in Bristol for test data collection, and Airbus colleagues Jon Wright, Jon Price, and Dominic Bloom for many interesting discussions on composite forming.
Barbagallo, G., Madeo, A., Morestin, F., and Boisse, P. (2017). Modelling the Deep Drawing of a 3D Woven Fabric with a Second Gradient Model. Math. Mech. Sol. 22 (11), 2165–2179. doi:10.1177/1081286516663999
Bekampiene, P., and Domskiene, J. (2009). Analysis of Fabric Specimen Aspect Ratio and Deformation Mechanism during Bias Tension. Medziagotyra 15 (2), 167–172.
Boisse, P., Colmars, J., Hamila, N., Naouar, N., and Steer, Q. (2018). Bending and Wrinkling of Composite Fiber Preforms and Prepregs. A Review and New Developments in the Draping Simulations. Compos. Part. B Eng. 141 (November), 234–249.
Boisse, P., Hamila, N., Vidal-Sallé, E., and Dumont, F. (2011). Simulation of Wrinkling during Textile Composite Reinforcement Forming. Influence of Tensile, In-Plane Shear and Bending Stiffnesses. Composites Sci. Tech. 71 (5), 683–692. doi:10.1016/j.compscitech.2011.01.011
Chen, S., McGregor, O. P. L., Endruweit, A., Elsmore, M. T., De Focatiis, D. S. A., Harper, L. T., et al. (2017). Double Diaphragm Forming Simulation for Complex Composite Structures. Composites A: Appl. Sci. Manufacturing 95, 346–358. doi:10.1016/j.compositesa.2017.01.017
Giorgio, I., Harrison, P., dell'Isola, F., Alsayednoor, J., and Turco, E. (2018). Wrinkling in Engineering Fabrics: A Comparison between Two Different Comprehensive Modelling Approaches. Proc. Math. Phys. Eng. Sci. 474, 20180063–20182216. doi:10.1098/rspa.2018.0063
Guzman-Maldonado, E., Wang, P., Hamila, N., and Boisse, P. (2019). Experimental and Numerical Analysis of Wrinkling during Forming of Multi-Layered Textile Composites. Compos. Structures 208 (April), 213–223. doi:10.1016/j.compstruct.2018.10.018
Haanappel, S. P., Ten Thije, R. H. W., Sachs, U., Rietman, B., and Akkerman, R. (2014). Formability Analyses of Uni-Directional and Textile Reinforced Thermoplastics. Composites Part A: Appl. Sci. Manufacturing 56, 80–92. doi:10.1016/j.compositesa.2013.09.009
Hallander, P., Akermo, M., Mattei, C., Petersson, M., and Nyman, T. (2013). An Experimental Study of Mechanisms behind Wrinkle Development during Forming of Composite Laminates. Composites Part A: Appl. Sci. Manufacturing 50, 54–64. doi:10.1016/j.compositesa.2013.03.013
Hallander, P., Sjölander, J., and Åkermo, M. (2015). Forming Induced Wrinkling of Composite Laminates with Mixed Ply Material Properties; an Experimental Study. Composites Part A: Appl. Sci. Manufacturing 78, 234–245. doi:10.1016/j.compositesa.2015.08.025
Hancock, S. G., and Potter, K. D. (2006). The Use of Kinematic Drape Modelling to Inform the Hand Lay-Up of Complex Composite Components Using Woven Reinforcements. Composites Part A: Appl. Sci. Manufacturing 37 (3), 413–422. doi:10.1016/j.compositesa.2005.05.044
Lomov, S. (2016). Non-Crimp Fabric Composites: Manufacturing, Properties and Applications. Sawston, UK: Woodhead Publishing.
Mason, H. (2021). ISO Standard Launched to Quantify Drapability and Deformability of Fabrics and Nonwovens. Valley Ave: Composites World.
Montazerian, H., Rashidi, A., Hoorfar, M., and Milani, A. S. (2019). A Frameless Picture Frame Test with Embedded Sensor : Mitigation of Imperfections in Shear Characterization of Woven Fabrics. Compos. Struct. 211 (November), 112–124. doi:10.1016/j.compstruct.2018.11.096
Rashidi, A., and Milani, A. S. (2018). A Multi-step Biaxial Bias Extension Test for Wrinkling/de-Wrinkling Characterization of Woven Fabrics: Towards Optimum Forming Design Guidelines. Mater. Des. 146, 273–285. doi:10.1016/j.matdes.2018.02.075
Tanaka, K., Ushiyama, R., Katayama, T., Enoki, S., and Sakamoto, H. (2014). Formability Evaluation of Carbon Fiber NCF by a Non-contact 3D Strain Measurement System and the Effects of Blank Folder Force on its Formability. WIT Trans. Built Environ. 137, 317–326. doi:10.2495/hpsm140301
Thompson, A. J., El Said, B., Belnoue, J. P.-H., and Hallett, S. R. (2018). Modelling Process Induced Deformations in 0/90 Non-crimp Fabrics at the Meso-Scale. Composites Sci. Tech. 168 (January), 104–110. doi:10.1016/j.compscitech.2018.08.029
Keywords: composite material, forming, non-crimp fabric, wrinkle, bias extension test
Citation: Jimenez Martin C, Maes VK, McMahon T and Kratz J (2022) The Role of Bias Extension Testing to Guide Forming of Non-Crimp Fabrics. Front. Mater. 9:825830. doi: 10.3389/fmats.2022.825830
Received: 30 November 2021; Accepted: 26 January 2022;
Published: 01 March 2022.
Edited by:
Stefano Mariani, Politecnico di Milano, ItalyReviewed by:
Philippe Boisse, Institut National des Sciences Appliquées de Lyon (INSA Lyon), FranceCopyright © 2022 Jimenez Martin, Maes, McMahon and Kratz. This is an open-access article distributed under the terms of the Creative Commons Attribution License (CC BY). The use, distribution or reproduction in other forums is permitted, provided the original author(s) and the copyright owner(s) are credited and that the original publication in this journal is cited, in accordance with accepted academic practice. No use, distribution or reproduction is permitted which does not comply with these terms.
*Correspondence: James Kratz, amFtZXMua3JhdHpAYnJpc3RvbC5hYy51aw==
Disclaimer: All claims expressed in this article are solely those of the authors and do not necessarily represent those of their affiliated organizations, or those of the publisher, the editors and the reviewers. Any product that may be evaluated in this article or claim that may be made by its manufacturer is not guaranteed or endorsed by the publisher.
Research integrity at Frontiers
Learn more about the work of our research integrity team to safeguard the quality of each article we publish.