 Klaus Heller
 David Colin
95% of researchers rate our articles as excellent or good
Learn more about the work of our research integrity team to safeguard the quality of each article we publish.
Find out more
ORIGINAL RESEARCH article
Front. Mater. , 16 May 2022
Sec. Mechanics of Materials
Volume 9 - 2022 | https://doi.org/10.3389/fmats.2022.825809
This article is part of the Research Topic Mechanical Testing of Composite Precursors View all 7 articles
In automated fiber placement (AFP), knowledge about the interaction between material properties and process parameters is essential to achieve cost-efficient manufacturing. Both, lay-up rate and defects are dependent on the properties of the uncured prepreg tapes which are out-time dependent. However, information thereof is not given in data sheets and there are no standardized test methods. To quantify the changes of the material properties, we conducted experiments on mechanical properties and tack with IM7/8552 up to 15 days out-time using previously evaluated test methods. Furthermore, we carried out AFP lay-up trials to quantify the effects on steering defects. The results for the mechanical properties reveal a non-linear increase of the shear modulus and the transverse tensile modulus and a strong correlation to the test temperature. Results from the probe tack tests show a strong dependence on out-time at 20°C and a weak dependence at 40°C. Results from a novel peel tack test method and the lay-up trials revealed a monotonous change as a function of out-time. In both cases, we identified the lay-up rate and the infrared (IR) emitter power as the process parameters with the largest influence. The obtained results present an overall view of the material behavior depending on different test and process parameters as a function of out-time. By this, they help optimize the AFP process parameters and serve as input for material models and AFP defect models.
Composite materials contribute to a sustainable aviation by means of their high weight-specific mechanical properties which enable a lighter, more fuel-efficient aircraft design (Timmis et al., 2015). The emissions during flight are the largest source of environmental impact (Timmis et al., 2015), however, all stages of an aircraft’s life cycle—from production to end of life—have to be considered to minimize its negative effects. Structural composite aerospace parts are commonly manufactured using pre-impregnated carbon fibers (prepreg) as precursors which comprise carbon fibers impregnated with an uncured epoxy resin (Lengsfeld et al., 2016). Even though resource efficiency has been the goal for aerospace manufacturing for several decades (Argüelles et al., 2001), the two biggest aircraft manufacturers, Airbus and Boeing, and their supply chain generate about 1000 t of cured and uncured carbon fiber prepreg waste each year (Biron and Kidlington, 2020). To maximize the resource efficiency, manufacturing processes with a low scrap rate like automated fiber placement (AFP) should be used preferably (Hagnell and Åkermo 2015). Yet, larger amounts of uncured prepreg might be scrapped as the material properties change during processing due to storage at elevated temperatures (out-time). Because of the ongoing cross-linking process in the resin above its glass transition temperature (
The mechanical properties used in AFP defect prediction models include the tensile modulus
Maximum material usage and optimized processing during AFP can only be achieved with an extensive knowledge of the out-time effects on the material properties and their implications for lay-up quality. To quantify these effects and to correlate them to the occurrence of lay-up defects, we conducted a series of experiments with varying test and process parameters respectively using previously evaluated test methods. The material we used was HexPly IM7/8552 in several different conditions—1, 5, 10, and 15 days out-time. The experiments include tack measurements with two different principles,
This paper describes the experimental methods we used in the section Materials and Methods. The results for each property and for the steering evaluation are presented in the section Results while the implications for material usage, AFP processing, and defect prediction are covered in the section Discussion.
We used aerospace grade unidirectional (UD) HexPly IM7/8552 prepreg in all experiments. According to the data sheet, the tack life—time at room temperature during which prepreg retains enough tack for easy component lay-up—of 8552 is 10 days (Hexcel Corporation 2020). The fiber areal weight was 134 g/m2 and the nominal cured ply thickness was 0.131 mm. For the lay-up trials and the peel tests, we used slit-tapes with a width of 1/8” (3.175 mm) as it was predetermined by the AFP machine configuration. For the other experiments, specimens were cut from a wider roll. Wherever we needed multi-layer specimens (
To correlate the out-time to a measurable material condition, we determined the glass transition temperature
where
The probe tack test has been used by several authors for the determination of prepreg tack either using a universal testing machine (UTM) (Ahn et al., 1992b; Ahn et al., 1992a; Dubois et al., 2010; Grunenfelder and Nutt 2011; Gillanders et al., 1981; Putnam et al., 1995; Hayes et al., 1996; Buehler and Seferis 2000) or a rheometer (Budelmann et al., 2019; Andrade Raponi et al., 2020; Wohl et al., 2017; Forghani et al., 2018; Smith et al., 2019) for force application and measurement and it serves as an input for defect prediction models (Belhaj and Hojjati 2018; Forghani et al., 2018; Bakhshi and Hojjati 2018, 2019). We chose rheometer measurements as it allows for an accurate force and temperature control and expected measured forces are comparably low. All measurements were done using an Anton Parr MCR 302 rheometer. The general experimental procedure was adopted from Budelmann et al.’s publication (Budelmann et al., 2019). The test procedure comprises the compaction phase, where the probe is pressed onto the specimen, the relaxation phase, and the measurement phase, where the probe is pulled away from the specimen and the counteracting force is measured. The test preparation—see Figure 1A — includes placing the specimen (size: 30 mm
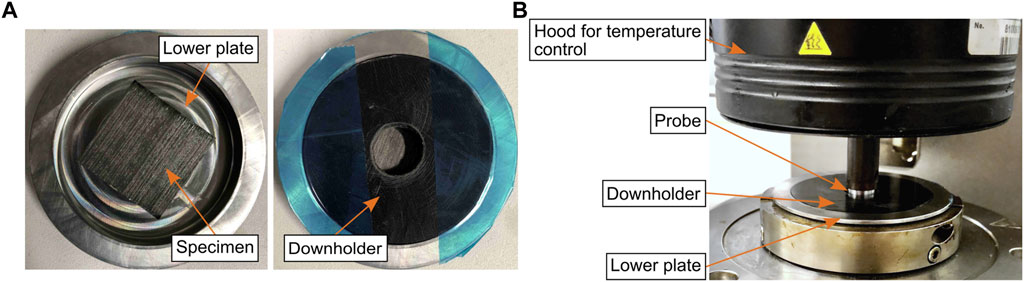
FIGURE 1. Probe tack test—experimental setup. (A): Specimen in lower plate. (B): Setup in rheometer.
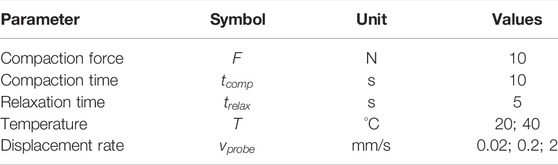
TABLE 1. Probe tack test—test parameters.
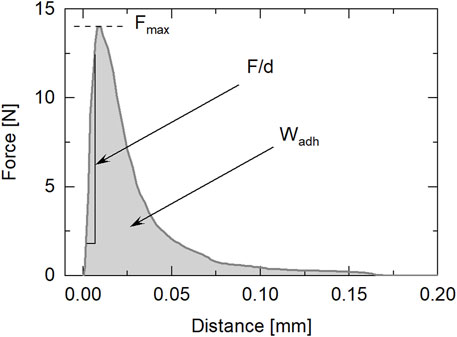
FIGURE 2. Probe tack test—readings.
We considered peel tests as a complementary test method to the probe tack test method since peel tests allow for a better relation to the peel mechanisms in automated lay-up processes (Crossley et al., 2012). In a previous publication (Heller et al., 2020b), we presented a novel peel tack test for prepreg tapes which is incorporated in a standalone test bench—see Figure 3. Since specimen preparation and peel test are decoupled, the influence of the lay-up rate on tack can be measured independently of the peel rate. Furthermore, the specimens can be prepared directly with the AFP machine—see Figure 3B—so that AFP process parameters can be adjusted directly. By this, we were able to use the exact same process parameters for the peel test specimens as for the lay-up trials. The AFP machine we used is a CORIOLIS GROUP SAS (Queven, France) machine which processes up to eight slit-tapes with a width of 1/8” (3.175 mm). Its maximum compaction force is 500 N which is applied onto the compaction roller via the pneumatic system of the lay-up head. The compaction roller is a silicone roller with Perfluoroalkoxy (PFA) coating with a diameter of 40 mm and a width of 30 mm. The deviation in pressure distribution along the width of the roller is ±5%. The heat source is an infrared (IR) emitter with a maximum power of 430 W and a nominal heated area of 40 mm width and 23 mm length ensuring a homogeneous distribution of heat along the width of the tapes. The IR emitter is mounted 60 mm above the substrate and is tilted 20° with respect to the substrate. Based on experiences from preliminary lay-up trials, we defined the parameters listed in Table 2. As the lay-up rate is expected to have a significant influence on the peel tack and the steering defects, we defined three levels. Preliminary experiments showed that defects occur at 0.1 m/s depending on the material properties and the lay-up trajectory. To investigate to which extent a reduction of lay-up rate would reduce defects, we defined 0.06 m/s and 0.03 m/s as the other values. For the compaction force and the IR emitter power, we defined two levels within the general operating range of the used AFP machine. The experimental design was a one-factor-at-a-time design with
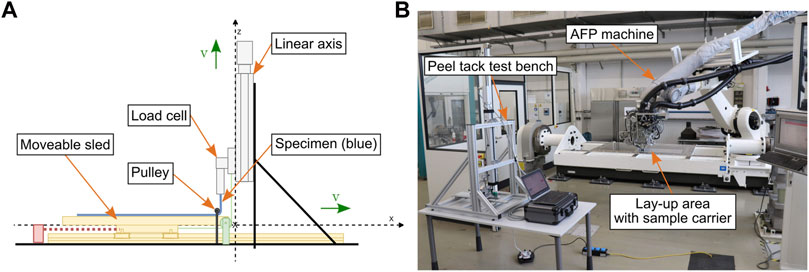
FIGURE 3. TUM peel tack test. (A) Peel test principle (Heller et al. 2020b). (B) Test bench next to AFP machine.
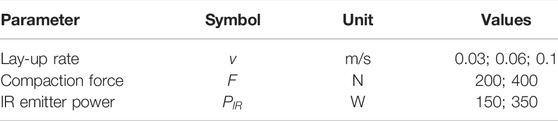
TABLE 2. AFP process parameters for lay-up trials and peel tests.
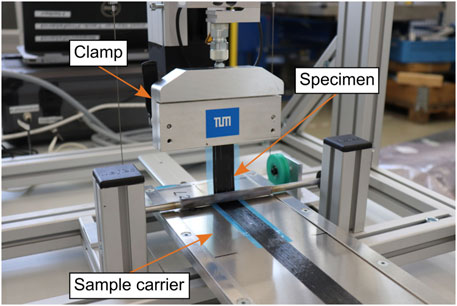
FIGURE 4. Peel tack test—clamped specimen.
Being an input parameter for AFP defect prediction models, we evaluated the influence of transverse tensile modulus changes due to out-time on AFP processing. We conducted transverse tensile measurements in the same manner as Margossian et al. (Margossian et al., 2016) using a TA Instruments Q800 DMA with a constant loading rate. To obtain the desired specimen thickness of 1 mm (length: 23 mm, width: 6.5 mm), we compacted seven layers of the material. The test parameters for the full factorial experimental design are stated in Table 3. We set the test temperatures to 20°C and 40°C covering the relevant range for TS-AFP and applied two different loading rates to investigate their influence on the transverse tensile modulus
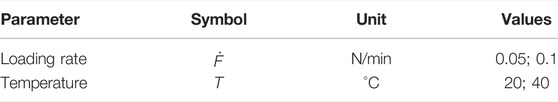
TABLE 3. Transverse tensile modulus—test parameters.
The second mechanical property which is an input parameter for AFP defect prediction models and is affected by out-time is the in-plane shear modulus
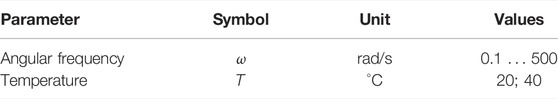
TABLE 4. In-plane shear modulus—test parameters.
We used AFP steering experiments as a quality criterion for the material process interaction. During steering—lay-up along non-geodesic paths, defects like in-plane waviness, out-of-plane buckling, and tape pull-up occur. These defects are affected by the material properties and the process parameters (Lukaszewicz et al., 2012; Hörmann 2015). A previous study (Heller et al., 2018) has demonstrated that steering induced defects change due to out-time. The dependence on out-time in combination with varying process parameters, however, has not yet been investigated. Furthermore, the occurrence of lay-up defects has not yet been correlated to the material changes due to out-time. In the experiments, we kept the steering radius constant (600 mm, arc length: 400 mm) and varied the process parameters in the same one-factor-at-a-time experimental design as the peel tests—see Table 2. We processed single slit-tapes and used an aluminium plate as substrate—see Figure 5A. The out-of-plane buckling is the local separation of the steered tape from the substrate at the inner edge due to excessive compressive forces, the tape pull-up is the local separation of the steered tape from the substrate at the outer edge due to excessive tensile forces, and the in-plane waviness is the in-plane fiber undulation due to compressive forces (Lukaszewicz et al., 2012; Hörmann 2015). Since the latter is considered an initial defect (Hörmann 2015), we only evaluated the former two which are the eventual defects—see Figure 5B. We measured the length of buckles and pull-up 40 min after lay-up since preceding observations as well as studies by other authors (Bakhshi and Hojjati 2019; Rajan et al., 2019) revealed that buckle formation is time-dependent—in this case up to 40 min. The measurement method comprises marking the buckle and pull-up length at the measuring time, taking photographs from above, and digitally measuring the lengths in relation to a reference length (graph paper). As several defects occurred per tape, we cumulated the buckle length and the pull-up length for each tape. For the result presentation, we defined the results in positive expressions: relative buckle-free length
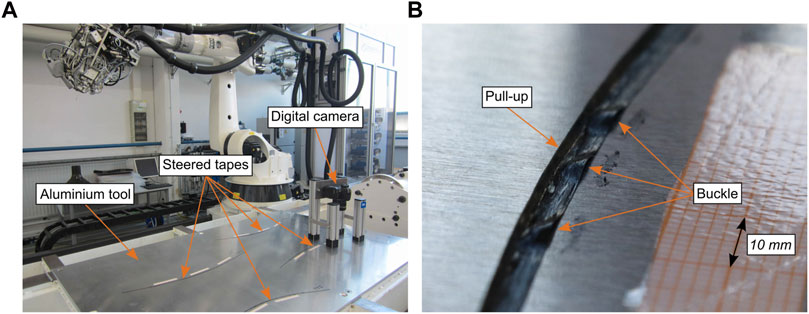
FIGURE 5. Steering experiments. (A) Steered tapes and digital camera. (B) Pull-up and buckles.
During later stages of out-time, several tapes did not adhere at all. To account for these defects, we considered them as both buckle and pull-up.
In the presentation of the results, we focus on the mean values of each individual result to increase the readability of the graphs. A considerable scatter was present during most measurements with single-layer specimens—probe tack, peel tack, AFP lay-up trials. Prepreg tapes exhibit a local variability in properties like resin content (Lukaszewicz and Potter 2011) which directly influences the scattering of the aforementioned tack-related measurements. For specimens prepared via AFP, there is a second source of variability: it cannot be controlled which prepreg side is in contact with the substrate since the narrow tapes can be twisted at several locations of the AFP machine’s material feed. As the prepreg side plays a significant role for resin distribution and tack (Endruweit et al., 2018), it will affect the peel tack of AFP specimens as well as the steering results. The additional data mean values, standard deviations, minima, and maxima of the relevant test series are listed in the Appendix.
The results for glass transition temperature
with
with
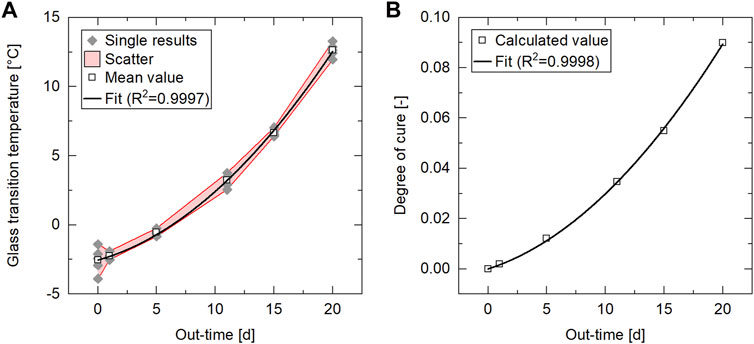
FIGURE 6. Cure-related properties as a function of out-time from DSC runs at 10 K/min (Material: IM7/8552 prepreg; out-time: 1 day 20 days at
Using these results, any
Figure 7A gives an overview of the mean values of the probe tack results for the maximum force per area
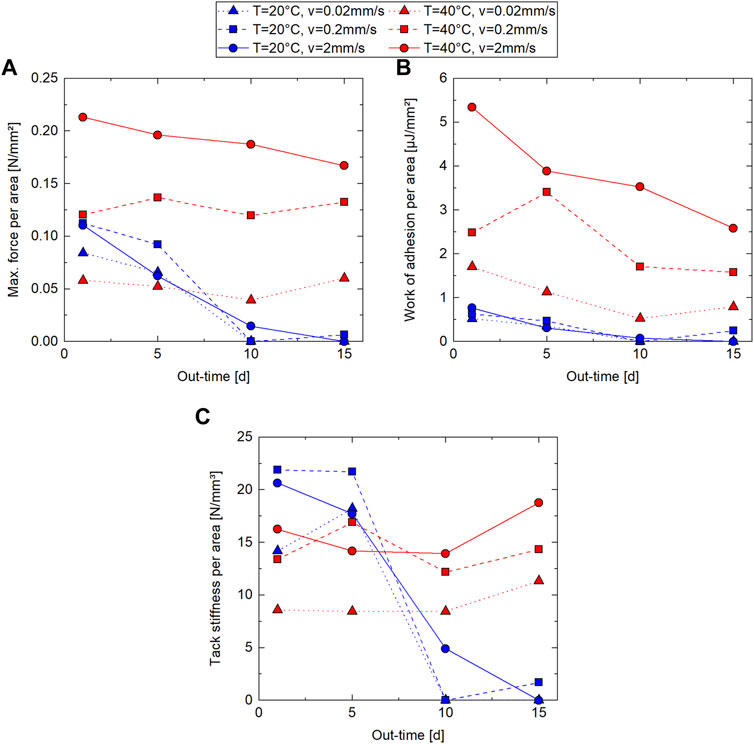
FIGURE 7. Probe tack results as a function of out-time from rheometer probe tack tests (Material: IM7/8552 prepreg; out-time: 1 day–15 days at
At the high test temperature,
Figure 7B shows the probe tack results for the work of adhesion per area
The probe tack results for the tack stiffness
Figure 8 presents the peel tack results from five measurements each. Additional data is listed in Supplementary Table SA11. The mean standard deviation was 1.95 mN/mm. In all process parameter settings, the peel tack decreased monotonously as a function of out-time which, again, is explained by the increase in viscosity leading to a poor surface wetting. The process parameter lay-up rate evidently influences the peel tack: at 1day and 15 days out-time, a lower lay-up rate leads to a higher peel tack. At 5 days and 10 days out-time, the middle rate (
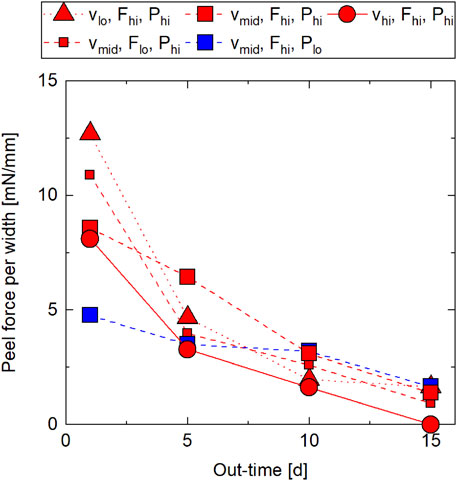
FIGURE 8. Peel tack results as a function of out-time from TUM peel tack tests (Material: IM7/8552 prepreg; out-time: 1 day–15 days at
Figure 9 shows the results for the transverse tensile modulus
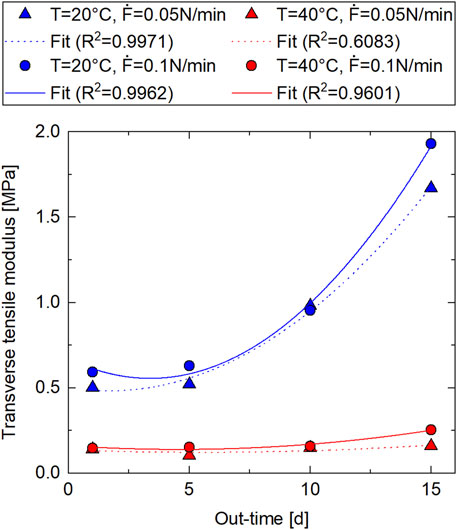
FIGURE 9. Transverse tensile modulus results as a function of out-time from DMA transverse tensile tests (Material: IM7/8552 prepreg; out-time: 1 day–15 days at
The parameters of the fits and the coefficients of determination are listed in Table 5.
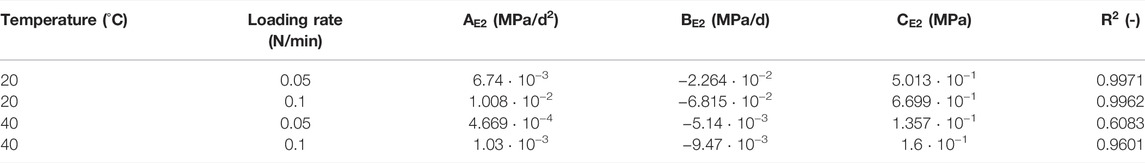
TABLE 5. Transverse tensile modulus—parameters of fits.
The coefficients of determination are rather high — 0.9971, 0.9962, and 0.9601 — except for E2(T = 40°C,
The in-plane shear modulus results from five measurements each are depicted in Figure 10. The values were calculated at shear rates of 0.001, 0.005, and 0.01 s−1. The in-plane shear modulus
while at
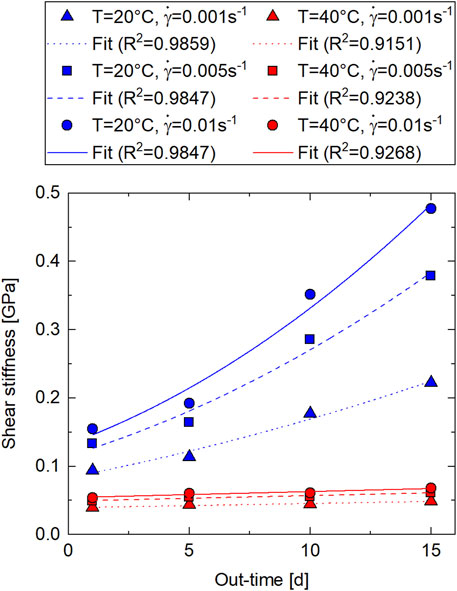
FIGURE 10. In-plane shear modulus results as a function of out-time from rheometer torsion bar tests (Material: IM7/8552 prepreg; out-time: 1 day–15 days at
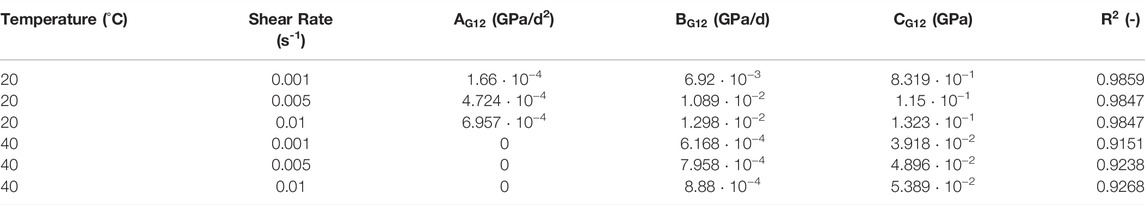
TABLE 6. In-plane shear modulus—parameters of fits.
Figure 11 gives an overview of the results of the occurrence of buckles during steering from five measurements each. Additional data is listed in Supplementary Table SA13. The mean standard deviation was 0.11. On average, there were buckles in every out-time and process parameter setting. The setting with the least buckling was
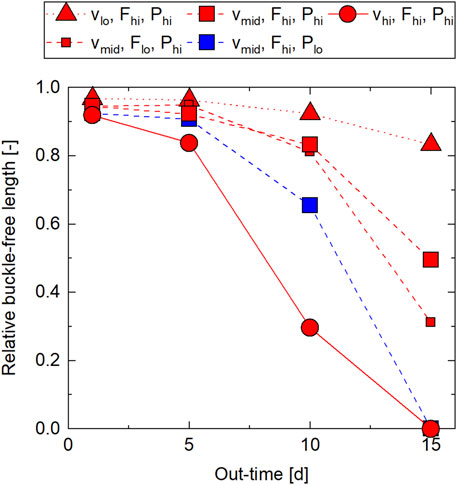
FIGURE 11. Steering results—out-of-plane buckles as a function of out-time from AFP lay-up experiments at steering radius
Figure 12 shows the results of the occurrence of tape pull-up during steering from the same five measurements each as the out-of-plane buckle measurements. Additional data is listed in Supplementary Table SA13. The mean standard deviation was 0.17. Tape pull-up occurred either once per tape—with varying length—or not at all. The dependence of the relative pull-up-free length on process parameters and out-time is quite similar to the case of the buckle-free length. The pull-up-free length remained almost the same from 1 to 5 days out-time in most setting and even increased at
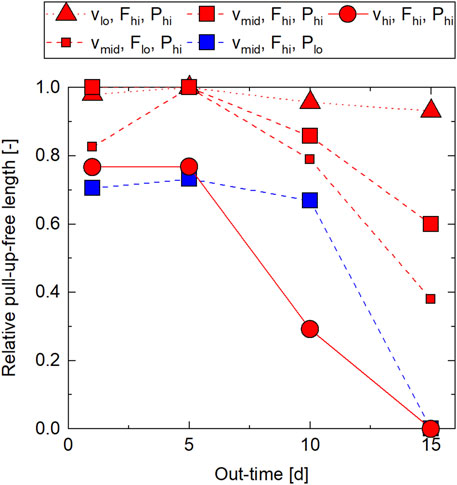
FIGURE 12. Steering results—tape pull-up as a function of out-time from AFP lay-up experiments at steering radius
To further understand the impacts of the test/process parameters to account for out-time effects, we determined the Pearson correlation coefficient as per (Rousseau et al., 2018) for the presented experiments using the single values of each experiment. The Pearson correlation coefficient
Figure 13 shows the correlation coefficients for the mechanical properties
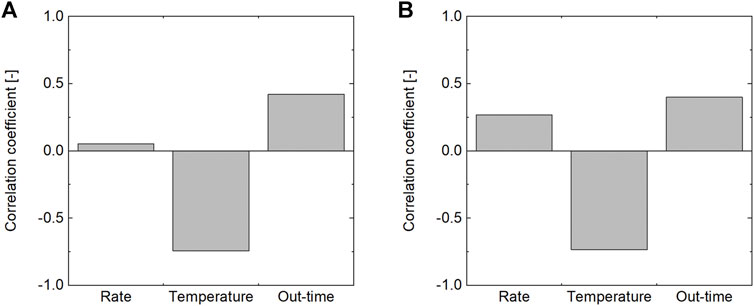
FIGURE 13. Correlation coefficient of mechanical properties of uncured IM7/8552 prepreg. (A) Transverse tensile modulus. (B) In-plane shear modulus.
The correlation coefficients for the probe tack results are depicted in Figure 14A. Here, the correlation coefficients differ for each reading. While the maximum force and the work of adhesion have a similar maximum correlation to the temperature followed by the rate, the tack stiffness has a weaker correlation to the test parameters and a stronger correlation to the out-time. As the tack stiffness is assumed to be influenced by the elastic component of the viscoelastic material behavior, apparent stiffening effects due to out-time may be more significant than for the other readings. The rate dependence of all three readings is a result of the viscoelastic behavior. Implications for AFP processing are, however, difficult to derive, as the debonding rate during AFP lay-up is difficult to estimate and it is highly dependent on the type of defect (Budelmann et al., 2019). In contrast, implications for AFP processing from the temperature dependence observed in probe tack tests are more straightforward. As discussed in Section 3.2, at prolonged out-times, the higher test temperature led to a higher tack implying that a temperature increase—within the investigated range—can be used to increase tack at these out-times.
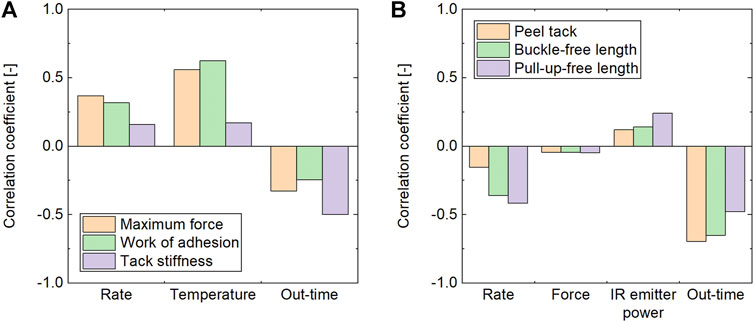
FIGURE 14. Correlation coefficient of tack and lay-up related results of uncured IM7/8552 prepreg. (A) Probe tack. (B) Peel tack, buckles, and pull-up.
Figure 14B combines the correlation coefficients for the lay-up defects with the ones for the peel tack. Since we used the same material, machine, and process parameters in both experiments, we can compare the correlation coefficients directly. The general trend of the correlation coefficients is quite similar for all three results. There is almost no correlation of the compaction force with the lay-up defects and the peel tack. The strongest process parameter correlation for all three results is the lay-up rate followed by the IR emitter power. This demonstrates that the lay-up rate can be used as the main process parameter to reduce the occurrence of steering induced lay-up defects. As implied by the steering defect results—Figures 11, 12, reducing the lay-up rate leads to a lay-up with very little defects even at 10 days out-time while increasing the lay-up rate significantly worsens the lay-up result. Since reducing the lay-up rate decreases the productivity of the manufacturing process, an increase in IR emitter power should be considered, too, as a countermeasure for defect occurrence. The strongest correlation coefficient evident in Figure 14B is between the out-time and the three results—peel tack, buckle, pull-up. This underlines the importance of the consideration of out-time effects on AFP processing. Another aspect that our results unfold, is the direct relation of steering defect results to the peel tack which is possible as the material, the machine, and the process parameters are the same in the AFP lay-up trials and the peel tack test. The comparison is illustrated in Figure 15 where the defect-free lengths are shown as a function of peel tack. The data points demonstrate that there is a correlation between relative buckle-free length and peel tack. In the peel tack range from 12.7 to 3.5 mN/mm, the buckle-free length decreases only slightly from 0.968 to 0.907. Below a peel tack of 3.5 mN/mm, the buckle-free length begins to drop significantly, indicating that this value marks a critical value for the magnitude of buckle occurrence (without considering other material properties) in the investigated case. The relation between relative pull-up-free length and peel tack is less clear—see Figure 15B. In the peel tack range from 12.7 to 1.6 mN/mm, the pull-up-free length ranges from 1 to 0.669 and drops off at lower peel tack values mainly due to the tapes not adhering at all. Yet, the findings from Figure 15 underline that peel tack measurements are a useful indicator to experimentally predict the lay-up behavior during AFP processing with a particular correlation to out-of-plane buckles during steering.
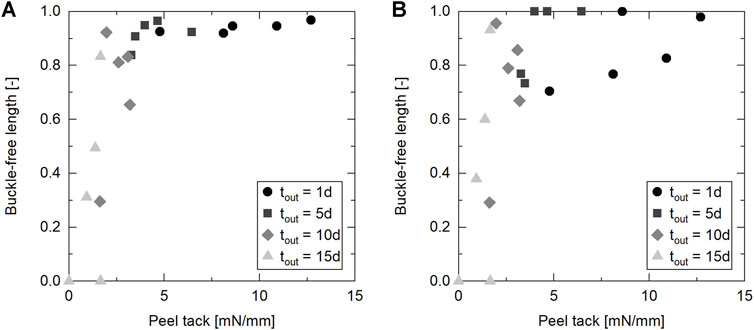
FIGURE 15. Steering induced defects as a function of peel tack of uncured IM7/8552. (A) Out-of-plane buckles. (B) Tape pull-up.
To estimate the impact of mechanical and probe tack properties on the lay-up behavior, we put our material data in an existing analytical model for the prediction of out-of-plane buckles presented by Bakhshi and Hojjati (Bakhshi and Hojjati 2019) which is the latest of a series of analytical model for steering (Beakou et al., 2011; Hörmann 2015; Matveev et al., 2016; Belhaj and Hojjati 2018). For this, we used the minimum and maximum values of each measured property—transverse tensile modulus
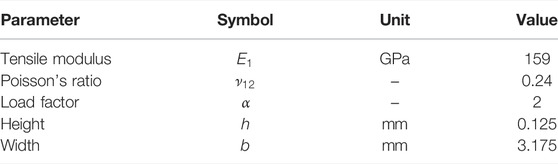
TABLE 7. Buckling model—unchanged input parameters.
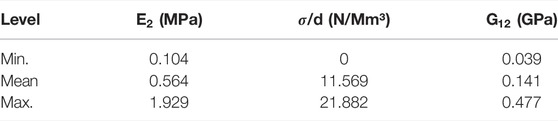
TABLE 8. Buckling model—varied input parameters.
AFP-related material properties of uncured prepreg tapes are strongly affected by the material’s out-time. These material changes, in turn, significantly affect the occurrence of lay-up defects during steering. The mechanical properties transverse tensile modulus and in-plane shear modulus increase as a function of out-time following a second order polynomial fit and the most influential test parameter is the temperature. According to calculations with a defect prediction model, the in-plane shear modulus considerably affects the out-of-plane buckling while the transverse tensile modulus’ influence is negligible within the observed range. Furthermore, the model underlines the influence of tack on buckling. Experimental results from probe tack measurements revealed a sharp drop in tack after 10 days out-time (which equals the tack life specified by the manufacturer) at the lower test temperature. Yet, the probe tack at higher out-times may be increased by applying a higher temperature. By means of a novel peel tack test, we were able to correlate the material’s tack directly to AFP process parameters. The peel tack results displayed a strong correlation to defects during AFP lay-up trials underlining that they can be used to predict the lay-up behavior. The variation of AFP process parameters demonstrated that the lay-up rate has the largest influence on both the peel tack and the occurrence of out-of-plane steering defects followed by the IR emitter power. Decreasing the lay-up rate is therefore the first countermeasure to reduce lay-up defects at high out-times and by that increase the material usage. Since we evaluated an easily accessible reference value—the glass transition temperature
The raw data supporting the conclusion of this article will be made available by the authors, without undue reservation.
KH conducted the investigation, acquired the data, formally analyzed the data, defined the methodology, and wrote the first draft of the manuscript. DC contributed to the formal analysis of data and to the methodology definition. KD supervised the work. All authors contributed to the conceptualization, the manuscript revision, read, and approved the submitted version.
Part of the present work was funded by the German Federal Ministry for Economic Affairs and Energy under the project “Thermisch-elektrisch optimierte Luftfahrtantriebssysteme (TELOS)” (No. 20Y1516F). The open access publication fee was funded by the TUM Publishing Fund.
The authors declare that the research was conducted in the absence of any commercial or financial relationships that could be construed as a potential conflict of interest.
All claims expressed in this article are solely those of the authors and do not necessarily represent those of their affiliated organizations, or those of the publisher, the editors and the reviewers. Any product that may be evaluated in this article, or claim that may be made by its manufacturer, is not guaranteed or endorsed by the publisher.
David de Haes and Juan Ramón Torresano Gómez are recognized for conducting part of the experiments.
The Supplementary Material for this article can be found online at: https://www.frontiersin.org/articles/10.3389/fmats.2022.825809/full#supplementary-material
Ahn, K. J., Peterson, L., Seferis, J. C., Nowacki, D., and Zachmann, H. G. (1992a). Prepreg Aging in Relation to Tack. J. Appl. Polym. Sci. 45 (3), 399–406. doi:10.1002/app.1992.070450304
Ahn, K. J., Seferis, J. C., Pelton, T., and Wilhelm, M. (1992b). Analysis and Characterization of Prepreg Tack. Polym. Compos. 13 (3), 197–206. doi:10.1002/pc.750130308
Argüelles, P., Bischoff, M., Busquin, P., Droste, B. A. C., Evans, R., Kröll, W., et al. (2001). European Aeronautics: A Vision for 2020, Meeting Society's Needs and Winning Global Leadership. Luxembourg: Office for Official Publications of the European Communities.
Bakhshi, N., and Hojjati, M. (2018). An Experimental and Simulative Study on the Defects Appeared during Tow Steering in Automated Fiber Placement. Compos. Part A Appl. Sci. Manuf. 113, 122–131. doi:10.1016/j.compositesa.2018.07.031
Bakhshi, N., and Hojjati, M. (2019). Time-dependent Wrinkle Formation during Tow Steering in Automated Fiber Placement. Compos. Part B Eng. 165, 586–593. doi:10.1016/j.compositesb.2019.02.034
Banks, R., Mouritz, A. P., John, S., Coman, F., and Paton, R. (2004). Development of a New Structural Prepreg: Characterisation of Handling, Drape and Tack Properties. Compos. Struct. 66 (1-4), 169–174. doi:10.1016/j.compstruct.2004.04.034
Beakou, A., Cano, M., Le Cam, J.-B., and Verney, V. (2011). Modelling Slit Tape Buckling during Automated Prepreg Manufacturing: A Local Approach. Compos. Struct. 93 (10), 2628–2635. doi:10.1016/j.compstruct.2011.04.030
Belhaj, M., and Hojjati, M. (2018). Wrinkle Formation during Steering in Automated Fiber Placement: Modeling and Experimental Verification. J. Reinf. Plastics Compos. 37 (6), 396–409. doi:10.1177/0731684417752872
Biron, M. (2020). “A Practical Guide to Plastics Sustainability,” in Concept, Solutions, and Implementation. Editor O. Kidlington (Cambridge, MA: William Andrew, Applied Science Publishers (Plastics design library).
Blass, D., Kreling, S., and Dilger, K. (2017). The Impact of Prepreg Aging on its Processability and the Postcure Mechanical Properties of Epoxy-Based Carbon-Fiber Reinforced Plastics. Proc. Institution Mech. Eng. Part L J. Mater. Des. Appl. 231 (1-2), 62–72. doi:10.1177/1464420716665413
Böckl, B., Jetten, C., Heller, K., Ebel, C., and Drechsler, K. (2018). “Online Monitoring System for the Tack of Prepreg Slit Tapes Used in Automated Fiber Placement,” in ECCM 2018 - 18th European Conference on Composite Materials, 24-28th June 2018, Athens, Greece (Athens, Greece: European Society for Composite Materials: Applied Mechanics Laboratory).
Budelmann, D., Detampel, H., Schmidt, C., and Meiners, D. (2019). Interaction of Process Parameters and Material Properties with Regard to Prepreg Tack in Automated Lay-Up and Draping Processes. Compos. Part A Appl. Sci. Manuf. 117, 308–316. doi:10.1016/j.compositesa.2018.12.001
Budelmann, D., Schmidt, C., and Meiners, D. (2020). Prepreg Tack: A Review of Mechanisms, Measurement, and Manufacturing Implication. Polym. Compos. 41 (9), 3440–3458. doi:10.1002/pc.25642
Buehler, F. U., and Seferis, J. C. (2000). Effect of Reinforcement and Solvent Content on Moisture Absorption in Epoxy Composite Materials. Compos. Part A Appl. Sci. Manuf. 31 (7), 741–748. doi:10.1016/S1359-835X(00)00036-1
Cole, K. C., Noël, D., Hechler, J.-J., Cielo, P., Krapez, J.-C., Chouliotis, A., et al. (1991). Room-temperature Aging of Narmco 5208 Carbon-Epoxy Prepreg. Part II: Physical, Mechanical, and Nondestructive Characterization. Polym. Compos. 12 (3), 203–212. doi:10.1002/pc.750120311
Crossley, R. J., Schubel, P. J., and Warrior, N. A. (2012). The Experimental Determination of Prepreg Tack and Dynamic Stiffness. Compos. Part A Appl. Sci. Manuf. 43 (3), 423–434. doi:10.1016/j.compositesa.2011.10.014
de Andrade Raponi, O., Barbosa, L. C. M., Junior, J. E. B., Junior, A. C. A., and Guimarães, A. (2020). Effects of the Exposition of an Autoclave Prepreg to the Processing Environment on its Properties, Curing Cycle and Final Composite Behavior. Int. J. Adv. Manuf. Technol. 106 (11-12), 5129–5136. doi:10.1007/s00170-020-05022-5
DIN Deutsches Institut für Normung e. V. (2019). DIN EN ISO 29862:2019-09, Self Adhesive tapes - Determination of Peel Adhesion Properties (ISO 29862:2018); German Version EN ISO 29862:2019. Berlin: Beuth Verlag GmbH.
Dubois, O., Le Cam, J.-B., and Béakou, A. (2010). Experimental Analysis of Prepreg Tack. Exp. Mech. 50 (5), 599–606. doi:10.1007/s11340-009-9236-7
Ellis, B. (1993). Chemistry and Technology of Epoxy Resins. Ebrary, Inc. London, New York: Blackie Academic & Professional.
Endruweit, A., Choong, G. Y. H., Ghose, S., Johnson, B. A., Younkin, D. R., Warrior, N. A., et al. (2018). Characterisation of Tack for Uni-Directional Prepreg Tape Employing a Continuous Application-And-Peel Test Method. Compos. Part A Appl. Sci. Manuf. 114, 295–306. doi:10.1016/j.compositesa.2018.08.027
Forghani, A., Hickmott, C., Hutten, V., Bedayat, H., Wohl, C., Grimsley, B., et al. (2018). “Experimental Calibration of a Numerical Model of Prepreg Tack for Predicting Afp Process Related Defects,” in SAMPE Conference & Exhibition, Diamond Bar, CA, May 21-24, 2018 (California. Diamond Bar, CA: Society for the Advancement of Material and Process Engineering).
Gillanders, A. M., Kerr, S., and Martin, T. J. (1981). Determination of Prepreg Tack. Int. J. Adhesion Adhesives 1 (3), 125–134. doi:10.1016/0143-7496(81)90035-X
Grunenfelder, L. K., and Nutt, S. R. (2011). Out-time Effects on VBO (Vacuum Bag Only) Prepreg and Laminate Properties. SAMPE J. 47 (5), 6–13.
Haanappel, S. P., and Akkerman, R. (2014). Shear Characterisation of Uni-Directional Fibre Reinforced Thermoplastic Melts by Means of Torsion. Compos. Part A Appl. Sci. Manuf. 56, 8–26. doi:10.1016/j.compositesa.2013.09.007
Hagnell, M. K., and Åkermo, M. (2015). A Composite Cost Model for the Aeronautical Industry: Methodology and Case Study. Compos. Part B Eng. 79, 254–261. doi:10.1016/j.compositesb.2015.04.043
Harrison, P., Clifford, M. J., and Long, A. C. (2004). Shear Characterisation of Viscous Woven Textile Composites: a Comparison between Picture Frame and Bias Extension Experiments. Compos. Sci. Technol. 64 (10-11), 1453–1465. doi:10.1016/j.compscitech.2003.10.015
Hayes, B. S., Seferis, J. C., and Chen, J. S. (1996). Development and Hot-Melt Impregnation of a Model Controlled Flow Prepreg System. Polym. Compos.Compos 17 (5), 730–742. doi:10.1002/pc.10665
Heller, K., Böckl, B., Ebel, C., and Drechsler, K. (2018). “Influence of Prepreg Aging and Tack on Lay-Up Effects/Defects in Thermoset Automated Fiber Placement,” in ECCM 2018 - 18th European Conference on Composite Materials, Athens, Greece, 24-28th June 2018 (Athens, Greece: European Society for Composite Materials: Applied Mechanics Laboratory).
Heller, K., Seyfferth, S., Kind, K., and Drechsler, K. (2020b). “A Post Lay-up Tack Peel Test for Aerospace Grade Prepreg Tapes,” in Proceedings SE Conference Amsterdam, 29 September – 1 (Amsterdam, Netherlands: SAMPE Europe Conference and Exhibition 2020).
Hexcel Corporation (2020): HexPly 8552 Epoxy matrix. Product Data Sheet. Available online at: https://www.hexcel.com/user_area/content_media/raw/HexPly_8552_eu_DataSheet.pdf, (Accessed 7 22, 2021).
Heller, K., Hallmannseder, M., Colin, D., Kind, K., and Drechsler, K. (2020a). Comparing Test Methods for the Intra-ply Shear Properties of Uncured Prepreg Tapes. Sci. Eng. Compos. Mater. 27 (1), 89–96. doi:10.1515/secm-2020-0009
Hörmann, P. (2015). Thermoset Automated Fibre Placement – on Steering Effects and Their Prediction. München: Technische Universität München. Dissertation.
Hubert, P., Johnston, A., Poursartip, A., Nelson, K., Repecka, L., and Saremi, F. F. (2001). “Cure Kinetics and Viscosity Models for Hexcel 8552 Epoxy Resin,” in International SAMPE Symposium and Exhibition (Proceedings), Long Beach CA, 6-10 2001 (Long Beach CA: SKU).
Larberg, Y. R., Åkermo, M., and Norrby, M. (2012). On the In-Plane Deformability of Cross-Plied Unidirectional Prepreg. J. Compos. Mater. 46 (8), 929–939. doi:10.1177/0021998311412988
Lengsfeld, H., Wolff-Fabris, F., Krämer, J., Lacalle, J., and Altstädt, V. (2016). Composite Technology. Prepregs and Monolithic Part Fabrication Technologies. Munich, Cincinnati: Hanser Publishers; Hanser Publications.
Lukaszewicz, D. H.-J. A., and Potter, K. D. (2011). The Internal Structure and Conformation of Prepreg with Respect to Reliable Automated Processing. Compos. Part A Appl. Sci. Manuf. 42 (3), 283–292. doi:10.1016/j.compositesa.2010.11.014
Lukaszewicz, D. H.-J. A., Ward, C., and Potter, K. D. (2012). The Engineering Aspects of Automated Prepreg Layup: History, Present and Future. Compos. Part B Eng. 43 (3), 997–1009. doi:10.1016/j.compositesb.2011.12.003
Margossian, A., Bel, S., and Hinterhoelzl, R. (2016). On the Characterisation of Transverse Tensile Properties of Molten Unidirectional Thermoplastic Composite tapes for Thermoforming Simulations. Compos. Part A Appl. Sci. Manuf. 88, 48–58. doi:10.1016/j.compositesa.2016.05.019
Margossian, A., Hörmann, P., Zemliana, K., Avila-Gray, L., Bel, S., and Hinterhoelzl, R. (2015). Shear Characterisation of Unidirectional Thermoset Pre-impregnated Composites Using a Rheometre. Compos. Part A Appl. Sci. Manuf. 56, 8–26. doi:10.1016/j.compositesa.2013.09.007
Matveev, M. Y., Schubel, P. J., Long, A. C., and Jones, I. A. (2016). Understanding the Buckling Behaviour of Steered Tows in Automated Dry Fibre Placement (ADFP). Compos. Part A Appl. Sci. Manuf. 90, 451–456. doi:10.1016/j.compositesa.2016.08.014
Miller, S. G., Hou, T.-H., Sutter, J. K., Scheiman, D. A., Martin, R. E., Maryanski, M., et al. (2010). “Out-life Characteristics of IM7/977-3 Composites,” in SAMPE fall technical conference & exhibition, Salt Lake City, UT, 11 - 14 October 2010 (Salt Lake City, Utah. Covina, Calif: SAMPE).
Nguyen, C. D., and Krombholz, C. (2016). “Influence of Process Parameters and Material Aging on the Adhesion of Prepreg in AFP Processes,” in ECCM17 - 17th European Conference on Composite Materials, 26-30th June 2016 (Munich, Germany: European Society for Composite Materials).
O’Brien, D. J., Sottos, N. R., and White, S. R. (2007). Cure-dependent Viscoelastic Poisson's Ratio of Epoxy. Exp. Mech. 47 (2), 237–249. doi:10.1007/s11340-006-9013-9
Pascault, J. P., and Williams, R. J. J. (1990). Glass Transition Temperature versus Conversion Relationships for Thermosetting Polymers. J. Polym. Sci. B Polym. Phys. 28 (1), 85–95. doi:10.1002/polb.1990.090280107
Potter, K. (2002a). Bias Extension Measurements on Cross-Plied Unidirectional Prepreg. Compos. Part A Appl. Sci. Manuf. 33 (1), 63–73. doi:10.1016/S1359-835X(01)00057-4
Potter, K. (2002b). In-plane and Out-Of-Plane Deformation Properties of Unidirectional Preimpregnated Reinforcement. Compos. Part A Appl. Sci. Manuf. 33 (11), 1469–1477. doi:10.1016/S1359-835X(02)00138-0
Putnam, J. W., Seferis, J. C., Pelton, T., and Wilhelm, M. (1995). Perceptions of Prepreg Tack for Manufacturability in Relation to Experimental Measures. Sci. Eng. Compos. Mater. 4 (3), 143. doi:10.1515/SECM.1995.4.3.143
Rajan, S., Sutton, M. A., Sockalingam, S., McMakin, W., Gurdal, Z., and Kidane, A. (2020). Simulations and Experiments for Automated Fiber Placement of Prepreg Slit Tape: Wrinkle Formation and Fundamental Observations. Compos. Part B Eng. 201, 108287. doi:10.1016/j.compositesb.2020.108287
Rajan, S., Sutton, M. A., Wehbe, R., Gurdal, Z., Kidane, A., and Emri, I. (2021). Characterization of Viscoelastic Bending Stiffness of Uncured Carbon-Epoxy Prepreg Slit Tape. Compos. Struct. 275, 114295. doi:10.1016/j.compstruct.2021.114295
Rajan, S., Sutton, M. A., Wehbe, R., Tatting, B., Gürdal, Z., Kidane, A., et al. (2019). Experimental Investigation of Prepreg Slit Tape Wrinkling during Automated Fiber Placement Process Using StereoDIC. Compos. Part B Eng. 160, 546–557. doi:10.1016/j.compositesb.2018.12.017
Rousseau, R., Egghe, L., and Guns, R. (2018). “Statistics,” in Becoming Metric-Wise. Editors R. Rousseau, L. Egghe, and R. Guns (Cambridge, MA: Elsevier), 67–97. doi:10.1016/b978-0-08-102474-4.00004-2
Saseendran, S., Wysocki, M., and Varna, J. (2017). Cure-state Dependent Viscoelastic Poisson's Ratio of LY5052 Epoxy Resin. Adv. Manuf. Polym. Compos. Sci. 3 (3), 92–100. doi:10.1080/20550340.2017.1348002
Smith, A. W., Endruweit, A., Choong, G. Y. H., De Focatiis, D. S. A., and Hubert, P. (2020). Adaptation of Material Deposition Parameters to Account for Out-Time Effects on Prepreg Tack. Compos. Part A Appl. Sci. Manuf. 133, 105835. doi:10.1016/j.compositesa.2020.105835
Smith, E. J., Grubb, C., Misasi, J., and Larson, N. (2019). “Developing a Procedure for Prepreg Tack Characterization,” in 6th Annual Composites and Advanced Materials Expo, CAMX 2019, September 23-26, 2019 (Anaheim, USA: CAMX).
Timmis, A. J., Hodzic, A., Koh, L., Bonner, M., Soutis, C., Schäfer, A. W., et al. (2015). Environmental Impact Assessment of Aviation Emission Reduction through the Implementation of Composite Materials. Int. J. Life Cycle Assess. 20 (2), 233–243. doi:10.1007/s11367-014-0824-0
van Ee, D., and Poursartip, A. (2009). HexPly 8552 Material Properties Database for Use with COMPRO CCA and Raven. Created for NCAMP National Center for Advanced Materials Performance. Wichita, KS: National Center for Advanced Materials Performance. Available online at: https://www.wichita.edu/industry_and_defense/NIAR/Research/hexcel-8552/Additional-Documents-2.pdf(Accessed 1115, 2009).
Wang, Y., Chea, M. K., Belnoue, J. P.-H., Kratz, J., Ivanov, D. S., and Hallett, S. R. (2020). Experimental Characterisation of the In-Plane Shear Behaviour of UD Thermoset Prepregs under Processing Conditions. Compos. Part A Appl. Sci. Manuf. 133, 105865. doi:10.1016/j.compositesa.2020.105865
Wehbe, R., Tatting, B., Rajan, S., Harik, R., Sutton, M., and Gürdal, Z. (2020). Geometrical Modeling of Tow Wrinkles in Automated Fiber Placement. Compos. Struct. 246, 112394. doi:10.1016/j.compstruct.2020.112394
Keywords: prepreg, material characterization, aging, tack, automated fiber placement, steering
Citation: Heller K, Colin D and Drechsler K (2022) Quantifying the Influence of Out-Time on Prepreg Material Properties and Out-Of-Plane Steering Defects During Automated Fiber Placement. Front. Mater. 9:825809. doi: 10.3389/fmats.2022.825809
Received: 30 November 2021; Accepted: 28 February 2022;
Published: 16 May 2022.
Edited by:
Jonathan Pierre-Henri Belnoue, University of Bristol, United KingdomReviewed by:
Ralf Schledjewski, University of Leoben, AustriaCopyright © 2022 Heller, Colin and Drechsler. This is an open-access article distributed under the terms of the Creative Commons Attribution License (CC BY). The use, distribution or reproduction in other forums is permitted, provided the original author(s) and the copyright owner(s) are credited and that the original publication in this journal is cited, in accordance with accepted academic practice. No use, distribution or reproduction is permitted which does not comply with these terms.
*Correspondence: Klaus Heller, a2xhdXMuaGVsbGVyQHR1bS5kZQ==
Disclaimer: All claims expressed in this article are solely those of the authors and do not necessarily represent those of their affiliated organizations, or those of the publisher, the editors and the reviewers. Any product that may be evaluated in this article or claim that may be made by its manufacturer is not guaranteed or endorsed by the publisher.
Research integrity at Frontiers
Learn more about the work of our research integrity team to safeguard the quality of each article we publish.