 Yang Yang
 Zhen Zhang
 Liangjin Xu*
 Gang Yao
- Key Laboratory of New Technology for Construction of Cities in Mountain Area, School of Civil Engineering, Chongqing University, Chongqing, China
The collapsing number of tower cranes has increased with the development of the building industry. The safety of tower cranes has the potential to improve practices of building and outcomes in construction. The mechanical performance and failure mode of braced frame joints are analyzed in this research. Firstly, a mechanical model of a braced frame joint (BFJ) is established, and the experiment is designed. The destruction process and failure mode are researched by experiment. Then finite element model is established by ABAQUS. Moreover, working conditions with different concrete strength grades (CSG) and tension direction are researched. The results prove that braced frame joint cracks seriously with ultimate bearing capacity, simultaneously, the pre-embedded steel component (PESC) is pulled out. The failure mode is tensile and bending failure of BFJ in the test. The ultimate bearing capacity of failure is controlled by concrete strength grades. The tensile strength increases with the CSG, and the ultimate capacity of BFJ improves equally. The brittle fracture characteristic is more obvious in the ultimate state. The failure mode changes from crushing failure to tensile and bending failure with increasing tension angle. The research results could provide a better understanding of the working mechanism and performance evaluation of the BFJ of the tower crane.
1 Introduction
The height of high-rise buildings increases every year. The duration of construction for most buildings typically lasts longer as building heights increase. A tower crane is an essential equipment for loading and unloading in many construction sites. Tower crane safety during construction has been widely discussed (Forcael et al., 2020; Zhou et al., 2018; Vivian and Ivan, 2011). A tower crane is a multi-degree freedom system, whose dead weight and lifting weight as well as other working loads are carried by braced frame joint (BFJ), and finally, the load is transferred from BFJ to a high-rise structure (Raviv et al., 2017; Wang et al., 2011). The BFJ of the tower crane bears dynamic magnification performance and its reliability is reduced for obvious whiplash effect with external excitation. Engineering accidents often occur during the installation and use of tower cranes, as shown in Figure 1.

FIGURE 1. Accident of tower crane during installation.
Construction machinery safety and the mechanical performance of the structure in construction have been subjects of great concern among researchers (Yang et al., 2021; Yao et al., 2021a; Yao et al., 2021b; Zhang and Pan, 2021; Zhang et al., 2020; Chu et al., 2019; Chu et al., 2019; Duan et al., 2020). Concerning accidents include low-frequency high-severity accidents and high-frequency low-severity accidents (Jaafar et al., 2013). Tower crane safety has been analyzed according to respective issues such as the installation and dismantling stages (Shin, 2015), and other studies have considered selection (Briskorn and Dienstknecht, 2019; Sohn et al., 2014; Marzouk and Abubakr, 2016), location (Abdelmegid et al., 2015), earthquakes (Ai et al., 2013; Huang and Syu, 2014), wind (Mara, 2010; Şahin et al., 2016), and layout (Lien and Cheng, 2014; Younes and Marzouk, 2018). Intelligent monitoring systems (Zheng et al., 2013) and enhanced crane operations (Zavichi et al., 2014; Shapira and Elbaz, 2014; Peng et al., 2018) have also been the subject of research. Numerical simulation is an efficient and feasible approach in tower crane safety research. SAP 2000, ANSYS, and ABAQUS are the main analysis platforms in establishing the tower crane finite element model (Forcael et al., 2020; Yao et al., 2021a; Ai et al., 2013; Mara, 2010). The building information model (BIM) has been applied in tower crane selection and tower crane layout planning (Ji and Leite., 2018; Wang et al., 2015). Appropriate experiments could demonstrate principles of destruction mechanism and failure mode (Heo et al., 2021; Sui et al., 2020; Wang et al., 2019). There are many kinds of research in the mechanical performance of building structures. Nevertheless, experiments exploring tower crane safety are rare. The mechanical performance of tower crane BFJ plays an important role in tower crane safety. However, few types of research are conducted to address the mechanical performance and destruction of tower crane BFJ. Traditional methods such as increasing section, increasing auxiliary measures, and embedding with both sides of the wall are often adopted to improve the reliability of BFJ. Since the BFJ is a temporary facility during construction, it is dismantled after the completion of the main structure. By increasing the reinforcement ratio or section size of the pre-embedded steel component (PESC) to improve the safety coefficient, the corresponding measures and labor cost increases, which is contrary to the limit state design method of the concept of economy.
This research aims to evaluate the mechanical performance and failure mode of BFJ in high-rise building construction. The working performance of BFJs are examined using reduced scale model tests, numerical simulations, and theoretical analysis. Firstly, a mechanical model of the joint was established, and an experiment was designed to study the destruction mechanism and failure mode of BFJ. Finite element models were established and verified, with CSG and tension direction taken as variables respectively. The failure modes and mechanisms of BFJ were then studied by numerical simulation and theoretical analysis.
2 Mechanical Model
The load applied to the tower crane transfers of the reinforced concrete core tube through the BFJ. The stability and safety of joints are the premise of the normal operation of the tower crane. Tower cranes are attached to the shear wall in high-rise buildings during construction, as shown in Figure 2. The concrete at the supporting point bears a composite effect by horizontal and vertical forces. It is therefore vital to establish a reasonable mechanical model of BFJ, to study the reasons and extension regularities of cracks.
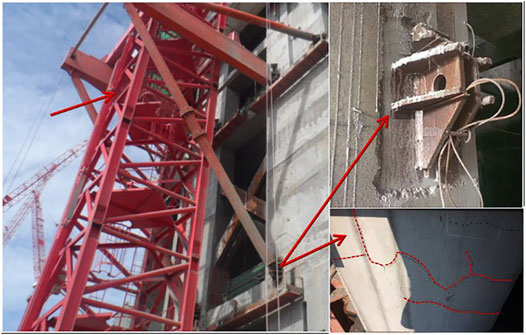
FIGURE 2. BFJ of tower crane and cracks.
The standard section of the tower crane connects with the building by PESC, the most commonly used BFJ is shown in Figure 3A. The vertical load of PESC and concrete in the joints include the dead weight of the tower crane, lifting weight, and the weight of concrete counterbalance. The horizontal load includes wind load, anti-overturning moment, and anti-sliding load. The seismic load, the non-uniform motion of cable and trolley, and the rotation of the crane arm in the horizontal plane will lead to dynamic actions at the joints. In engineering, the force of the tower crane joints is complex, and its direction is also uncertain. The simplified BFJ and test device are shown in Figure 3.
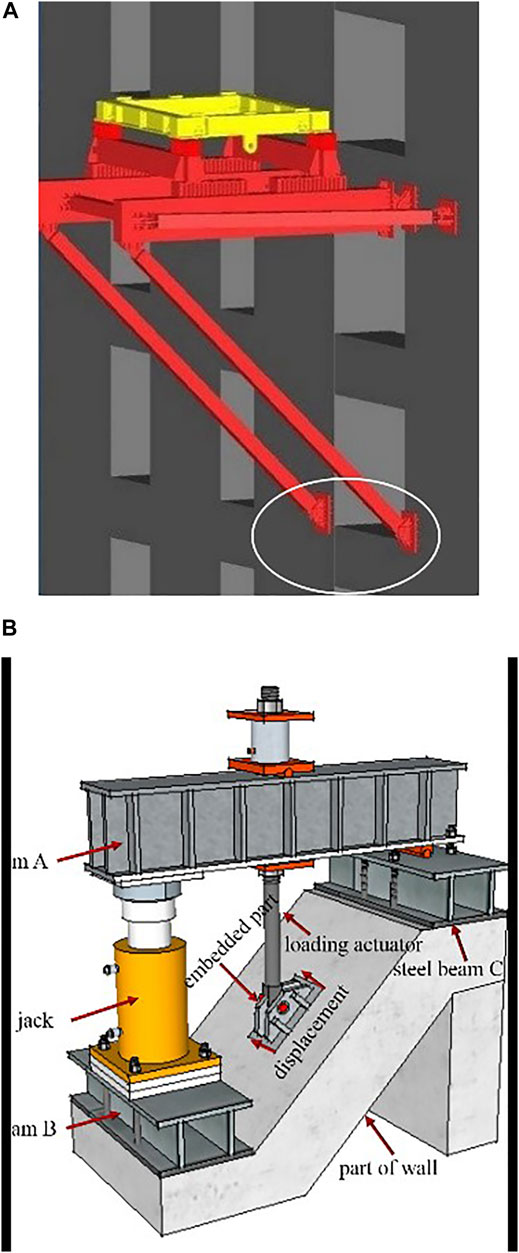
FIGURE 3. Simplified BFJ and test device: (A) BFJ in construction, (B) test device.
Three steel beams are used in the test device. Steel beam A (SBA) aims to provide drawing force. The loading actuator protrudes from the hole in the middle of SBA. During the loading process, the hydraulic jack transmits the thrust to SBA. Steel beam B (SBB) and steel beam C (SBC) are used to the fixed specimen. The steel beam is provided with stiffeners to improve the rigidity and reduce the deformation of SBA, SBB, and SBC. During the loading process, the end of SBA also follows the upward displacement of the hydraulic jack, meaning SBA is slightly inclined. At the same time, the bottom of the SBA separates from the top of the hydraulic jack. To ensure contact between SBA and the hydraulic jack, a movable hinge is designed to ensure contact. During installation, the laser level is used to correct the position of components, which ensures that the center of the jack, the centerline of PESC, and the midpoint of the rotating hinge are in the same vertical plane. According to the Saint-venant principle, the local load effect only influences the stress field distribution within a certain range (Bastin et al., 2021; Bai et al., 2021; Chen and Bai, 2021). Hence, the dimension of BFJ could be increased in number threefold with PESC. The dimensions of tested BFJ specimens are shown in Figure 4.
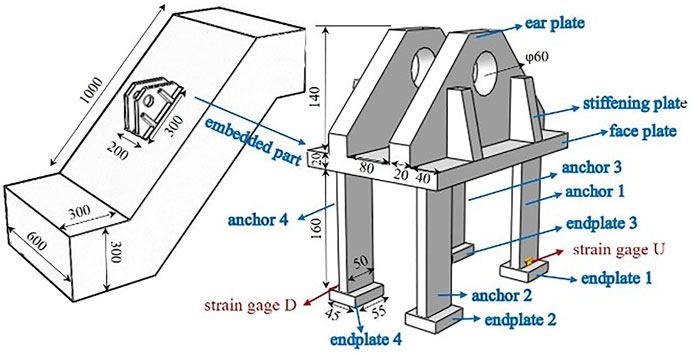
FIGURE 4. Dimensions and composition of BFJ and PESC (mm).
The mechanical performance of BFJ is mainly controlled by the PESC parameters. PESC is composed of five parts, including ear plate, stiffening plate, faceplate, anchor, and endplate, as shown in Figure 4. The PESC is an axisymmetric structure, therefore displacement and extreme stress in key locations can reflect mechanical performance. Two strain gages (strain gage U and strain gage D) are placed on anchor one and anchor four respectively.
3 Experimental Setup
3.1 Testing Device
The experiment was completed in the Structural Laboratory of Chongqing University. The quantitative value of load added on the BFJ is measured with Digital Strain Gauge, and the quantitative value of crack is measured with Crack Width Observer, as shown in Figure 5. The detailed parameters and types of main test instruments are shown in Table 1.
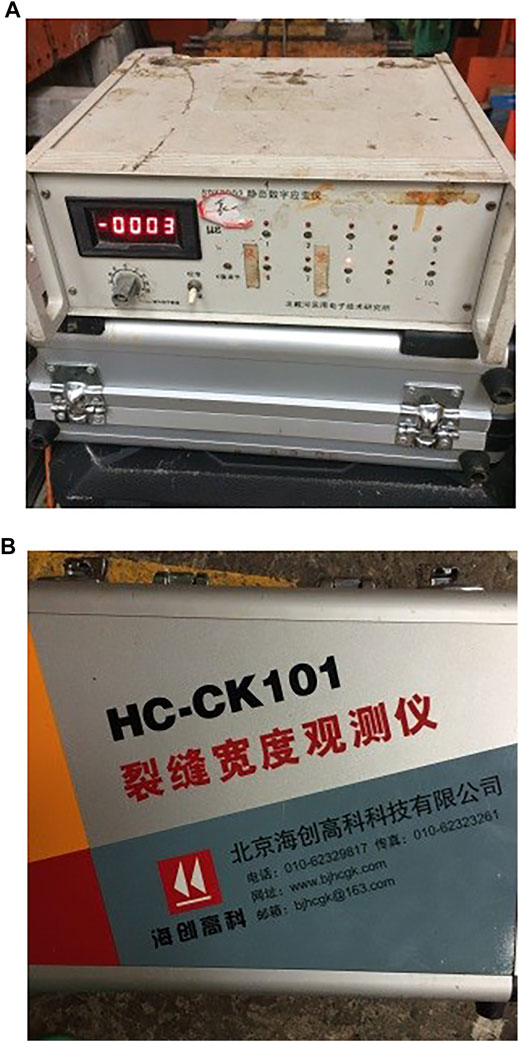
FIGURE 5. Main test instruments: (A) digital strain gauge, (B) crack width observer.
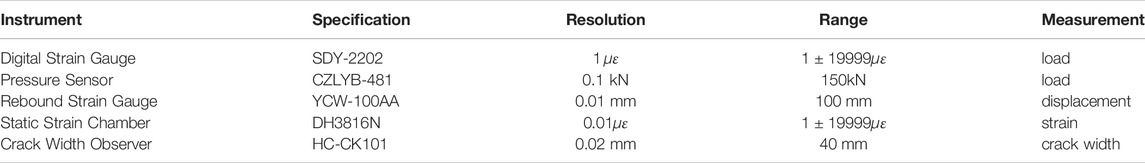
TABLE 1. Parameters of main test instruments.
3.2 Sensor Placement
To study the mechanical properties and failure mechanism of the BFJ, the data measured include tension, displacement of PESC, and the anchor plate strain of PESC. The strain gauges are arranged on the end of the anchor, the measurement points are shown in Figure 6.
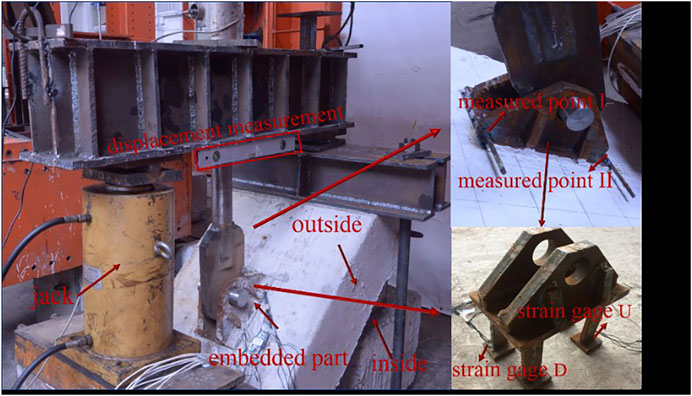
FIGURE 6. Layout of strain stages and displacement measurement.
The pressure sensor is placed between nut and SBA, and hence the measured load value is the exact quantitative value applied on the PESC. It could directly measure the load quantitative value of the hydraulic jack, avoiding the amplified error. Considering the deformation of SBA, SBB, and SBC, measured points are directly installed on the upper side and lower side welded rebar of the PESC and named measured point I and measured point II.
3.3 Material Performance Testing
3.3.1 Concrete Performance Testing
The concrete used for the test comes from the same batch of commercial concrete. Three groups of 150 mm standard test blocks are randomly produced, and there are three specimens in each group. The test specimens are cured under the same conditions. The average actual compressive strength value of the tested concrete is taken as the representative value of the strength. The concrete performance testing is shown in Figure 7, and the parameters in Table 2 are obtained.
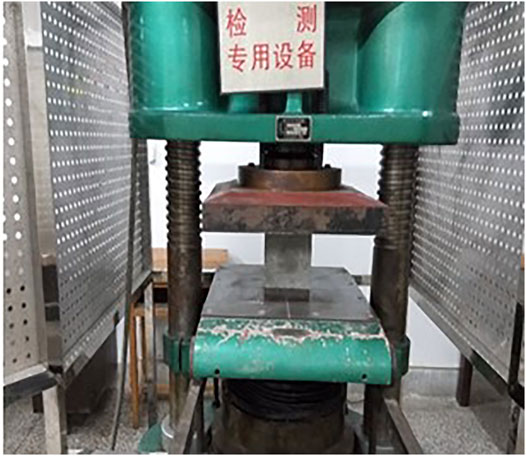
FIGURE 7. Concrete performance test device.
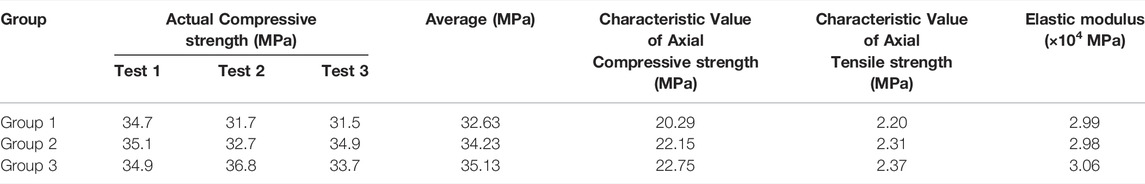
TABLE 2. Concrete performance parameters.
3.3.2 Rebar Performance Testing
Ribbed rebar is used in the test, and the nominal yield strength is 400 MPa. The samples are randomly selected from the same batch of rebar, and C8 and C10 rebar are taken from each group. Each group included three standard length test pieces, and the tensile test is carried out on the INSTRON 1342 static test-machine, as shown in Figure 8. The yield strength, ultimate strength, and elastic modulus are measured and shown in Table 3.

FIGURE 8. Steel plate performance testing.
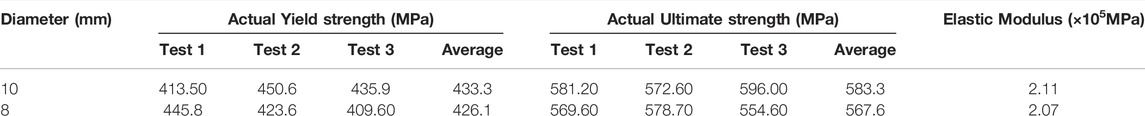
TABLE 3. Rebar performance testing parameter.
3.3.3 Steel Plate Performance Testing
The PESC is made of Q345C, and the nominal yield strength is 345 MPa. The standard metal plates are made of the same steel, the tensile test is carried out on the INSTRON 1342 static test-machine, and the yield strength, ultimate strength, and elastic modulus are measured and shown in Table 4.
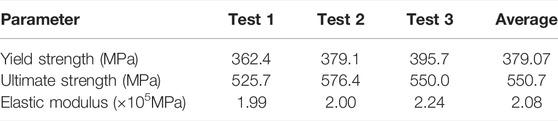
TABLE 4. Testing parameters of steel plate.
3.4 Loading Scheme and Test Result
A stepwise monotonic static loading project is taken in the test. Preloading is carried out before formal loading and all the test instruments are determined to work normally and the device is reliable. The preloaded data is used to judge the relationship between load and deformation, and the test piece and the support are in contact. After preloading, unloading to 0, and then starting the formal loading, the cracking point, yield point, and limit point are captured during the loading process, the differential is adjusted downward around the point locations, and the load of each level lasts 1.0 min.
The mechanic behavior of BFJ is closely associated with crack propagation. The destruction mechanism and failure mode can be reflected by crack propagation. The critical points and corresponding crack states are recorded and shown in Figure 9. The full load–strain relationships of BFJ are shown in Figure 10.
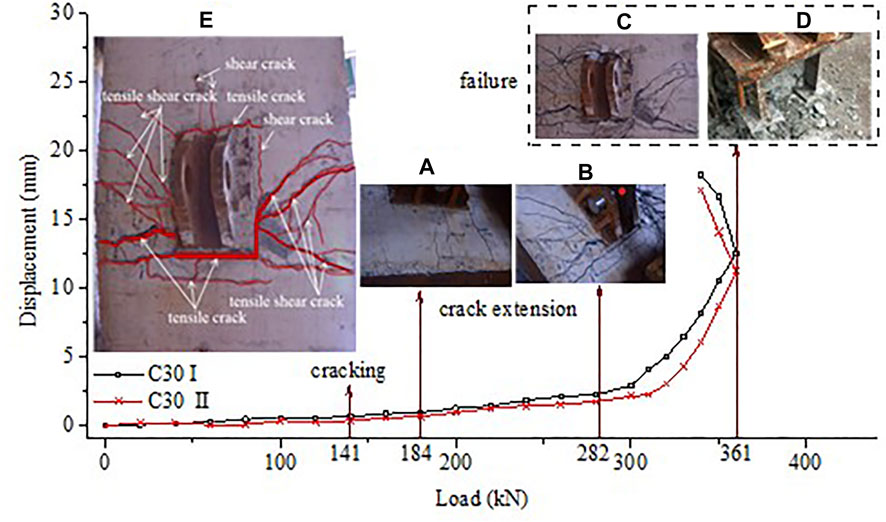
FIGURE 9. Load–displacement relationships of BFJ.
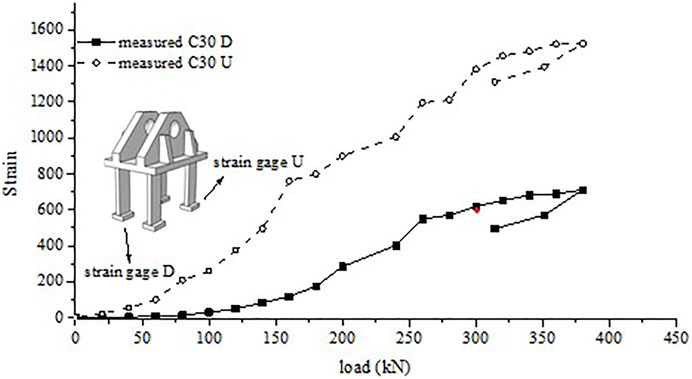
FIGURE 10. Load–strain relationships of PESC.
The cracking load is 141.0kN, with a 2.6 mm tensile crack at the bottom of PESC. When the load is 184.0kN, two tensile cracks appeared with 2.0 and 1.6 mm in width, as shown in Figure 9A. When the load is 282.0kN, shear cracks appear at the bottom center of PESC. The concrete at the bottom of PESC is displacement damaged with lateral uplift, as shown in Figure 9B. The upper corner of the PESC produced an oblique crack with 2.4 mm in width when the load is 361.0 kN, as shown in Figure 9C. When the BFJ is finally destroyed, there are two main tensile cracks with 10.8 and 11.2 mm, and the largest main shear crack is 10.6 mm. Figure 9D indicates that there is no plastic deformation in PESC, and hence the failure of BFJ is determined by concrete. Cracks of specimens concentrate mainly on the central and bottom of PESC. Moreover, tensile shear crack concentrates mainly on a 45° angle, as shown in Figure 9E. The extreme values in strain gage U and D are 1,524 and 711 respectively, as shown in Figure 10. The PESC deformation in the anchor end has an obvious difference from the tension. Both of the strains dropped after the final destruction of BFJ, and hence PESC deformation is elastic deformation without destruction.
4 Numerical Analysis
4.1 Numerical Simulation
Numerical models with different working conditions are established to study the mechanical performance of BFJ. The detailed parameters of numerical models are given in Tables 5, 6.
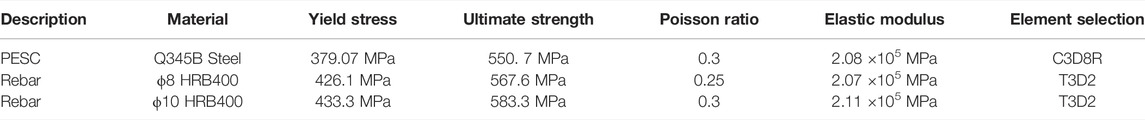
TABLE 5. Material properties in finite element model. Steel material properties.
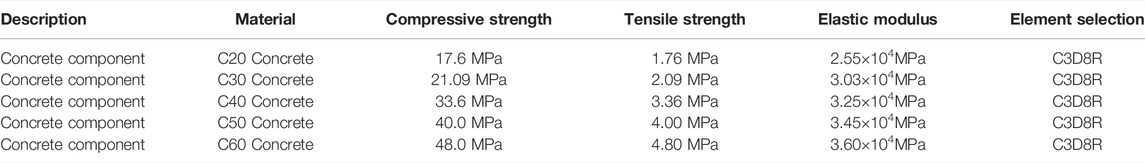
TABLE 6. Material properties in finite element model. Steel Concrete material properties.
The PESC element is embedded in the concrete element with the “Embedded Region” command in ABAQUS. The “surface to surface contact” of ABAQUS is set between the surfaces of PESC and the concrete component. The deformation coordination of BFJ is realized by setting the friction contact property. Mesh density and element quality should be simplified to a certain degree because of limited computer performances. The element information used in finite element models is given in Figure 11. In order to research the influence of tension direction and CSG, nine working conditions were set up and analyzed in the finite element model, parameters are shown in Table 7.
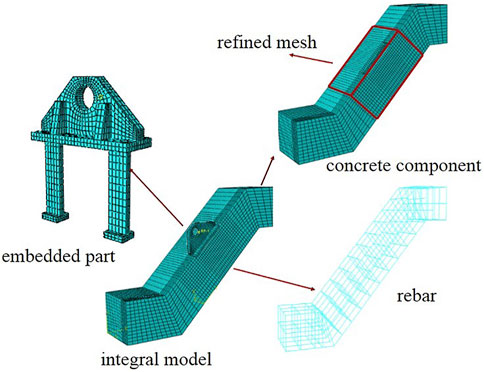
FIGURE 11. Finite element model of BFJ.
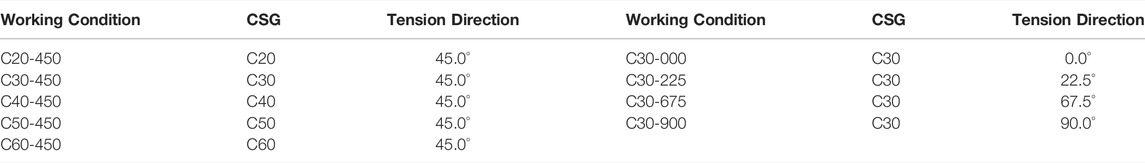
TABLE 7. Working condition parameters.
4.2 Comparison Between Model and Experiment
The cross-comparison between test and simulation was taken to verify the correctness and reliability of the numerical simulation, as shown in Figure 12.
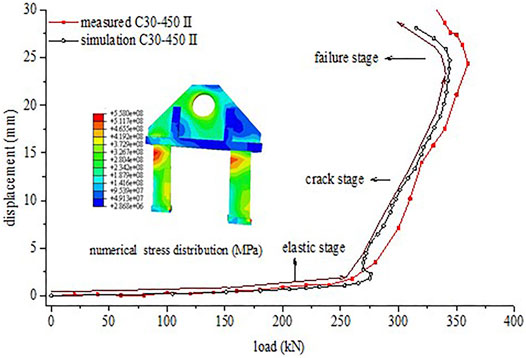
FIGURE 12. Load-displacement comparison in experiment and simulation.
The ultimate bearing capacity is 361.0kN in experiment and 355.0kN in numerical simulation. PESC stiffness has almost no change in the early stage of loading. The BFJ is still in the elastic stage, and only small cracks are generated. The displacements are shown in Figure 12 and have a good consistency. The displacements gradually increase rapidly with the increasing load. The stress distribution of the PESC is also shown in Figure 12. The principal tensile stress on the bottom of PESC is larger. The stress of PESC is relatively lower than the yield strength. The elastic deformation appeared in the PESC, but the PESC is not in failure mode, which is consistent with the experimental results. The PESC failure mode in the simulation corresponds with the experiment. The numerical model has high credibility and could be used in the parametric analysis of PESC.
4.3 Influence of CSG
During the construction of high-rise buildings, the CSG increases with the rising of the core tube. Therefore, it is of great practical significance to study the mechanical performance of the BFJs with different CSGs. The CSGs are taken as C20, C30, C40, C50, and C60 in the study. The constitutive relationships of concrete are defined in the Property module of ABAQUS. The finite element model analysis is carried out to obtain the load-displacement relationships and ultimate bearing capacity with different CSGs, as shown in Figure 13.
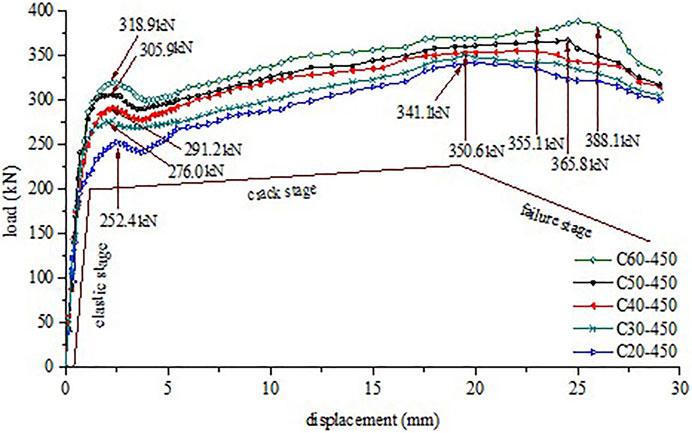
FIGURE 13. Influence of CSG on load-displacement.
Figure 13 shows that the load-displacement relationships could generally be divided into three stages, including the elastic stage, crack stage, and failure stage. During the initial loading period, the relationships show a linear relationship with a small displacement. It is speculated that concrete and the PESCs only produced elastic deformations, and hence the initial stiffness of each specimen is relatively similar. With the increase of displacements, track transition relationships occur during the crack stage. Combining the results of the tests, it can be speculated that the concrete is cracked and the stiffness is affected. The load-displacement relationships have a significant decline phase when the specimen is pulled out. The slope of the relationships becomes steeper with increasing CSG in the failure stage, and the brittle failure phenomenon becomes more obvious. The reason for this is the constitutive relation of the concrete material and the slip on the contact surface. The ultimate bearing capacity of C20–450, C30–450, C40–450, C50–450 and C60-450 were 341.1, 350.6, 355.1, 365.8, and 388.1 MPa respectively. The ultimate bearing capacity increase with increasing CSG. In the crack stage, each finite element model has an extreme value, combing with the experiment phenomenon, which has the characteristic of major cracks appearing. The characteristic crack values of C20–450, C30–450, C40–450, C50-450, and C60-450 are 252.4, 276.0, 291.2, 305.9, and 318.9 MPa respectively, and the characteristic crack values also increase with the increase of CSG.
To explore the destruction change in PESC and concrete components with ultimate bearing capacity, the stress and damage distribution of the specimens with different CSGs are shown in Figures, 14, 15.
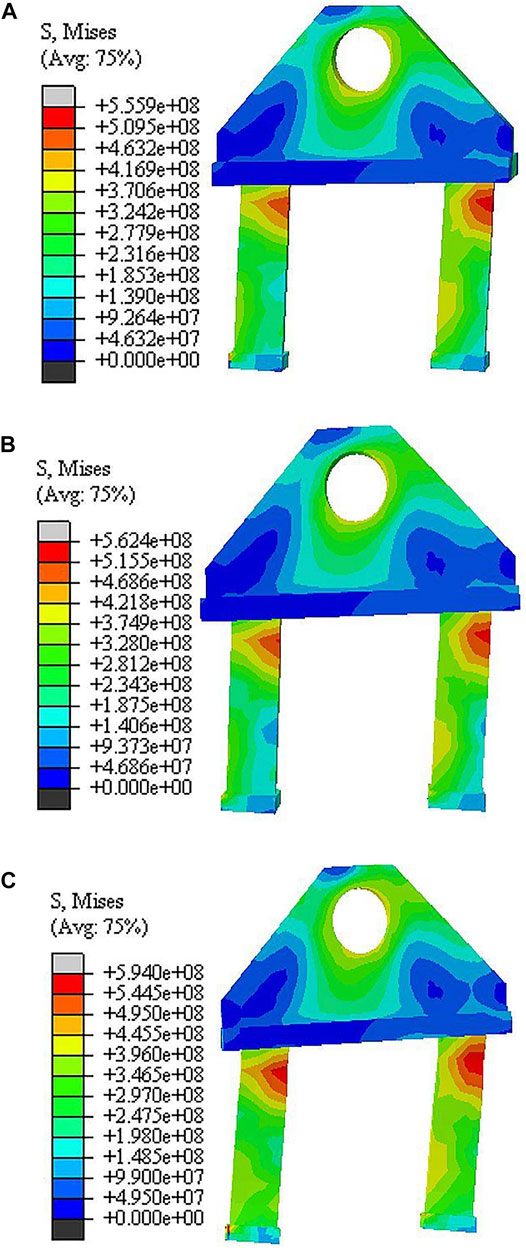
FIGURE 14. Numerical stress distribution with different CSG (MPa): (A) C20-450 PESC, (B) C40-450 PESC, (C) C60-450 PESC.
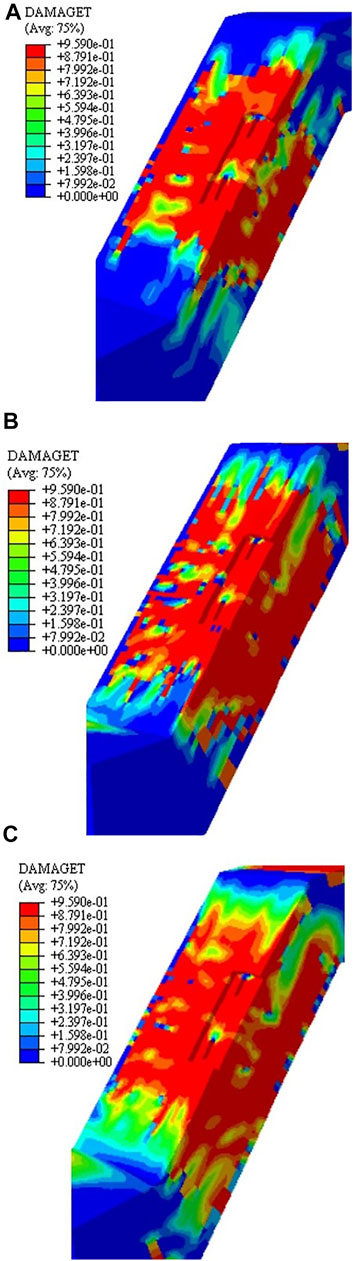
FIGURE 15. Numerical damage distribution with different CSG: (A) C20-450 concrete component, (B) C40-450 concrete component, (C) C60-450 concrete component.
Based on a comparison of the PESCs in Figures 14A–C, the stress distribution of different concrete grades of PESCs are similar, especially in the location of stress concentration. All three locations of stress concentrations are located on the interface of anchor and faceplate. The peak value is 555.9 MPa, 562.4.9 MPa, and 594.0 MPa. The stress in-ear plate and anchor are larger than the faceplate and endplate. With the action of transverse shear force, the anchor and concrete are mutually squeezed, thus stress on one side of the embed is concentrated. Other parts of the PESC are in the elastic stage, and the safety reservation is sufficient.
As shown in Figure 15, concrete crushing parts are always concentrated around the PESC. This is the result of the transverse shear action between PESC and concrete. The damage concentration area reduces with the increase of CSG. The failure modes of the specimens have similarities in Figure 15. A large number of cracks are generated on the concrete surface in a failure state, and concretes are cracked and damaged with severe tension. It is speculated that failure mode is controlled by concrete tensile strength. Ultimate bearing capacity increases with the increase of concrete.
4.4 Influence of Tension Direction
To research the influence of the tension direction on BFJ, the tension directions were taken from 0.0° to 90.0°, with a 22.5° stepwise. The finite element model analysis was carried out to obtain the load-displacement relationships and ultimate bearing capacity with different tension directions, as shown in Figure 16.
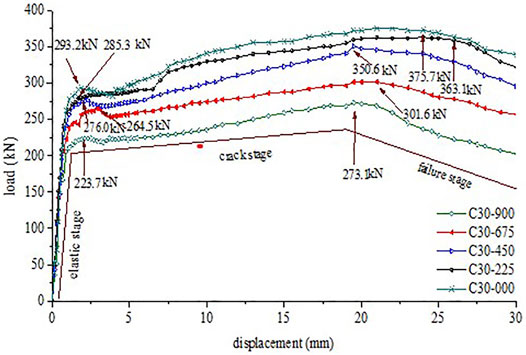
FIGURE 16. Influence of tension direction grade on load-displacement.
Figure 16 indicates that the load-displacement relationships could generally be divided into three stages, including the elastic stage, crack stage, and failure stage. The initial stiffness of the specimens is close to different working conditions in the elastic stage. With increasing load, the specimens begin to yield. The specimens are destroyed and ultimate bearing capacity can be obtained in the failure stage. The ultimate bearing capacity of C30–900, C30–675, C30–450, C30–225 and C30-000 were 273.1, 301.6, 350.6, 363.1, and 375.7 MPa respectively. The ultimate bearing capacity has a great difference with changes of tension direction. In the crack stage, the characteristic crack values of C30–900, C30–675, C30–450, C30-225, and C30-000 are 223.7, 264.5, 276.0, 285.3, and 293.2 MPa respectively. Therefore, the tension direction has an obvious effect on the ultimate bearing capacity and characteristic crack value. When the tension direction changes to 0.0°, the concrete is subjected to tangential shear force, and compressive strength plays an important role. When the tension direction changes to 90.0°, the concrete is subjected to normal tension, and tensile strength plays an important role.
As can be seen from the numerical stress distribution of Figure 17, PESC with 0.0° tension direction has the largest deformation. There are two main locations of stress concentration in C30-000 PESC, at the top of the anchor and around the draw hole. Stress concentration is located at the top of the anchor in C30-450 PESC. Nevertheless, PESC with 90.0° tension direction is still in the elastic state when the specimen is destroyed. Stress on the anchor is larger than the ear plate and faceplate.
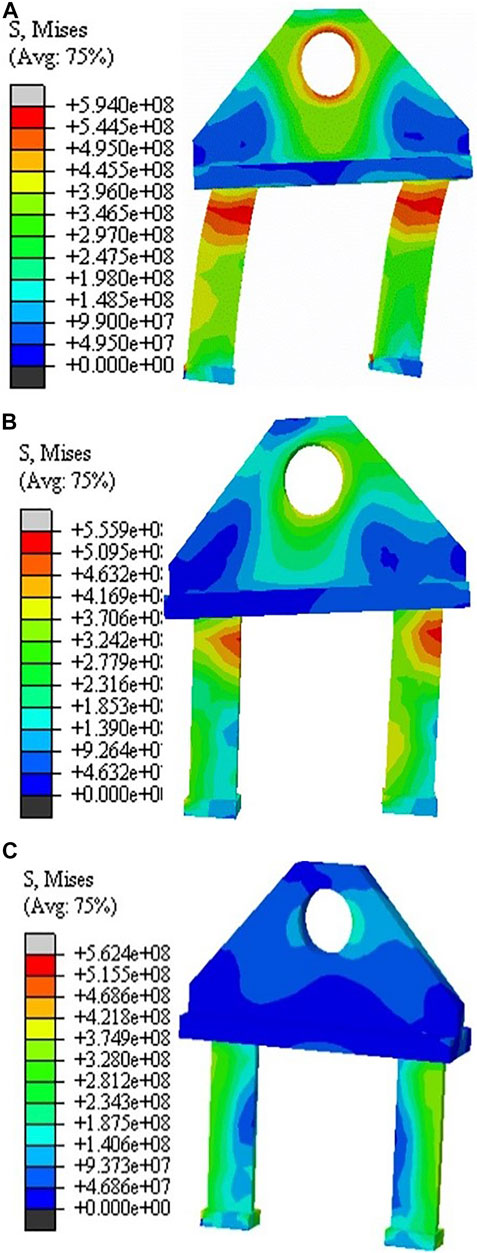
FIGURE 17. Numerical stress distribution with different tension directions: (A) C30-000 PESC, (B) C30-450 PESC, (C) C30-900 PESC.
The numerical stress distribution outlined in Figure 18 indicates that the damaged area is largest in the C30-450 concrete component. Damage in the C30-450 concrete component is the second largest and the C30-000 concrete component is the smallest. The specimen shears mainly tangentially and the compression damage is mainly concentrated on the top of the anchor plate. The transition region from damage to undamaged has an obvious difference. The C30-450 concrete component has the largest transition region, and C30-000 concrete component has the smallest transition region. The concrete around the upper side of PESC is crushed by the shear force, which is the reason for the failure of the specimen with 0.0° tension direction. When the tension direction changes to 90.0°, the crushed area is gradually reduced, and the tensile area gradually increases. The tension direction can affect the final failure mode. The change of tension direction has a more obvious effect than CSG.
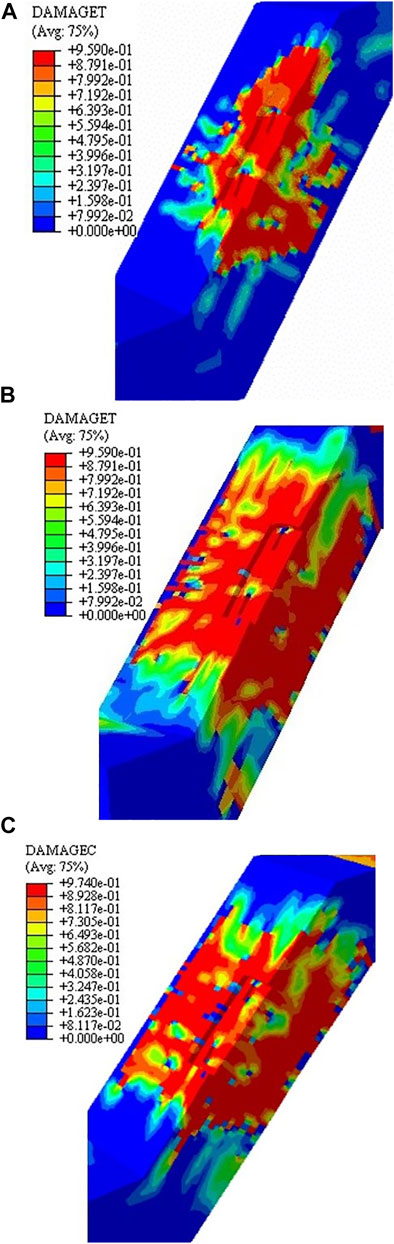
FIGURE 18. Numerical damage distribution with different tension directions: (A) C30-000 concrete component, (B) C30-450 concrete component, (C) C30-900 concrete component.
5 Conclusion
This study examined the mechanical performance of BFJ by experiment and numerical simulation. The experiment used a reduced scale prototype model test and a whole process numerical simulation of the model was carried out by the finite element method. The loading process can be fitted to a straight line in the early stage with little displacement, and the structure is in the linear elastic state. The stiffness degraded as the loading and the slope of the curve decreased. In the failure stage, the crack distribution range expanded and the stiffness degradation became more serious. The cracks of BFJ can be distributed into three classes, tensile crack, tensile shear crack, and shear crack. The cracks of the specimens were concentrated mainly on the central and bottom of PESC. The development and connection of cracks may be the reason for abrupt stiffness degradation. The ultimate bearing capacity and characteristic crack value increased with the increase of CSG. The stress distribution with different concrete grades of PESCs was similar, especially in the location of stress concentration. Concrete crushing parts were always concentrated around the PESC. The stress concentration area in the concrete component reduced with the increase of CSG. The failure mode was controlled by concrete tensile strength. The construction stage of BFJ should hemce be taken into consideration in safety checking. The tension direction has an obvious effect on the ultimate bearing capacity and characteristic crack value. When tension direction changes to 0.0°, concrete is subjected to tangential shear force. When the tension direction changes to 90.0°, the concrete is subjected to normal tension. The concrete around the upper side of the PESC is crushed by shear force and is the reason for the failure of specimens with 0.0° tension direction. When the tension direction changed to 90.0°, the crushed area gradually reduced, and the tensile area gradually increased. Therefore, the aggregate of all external incentives should be calculated to get the accurate direction of the force. The reasons for tower crane failures are complicated. The nodal instability and mechanical properties of the joints were studied herein by combining experiments and computer simulations, but the influence of different joint structures on the bearing capacity of the tower crane was not considered. The type of material is also critical to the crane’s carrying capacity. Future research should focus on the design of the different joints of the tower crane and material properties. Seismic analysis is also necessary when monitoring the tower crane. With the pace of urbanization accelerating and the density of construction groups increasing, it is necessary to analyze the BFJ of tower cranes in high-rise building construction to improve safety and security (Tang Y. C. et al., 2021; Tang Y. et al., 2021).
Data Availability Statement
The original contributions presented in the study are included in the article/Supplementary Material, further inquiries can be directed to the corresponding author.
Author Contributions
Conceptualization, YY and GY; methodology, YY and GY; software, YY and ZZ; formal analysis, YY, ZZ and LX; writing‐original draft preparation, YY and GY; writing‐review and editing, YY, ZZ and LX All authors have read and agreed to the published version of the manuscript.
Funding
This work was funded by the 111 Project of the Ministry of Education and the National Key R and D Program of the Ministry of Science and Technology (No. 2019YFD1101005-4).
Conflict of Interest
The authors declare that the research was conducted in the absence of any commercial or financial relationships that could be construed as a potential conflict of interest.
Publisher’s Note
All claims expressed in this article are solely those of the authors and do not necessarily represent those of their affiliated organizations, or those of the publisher, the editors and the reviewers. Any product that may be evaluated in this article, or claim that may be made by its manufacturer, is not guaranteed or endorsed by the publisher.
References
Abdelmegid, M. A., Shawki, K. M., and Abdel-Khalek, H. (2015). GA Optimization Model for Solving tower crane Location Problem in Construction Sites. Alexandria Eng. J. 54 (3), 519–526. doi:10.1016/j.aej.2015.05.011
Ai, B., Yang, J. L., and Pei, Z. Z. (2013). Seismic Response Analysis of tower crane in Consideration of the Building-crane Interaction. Appl. Mech. Mater. 353-356, 1981–1985. doi:10.4028/www.scientific.net/amm.353-356.1981
Bai, J., Chen, H., Zhao, J., Liu, M., and Jin, S. (2021). Seismic Design and Subassemblage Tests of Buckling-Restrained Braced RC Frames with Shear Connector Gusset Connections. Eng. Structures 234, 112018. doi:10.1016/j.engstruct.2021.112018
Bastin, G., Coron, J.-M., and Hayat, A. (2021). Feedforward Boundary Control of 2×2 Nonlinear Hyperbolic Systems with Application to Saint-Venant Equations. Eur. J. Control. 57, 41–53. doi:10.1016/j.ejcon.2020.11.002
Briskorn, D., and Dienstknecht, M. (2019). Mixed-integer Programming Models for tower crane Selection and Positioning with Respect to Mutual Interference. Eur. J. Oper. Res. 273 (1), 160–174. doi:10.1016/j.ejor.2018.07.033
Chen, H., and Bai, J. (2021). Seismic Performance Evaluation of Buckling-Restrained Braced RC Frames Considering Stiffness and Strength Requirements and Low-Cycle Fatigue Behaviors. Eng. Structures 239, 112359. doi:10.1016/j.engstruct.2021.112359
Chu, Y., He, X., Yao, Y., and Hou, H. (2019). Experimental Research on the Shear Performance of the Two-Storey Composite Cold-Formed Thin-Walled Steel wall. KSCE J. Civ. Eng. 24 (2), 537–550. doi:10.1007/s12205-019-5519-4
Duan, M., Zhang, S., Wang, X., and Dong, F. (2020). Mechanical Behavior in Perfobond Rib Shear Connector with UHPC-Steel Composite Structure with Coarse Aggregate. KSCE J. Civ. Eng. 24 (4), 1255–1267. doi:10.1007/s12205-020-0923-3
Forcael, E., Young, G., Opazo, A., Rodríguez, C., and Bayona, A. (2020). The Effects of Temporary tower Cranes on the Construction Process and Seismic Behavior of Reinforced concrete Buildings. KSCE J. Civ. Eng. 24 (2), 580–595. doi:10.1007/s12205-020-1257-x
Heo, G., Choi, H., Baek, E., and Kim, C. (2021). Development of Viscoelastic Damper System to Improve Seismic Performance of Storage Racks. KSCE J. Civ. Eng. 25 (9), 3390–3400. doi:10.1007/s12205-021-1024-7
Huang, L. J., and Syu, H. J. (2014). Seismic Response Analysis of tower crane Using SAP2000. Proced. Eng 79, 513–522.
Jaafar, H. I., Mohamed, Z., Jamian, J. J., Abidin, A. F. Z., Kassim, A. M., and Ghani, Ab. (2013). Dynamic Behaviour of a Nonlinear Gantry crane System. Proced. Tech 11, 419 425. doi:10.1016/j.protcy.2013.12.211
Ji, Y., and Leite, F. (2018). Automated tower crane Planning: Leveraging 4-dimensional BIM and Rule-Based Checking. Automation in Construction 93, 78–90. doi:10.1016/j.autcon.2018.05.003
Lien, L.-C., and Cheng, M.-Y. (2014). Particle Bee Algorithm for tower crane Layout with Material Quantity Supply and Demand Optimization. Automation in Construction 45, 25–32. doi:10.1016/j.autcon.2014.05.002
Mara, T. G. (2010). Effects of a Construction tower crane on the Wind Loading of a High-Rise Building. J. Struct. Eng. 136 (11), 1453–1460. doi:10.1061/(asce)st.1943-541x.0000243
Marzouk, M., and Abubakr, A. (2016). Decision Support for tower crane Selection with Building Information Models and Genetic Algorithms. Automation in Construction 61, 1–15. doi:10.1016/j.autcon.2015.09.008
Peng, B., Flager, F. L., and Wu, J. (2018). A Method to Optimize mobile crane and Crew Interactions to Minimize Construction Cost and Time. Automation in Construction 95, 10–19. doi:10.1016/j.autcon.2018.07.015
Raviv, G., Fishbain, B., and Shapira, A. (2017). Analyzing Risk Factors in crane-related Near-Miss and Accident Reports. Saf. Sci. 91, 192–205. doi:10.1016/j.ssci.2016.08.022
Şahin, Y., Levent, M., and Hira, K. (2016). Analysis of Active Vibration Control of Multi-Degree-Of-freedom Flexible Systems by Newmark Method. Simul. Model. Pract. Theor. 69, 136–148.
Shapira, A., and Elbaz, A. (2014). Tower crane Cycle Times: Case Study of Remote-Control versus Cab-Control Operation. J. Constr. Eng. Manage. 40 (12), 904. doi:10.1061/(asce)co.1943-7862.0000904
Shin, I. J. (2015). Factors that Affect Safety of tower crane Installation/dismantling in Construction Industry. Saf. Sci. 72, 379–390. doi:10.1016/j.ssci.2014.10.010
Sohn, H. W., Hong, W. K., Lee, D., Lim, C. Y., Wang, X. Y., and Kim, S. (2014). Optimum tower crane Selection and Supporting Design Management. Int. J. Adv. Robot. Syst. 133 (11), 438. doi:10.5772/58438
Sui, W., Li, H., Zhang, Q., and Wang, Z. (2020). Hysteretic Mechanical Behaviour of an Eccentrically Loaded partially-concrete-filled Steel Tubular Bridge Pier under Out-Of-Plane Horizontal Cyclic Loading. KSCE J. Civ. Eng. 24 (5), 1509–1523. doi:10.1007/s12205-020-0680-3
Tang, Y. C., Chen, Z., Feng, W. H., Nong, Y. M., Li, C., and Chen, J. M. (2021a). Combined Effects of Nano-Silica and Silica Fume on the Mechanical Behavior of Recycled Aggregate concrete. Nanotechnol. Rev. 10 (1), 819–838.
Tang, Y., Feng, W., Chen, Z., Nong, Y., Guan, S., and Sun, J. (2021b). Fracture Behavior of a Sustainable Material: Recycled concrete with Waste Crumb Rubber Subjected to Elevated Temperatures. J. Clean. Prod. 318, 128553. doi:10.1016/j.jclepro.2021.128553
Vivian, W. Y. T., and Ivan, W. H. F. (2011). Tower crane Safety in the Construction Industry: a Hong Kong Study. Saf. Sci 49 (2), 208–215.
Wang, S. C., Shen, R. S., Jin, T. H., and Song, S. J. (2011). Dynamic Behavior Analysis and its Application in tower crane Structure Damage Identification. Adv. Mater. Res. 368-373, 2478–2482. doi:10.4028/www.scientific.net/amr.368-373.2478
Wang, J., Zhang, X., Shou, W., Wang, X., Xu, B., Kim, M. J., et al. (2015). A BIM-Based Approach for Automated tower crane Layout Planning. Automation in Construction 59, 168–178. doi:10.1016/j.autcon.2015.05.006
Wang, H., Li, P. C., and Wu, M. E. (2019). Crossarm Length Optimization and post-buckling Analysis of Prestressed Stayed Steel Columns. Thin-walled Struct. 144, 106371. doi:10.1016/j.tws.2019.106371
Yang, Y., Yang, L., and Yao, G. (2021). Post-processing of High Formwork Monitoring Data Based on the Back Propagation Neural Networks Model and the Autoregressive-Moving-Average Model. Symmetry 13 (8), 1543. doi:10.3390/sym13081543
Yao, G., Wu, C. Y., and Yang, Y. (2021a). Scientometric Analysis for Mechanical Performance on Broken-Line Long-Span Steel Structure in Construction Considering Geometric Nonlinearity. Symmetry 13 (7), 1229. doi:10.3390/sym13071229
Yao, G., Guo, H. T., Yang, Y., Xiang, C. M., and Robert, S. (2021b). Dynamic Characteristics and Time-History Analysis of Hydraulic Climbing Formwork for Seismic Motions. Adv. Civil Eng. 2021, 1–17. doi:10.1155/2021/2139153
Younes, A., and Marzouk, M. (2018). Tower Cranes Layout Planning Using Agent-Based Simulation Considering Activity Conflicts. Automation in Construction 93, 348–360. doi:10.1016/j.autcon.2018.05.030
Zavichi, A., Madani, K., Xanthopoulos, P., and Oloufa, A. A. (2014). Enhanced crane Operations in Construction Using Service Request Optimization. Automation in Construction 47, 69–77. doi:10.1016/j.autcon.2014.07.011
Zhang, Z., Elbashiry, M. A. E., Chen, J., Wei, P., and Fu, Y. (2020). Optimization of the Structural Parameters of the Vertical Trabeculae Beetle Elytron Plate Based on the Mechanical and thermal Insulation Properties. KSCE J. Civ. Eng. 24 (12), 3765–3774. doi:10.1007/s12205-020-2334-x
Zhang, Z. Q., and Pan, W. (2021). Multi-criteria Decision Analysis for tower crane Layout Planning in High-Rise Modular Integrated Construction. Automat. Constr. 127, 103709. doi:10.1016/j.autcon.2021.103709
Zheng, X. J., Zeng, J. B., and Zhang, H. (2013). Research of Intelligent Monitoring System of tower crane Based on RFID. Adv. Mater. Res. 706-708, 990–994. doi:10.4028/www.scientific.net/AMR.706-708.990
Keywords: braced frame joint, destruction mechanism, ultimate bearing capacity, failure mode, concrete strength grade
Citation: Yang Y, Zhang Z, Xu L and Yao G (2022) Mechanical Performance and Failure Mode Research on the Braced Frame Joint of Tower Cranes in High-Rise Building Construction. Front. Mater. 9:824693. doi: 10.3389/fmats.2022.824693
Received: 29 November 2021; Accepted: 15 March 2022;
Published: 08 June 2022.
Edited by:
Fangying Wang, University of Nottingham, United KingdomCopyright © 2022 Yang, Zhang, Xu and Yao. This is an open-access article distributed under the terms of the Creative Commons Attribution License (CC BY). The use, distribution or reproduction in other forums is permitted, provided the original author(s) and the copyright owner(s) are credited and that the original publication in this journal is cited, in accordance with accepted academic practice. No use, distribution or reproduction is permitted which does not comply with these terms.
*Correspondence: Liangjin Xu, eHVsaWFuZ2ppbkB5ZWFoLm5ldA==