 Dongling Xu
 Boyu Yuan2*
 Liang Li
 Chao Wang
- 1Jiangsu Key Laboratory of Green Synthetic Chemistry for Functional Materials, School of Chemistry and Materials Science, Jiangsu Normal University, Xuzhou, China
- 2Jiangsu Key Laboratory of Advanced Laser Materials and Devices, School of Physics and Electronic Engineering, Jiangsu Normal University, Xuzhou, China
The intergranular corrosion of Inconel 690 alloy in NaCl solution was investigated using in-line digital holography to observe the dynamic processes occurring at the electrode| electrolyte interface in both the absence and presence of a magnetic field (MF). MF reduced the anodic currents by 6 and 3% at 1.1 V in 0.5 M NaCl (pH = 6.44) and 0.5 M NaCl +0.01 M NaOH (pH = 11.5) NaCl solutions respectively because it may increase the amount of Cr on the electrode surface and change the structure of the surface film, thus enhancing the formation of an oxide film; however, MF affected the anodic current little due to the low Lorentz force at the low potential. It was observed that the intergranular corrosion began from a certain grain boundary and developed into other grain boundaries with and without MF. Because the anodic dissolution rate of Fe or Ni is much higher with MF than that without MF and the content of Fe or Ni was higher at a grain boundary than that at the other areas on the surface of the electrode, MF accelerated the intergranular corrosion.
Introduction
Inconel 690, a high-chromium content nickel alloy and an important structural material, is used extensively in many areas, including the chemical industry, food processing, and in nuclear power plants, due to its superior mechanical strength and high corrosion resistance. The most extensive use of this alloy is for the tubing in the steam generators of pressurized water reactors (PWRs) (Berge and Donati, 1981). Although it exhibits good corrosion resistance in most environments, it is prone to pitting corrosion and intergranular corrosion (IGC) in the presence of aggressive ions such as Cl− and SCN−. IGC can cause substantial deterioration of the mechanical properties of metals even though grain boundaries account for only a small fraction of the volume of such materials (Michiuchi et al., 2006). Therefore, this work was undertaken in order to study IGC of Inconel 690.
It is generally accepted that the generation and development of IGC are related to the nature of the surface oxide film. There are double-layer oxide films formed on Ni-based alloys, such as Inconel 600 and 690 in high-temperature water. Kuang et al. (Kuang et al., 2011) studied the oxide film of the 690 alloy in water containing 3 ppm O2 at 290°C, and they proposed that the surface film was composed mainly of outer Ni-Fe spinel particles and inner NiO. Huang et al. (2010) studied the passive film on 690 alloy in an alkaline environment at high temperature, and they found that the inner layer was fine-grained chromium oxide or spinel oxide and the outer layer was Ni-Fe spinel oxide and Ni(OH)2. Lim et al. (2019) studied the oxide layer inside the corrosion crack of 690 alloy in a simulated PWR primary water environment, which was also a double-layer structure: the inner layer was Cr2O3 and the outer layer was NixFe1−xCr2O4 spinel. The oxide film was not stable with the presence of the aggressive ions, and thus IGC was induced.
There are three main models of IGC: Cr depletion, second phase precipitation, and grain boundary adsorption. Abraham et al. (2014) proposed that sensitivity to IGC is affected by the precipitation of chromium carbide at grain boundaries and the chromium-poor zone. Younes et al. (1997) studied the effects of heat treatment on resistance to IGC, and they proposed that the ability of the 690 alloy to resist IGC was better than that of the 600 alloy. Sunil et al. (B. et al., 2013) improved IGC resistance of the 600 alloy through thermal mechanical processing. Kaithwas et al. (2020) studied the effect of grain size on the sensitization–desensitization and IGC response of the 600H alloy, and they proposed that microstructures with coarse grains showed enhanced anti-sensitization ability, which was attributed to the inhibition of Cr diffusion from inside the body of the alloy to the grain boundaries by large grains. Recently, Xu et al. (2019) studied IGC of 625-X65 welded joints and found that small grain size and high Fe content were the main reasons for the high sensitivity to IGC of welded joints. In further studies, they also found that the same grain orientation near the grain boundaries of the 625 alloy was the reason for the stronger IGC resistance of low-angle grain boundaries (Zhang et al., 2020).
Even though there are different models of IGC, generally speaking, the Cr depletion model is accepted, which was proposed in the 1930s (Strauss et al., 1930; Bain et al., 1933). According to the “Cr-poor” model, the Cr content was lower at grain boundaries than at the other areas on the surface of electrode. It is well known that sensitization can significantly increase the susceptibility of materials to IGC in corrosive environments due to Cr depletion at grain boundaries. Yin and Faulkner. (2007) developed a new three-dimensional modeling technique to predict chromium depletion from grain boundaries in Ni-Cr-Fe alloys, and the model predicted a natural transition from sensitization to desensitization and a time delay in reaching the minimum chromium concentration at grain boundaries.
Magnetoelectrochemistry has been studied for several decades for its potential applications in industry. When a magnetic field (MF) is applied during the anodic dissolution processes of metallic materials, the Lorentz force (FL), the gradient magnetic force (F
where B and j are MF intensity and the current density, respectively.
Even though there are different opinions about the effects of FL on mass transport processes, it is generally accepted that FL accelerates mass transport processes. However, until now, there has been no agreement about the effects of MFs on electronic transfer processes (Li et al., 2009; Yuan et al., 2009; Yuan et al., 2012; Monzon and Coey, 2014; Zhao et al., 2021).
Despite the use of many different traditional and modern techniques, including electrochemical methods, scanning electronic microscopy (SEM), and energy dispersive X-ray spectrometry (EDS), to study the anodic dissolution of metallic materials, these methods cannot observe in situ the dynamic electrochemical processes occurring at the electrode | electrolyte interface. Therefore, in-line techniques are needed to study these MF effects. In recent years, our group has developed in-line digital holography to observe in situ these interfacial dynamic processes during the anodic dissolution of metallic materials. Recently, we have used in-line digital holography to study the effects of MF on the anodic dissolution of Ni in H3PO4 + SCN− solution (Liu et al., 2020), and we found that MF enhanced IGC of the nickel electrode.
There are few papers on the effects of MF on IGC of Inconel 690 in NaCl solution. In the study reported here, in-line digital holography, a high temporal resolution technique, was used to observe the interfacial dynamic processes during IGC of Inconel 690 in NaCl solutions in the absence or presence of MF. On the basis of the electrochemical results, phase maps, and surface analysis, the effects of MF on IGC of Inconel 690 in Cl−-containing solutions are discussed.
Materials and Methods
A three-electrode system was adopted for these experiments. The working electrodes were prepared with an Inconel 690 wire (d = 1 mm) with the chemical composition listed in Table 1, an iron wire (99.99%, Goodfellow, d = 2 mm), a nickel wire (99.98%, Goodfellow, d = 2 mm), and a chromium piece (99.9%, a Johnson Matthey company, 2 mm × 2 mm), which were sealed with epoxy resin in a glass tube with an inner diameter of 8 mm. Only the surface of the working electrode (cross-section of the metal wire) was exposed to the solution. The counter electrode was platinum sheet (10 × 10 mm), and the reference electrode was a saturated calomel electrode (SCE). A Luggin capillary was placed between the reference and the working electrodes to reduce the IR drop. The electrochemical tests were carried out using a CHI660E electrochemical workstation (CH Instruments, Inc., Austin, TX, United States), and the surface morphologies were observed using an SEM microscope (Hitachi S-3400N SEM, Tokyo, Japan) equipped with EDS. All potentials were referred to SCE. All of the experiments were carried out at room temperature (25 ± 2°C).
Before each experiment, the working electrode was abraded with 600#, 1,200#, and 2,000# metallographic sandpapers and cleaned in an ultrasonic bath with distilled water followed by ethanol. Two solutions including 0.5 M NaCl (pH = 6.44) and 0.5 M NaCl +0.01 M NaOH (pH = 11.5) used in this study were prepared from analytical grade reagents and distilled water, and pH of the solution was adjusted with 1.0 M NaOH solution. Two permanent magnets (100 mT) were used in these experiments.
Figure 1 shows a schematic of the holographic recording system, which was the same as that used in our previous study (Yuan et al., 2012). As shown in Figure 1, a beam was emitted from the He-Ne laser (wavelength: 632.8 nm), reflected by the mirror (M), and then split into two beams by a beam splitter (BS) to form the reference wave and the object wave. The reference wave crossed a neutral density filter (NDF) to modulate its amplitude. The object wave, passing through the electrochemical cell (EC), formed an interference pattern with the modulated reference wave at a charge-coupled device (CCD) image sensor, and the resulting holograms were recorded by a personal computer. Phase maps were reconstructed from the recorded holograms using software written by our research group. The phase maps were reconstructed from the AVI video signals by software developed with MATLAB (copyright by The Mathworks, Inc.). If there was a concentration change (Δc) at the interface, a phase difference (ΔΦ) and a change in refractive index (Δn) were observed. The relationships between ΔΦ, Δc, and Δn are given by Eq. 2 (Yuan et al., 2009).
where k, λ0, and d are the concentrative refractivity, the light wavelength, and the geometrical path length, respectively, when there is a change in refractive index.
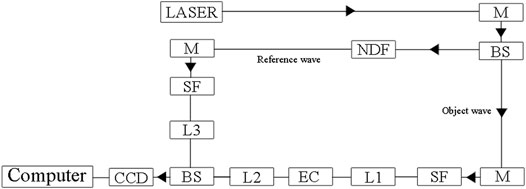
FIGURE 1. The experimental setup of the digital holographic interface imaging system. M—mirror, BS—beam splitter, NDF-neutral density filter, L1–L3—collimating lens, SF—spatial filter, O-object.
Results
Polarization Curves and the Corresponding Phase Maps
Figure 2 shows the polarization curves (Ⅰ) of Inconel 690 in 0.5 M NaCl solution (neutral) at 20 mV/s as well as the corresponding phase maps (Ⅱ) in the absence or presence of MF. As shown in the polarization curves (Ⅰ) in Figure 2, MF has only a small effect on the anodic current when E < 1.0 V because FL is low due to the low current; however, it reduces the current when E > 1.0 V. X, Y, and Z show the horizontal direction, optical axis direction, and opposite direction of gravity, respectively. Figures 2A, 2A1 were obtained at the open circuit potential (OCP). The left and right sides of the black line in the middle of the phase map (Figures 2A, 2A1) are the electrode and electrolyte, respectively. The relationships between Δc, ΔΦ, and the colors in the phase maps can be illustrated as follows: If ΔΦ < 0, Δc < 0, the phase map is blue; if ΔΦ = 0, Δc = 0, it is green; and if ΔΦ > 0, Δc > 0, it is yellow or red and Δc increases with ΔΦ.
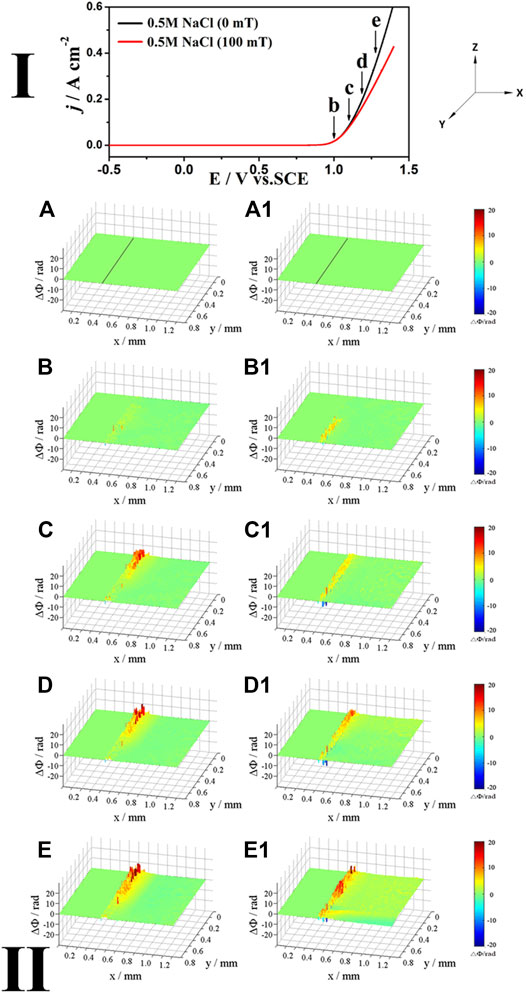
FIGURE 2. The polarization curves (Ⅰ) of Inconel 690 in 0.5 M NaCl (neutral) solutions without and with MF and the phase maps (Ⅱ) at different potentials corresponding to points (B–E) in the polarization curves, (A,A1) obtained at OCP (the same below).
As shown in the phase maps (Ⅱ) in Figure 2, at the low potential (point b), the yellow areas appear at the local interface without (Figure 2B) or with (Figure 2B1) MF, indicating that the local concentration increases at the interface; however, it is higher with MF than without one. As the potential shifts positively to point c, the yellow and red areas at the interface extend to the solution (Figure 2C) due to the more soluble species produced at the interface as the current increases without MF. Because the concentration in the red area is much higher than that in the yellow area, the diffusion layer is not uniform at the interface without MF (Figure 2C); however, it is almost uniform with MF (Figure 2C1) because MF accelerates mass transport processes. As the potential increases to points d and e, light blue areas appear out of the red and yellow areas (Figures 2D,E) at the interface without MF, while MF induces convection (Figure 2D1), which is enhanced at point e (Figure 2E1). Blue areas appear out of the yellow areas (Figures 2D,E,2D1,2E1), indicating that the concentration decreases and a surface film may be formed both without and with MF.
Figure 3 shows the polarization curves (Ⅰ) of Inconel 690 in 0.5 M NaCl + 0.01 M NaOH solutions at 10 mV/s as well as the corresponding phase maps (Ⅱ) in the absence or presence of MF. As shown in the polarization curves (Ⅰ) in Figure 3, when E < 0.95 V, MF has little effect on the current due to its low value; however, the current increases quickly with the positive shift in potential, and MF reduces the current when E > 0.95 V.
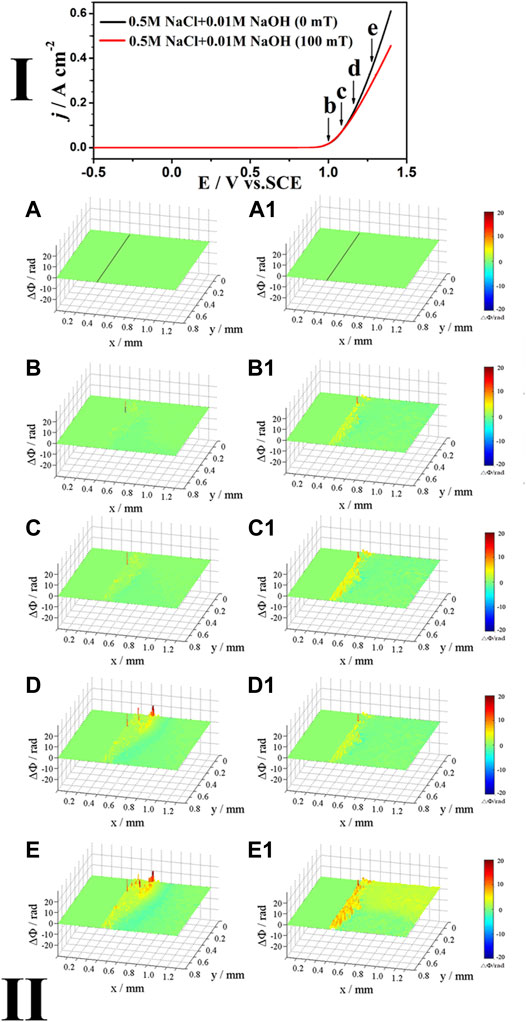
FIGURE 3. The polarization curves (Ⅰ) of Inconel 690 in 0.5 M NaCl + 0.01 M NaOH solutions without and with MF and the phase maps (Ⅱ) at different potentials corresponding to points (B–E) in the polarization curves.
As shown in the phase maps in the part Ⅰ of Figure 3, the concentration increases at the local interface both without (Figure 3B) and with (Figure 3B1) MF at the potential corresponding to point b. As the potential shifts positively from point c to point e, there are two layers at the interface without MF (Figures 3C–E): the yellow and/or red layer (inner) and the blue layer (outer), and the blue layer appears at a relatively lower potential in Figure 3 than that in Figure 1, indicating that the surface film was formed more easily in the alkaline solution than in the neutral one. The concentrations at the interface are higher with MF (Figures 3C1, 3D1) than these without MF at points c and d (Figures 3C,D). As the potential increased to point e, MF induced convection at the interface (Figure 3E1).
Effects of MF on the j–t Curves
Figure 4 shows the j–t curves (Ⅰ) of Inconel 690 in 0.5 M NaCl solution at E = 1.1 V both without and with MF, as well as the corresponding phase maps (Ⅱ). As shown in the j–t curves (Ⅰ) in Figure 4, MF reduced the anodic currents by 6%.
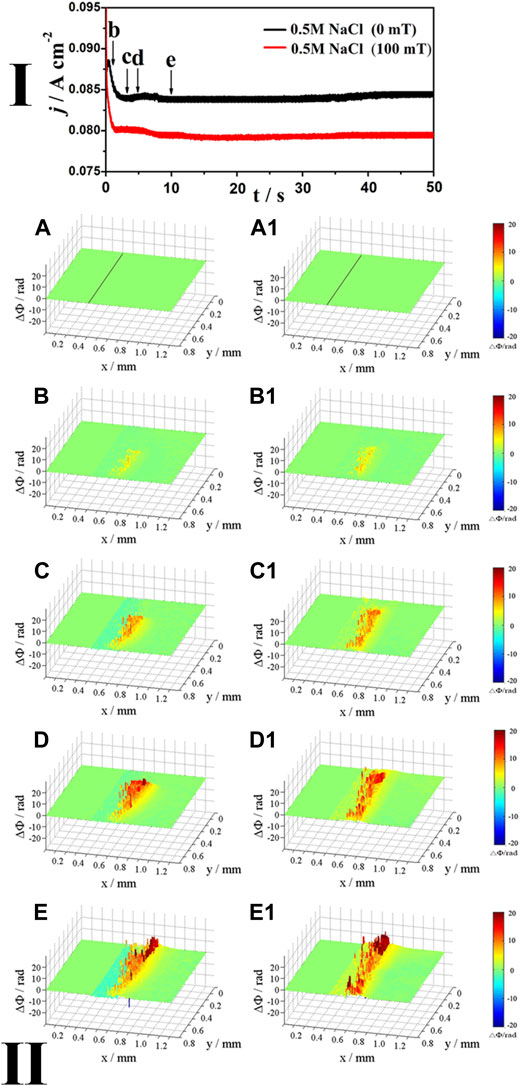
FIGURE 4. The j-t curves (Ⅰ) of Inconel 690 in 0.5 M NaCl (neutral) solutions without and with MF at 1.1 V and the phase maps (Ⅱ) at different times corresponding to points (B–E) in the j-t curves, respectively.
As shown in the phase maps in the part Ⅱ of Figure 4, at the initial stage (point b), the local concentration increases at the interface either without (Figure 4B) or with MF (Figure 4B1). Going from point c to point d, there are two layers at the interface: the red/yellow layer (outer) and the blue layer (inner) without MF (Figures 4C–E); however, only red/yellow areas are observed with MF (Figure 4C1–4E1), and the diffusion layer thickens with time. In the absence of MF, the concentration increases locally with time in the red/yellow area from point b to point e, but decreases in the blue area (). The diffusion layer is thicker and the concentrations are higher with MF (Figure 4C1–4E1) than those without MF (Figures 4C–E).
Figure 5 shows the j–t curves (Ⅰ) of Inconel 690 in 0.5 M NaCl + 0.01 M NaOH solutions at E = 1.1 V both without and with MF, as well as the corresponding phase maps (Ⅱ). As shown in the j–t curves (Ⅰ) in Figure 5, MF reduces the current by 3%.
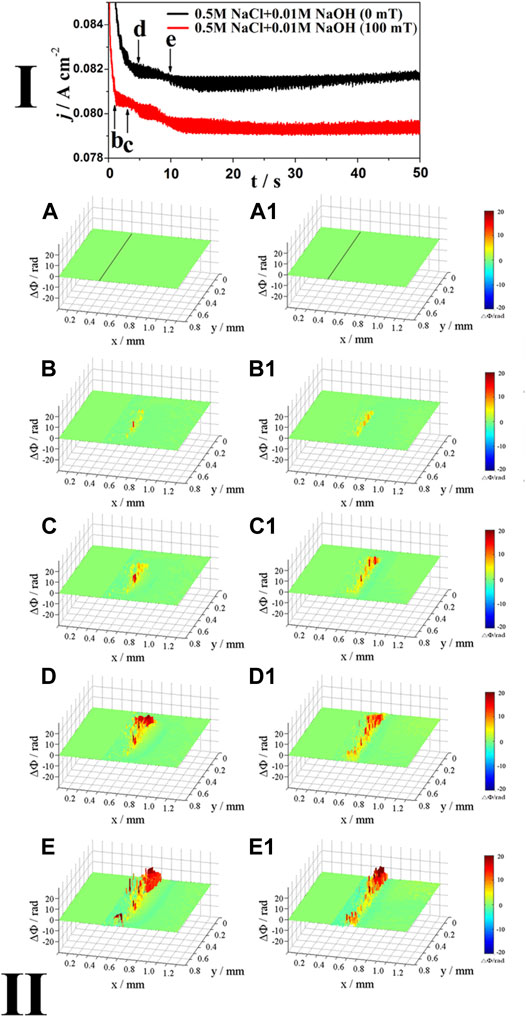
FIGURE 5. The j-t curves (Ⅰ) of Inconel 690 in 0.5 M NaCl +0.01 M NaOH solutions without and with MF at 1.1 V and the phase maps (Ⅱ) at different times corresponding to points (B–E) in the j-t curves.
As shown in the phase maps (Ⅱ) in Figure 5, at point b, the local concentration increases at the interface both without (Figure 5B) and with MF (Figure 5B1). As the potential increases from point c to point e, there are two layers at the interface: the blue (inner) layer and the red/yellow (outer) layer without (Figures 5C–E) and with MF (Figure 5C1,5D1), respectively, and the blue areas became darker with time, indicating that the surface film thickened.
Different from Figure 2E1, Figure 3E1, Figure 4E1 with MF, MF did not induce convection at the interface because the corrosion products (precipitated in the blue area) easily formed on the surface in the alkaline NaCl solution to inhibit MF effects (Chiba et al., 1988; Monzon and Coey, 2014).
As shown the j-t curves in Figures 4, 5, MF reduces the anodic current more significantly in neutral solution than in alkaline solution because the oxide film is easily formed to inhibit the MF effects in alkaline solution. As shown the phase maps in Figures 4, 5, there are two layer at the interface: the blue layer (inner) and the outer layer (outer). This can be explained as follows: at the high potential (1.1 V), the anodic dissolution is so fast that the concentration of ions (Mn+, M = Ni, Fe, and Cr) at the interface increases rapidly, and then hydrolysis of these ions or the formation of the salt film (MCln) leads to the decrease of the concentration (the blue layer) without MF. The hydrolysis product may continue to be oxidized or the salt film may dissolve to increase the concentration (the yellow and/or red layer) at the interface again. With the presence of MF, these ions are not easily hydrolyzed and the salt film is not easily formed because MF enhances the mass transport processes and drives these ions away from the interface to decrease the concentration at the interface in the neutral NaCl solution. However, in alkaline NaCl solution, the blue layer is also observed even though MF is applied and the decrease of the concentration may be mainly attributed to the formation of the oxide film due to the high pH of the solution.
Surface Analysis
Figure 6 shows the surface morphologies of Inconel 690 before and after anodic dissolution at 1.1 V in 0.5 M NaCl solution both without and with MF for 50 s. The surface of the electrode is smooth (Figure 6A), and there were lots of scratches left by the abrasion with the sandpapers (Figure 6A1) before the test. Following anodic dissolution, there were corrosion products on the surface of the electrodes both without (Figure 6B) and with (Figure 6C) MF, and there were many pits on the surface of the electrode and corrosion occurred at grain boundaries (IGC) both without (Figure 6B1) and with (Figure 6C1) MF. The depths of the pits were much deeper without (Figure 6B1) MF than with (Figure 6C1) one, indicating that MF inhibited pitting corrosion; however, the corrosion at the grain boundaries was much more serious with MF than without one, which indicates that MF enhanced IGC.
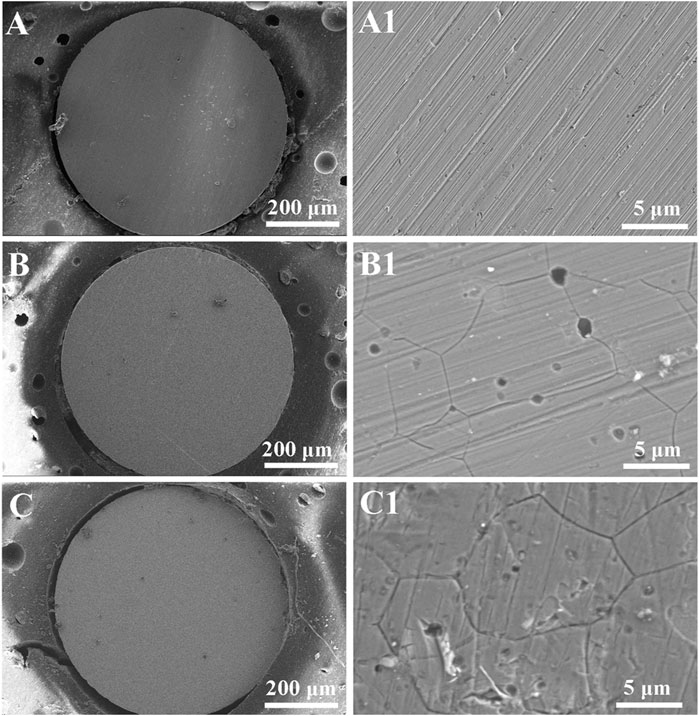
FIGURE 6. Surface morphologies of Inconel 690 recorded before (A,A1) and after potentiostatic polarization at 1.1 V for 50 s in 0.5 M NaCl (neutral) solutions without (B,B1) and with MF (C,C1).
Figure 7 shows the surface morphologies of Inconel 690 following anodic dissolution in 0.5 M NaCl +0.01 M NaOH solution at 1.1 V both without and with MF for 50 s. Figures 6A, 6A1 shows the surface morphologies before the test. Corrosion products were also observed on the surface both without (Figure 7B) and with (Figure 7C) MF, and pitting corrosion and IGC were also observed on the surface both without (Figure 7B1) and with (Figure 7C1) MF. MF also inhibited pitting corrosion but enhanced IGC.
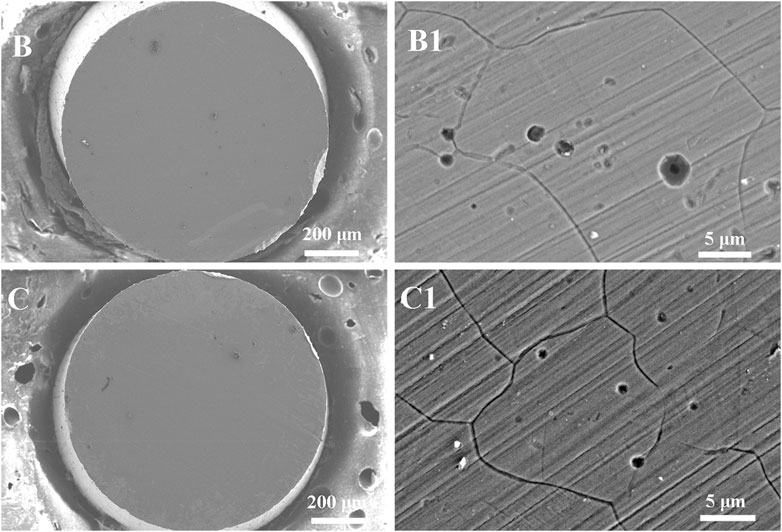
FIGURE 7. Surface morphologies of Inconel 690 recorded after potentiostatic polarization at 1.1 V for 50 s in 0.5 M NaCl +0.01 M NaOH solutions without (B,B1) and with MF (C,C1).
To study MF effects further, the chemical composition of the electrode surfaces following anodic dissolution in 0.5 M NaCl (neutral) solution both without and with MF was determined using EDS and XPS.
Figure 8 shows EDS elemental mapping of the electrode before (A-D) and after the anodic dissolution without (A1-D1) and with (A2-D2) magnetic field corresponding to Figure 6A1, Figure 6B1 and Figure 6C1, respectively. As shown in Figure 8, compared with the elemental compositions before the test, the Cr and O contents increased but those of Fe and Ni decreased following anodic dissolution without MF, indicating that the dissolution of the electrode was mainly caused by Fe and Ni. The Cr content is slight higher and the O contents were much higher with MF than that without one, indicating that MF enhanced the formation of the oxide film. As shown in Figure 8, the content of Fe or Ni with MF cannot be distinguished with that without MF.
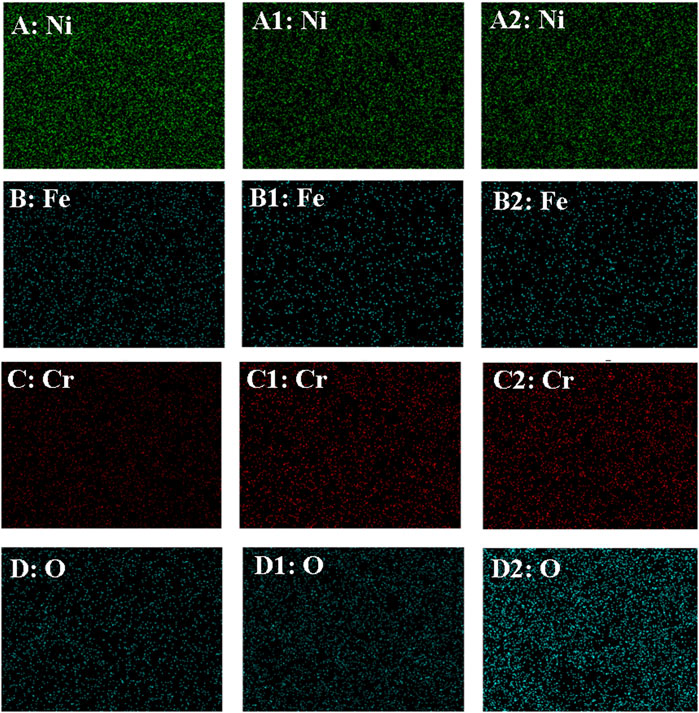
FIGURE 8. EDS elemental mapping of the electrode before (A–D) and after the anodic dissolution without (A1–D1) and with (A2–D2) MF.
Figure 9 shows XPS spectra obtained from Inconel 690 after anodic dissolution in 0.5 M NaCl solution at 1.1 V without (Figures 9A,B) and with MF (Figures 9A1, 9B1) corresponding to Figure 6B1,6C1, respectively. Compared with the valence of chromium and nickel after the anodic dissolution without MF, Cr (Ⅳ) and nickel (Ⅲ) are observed with MF. The intermediate phase [Cr (Ⅳ)] are postulated as decomposition products of CrO3 (Chamberland, 1977).
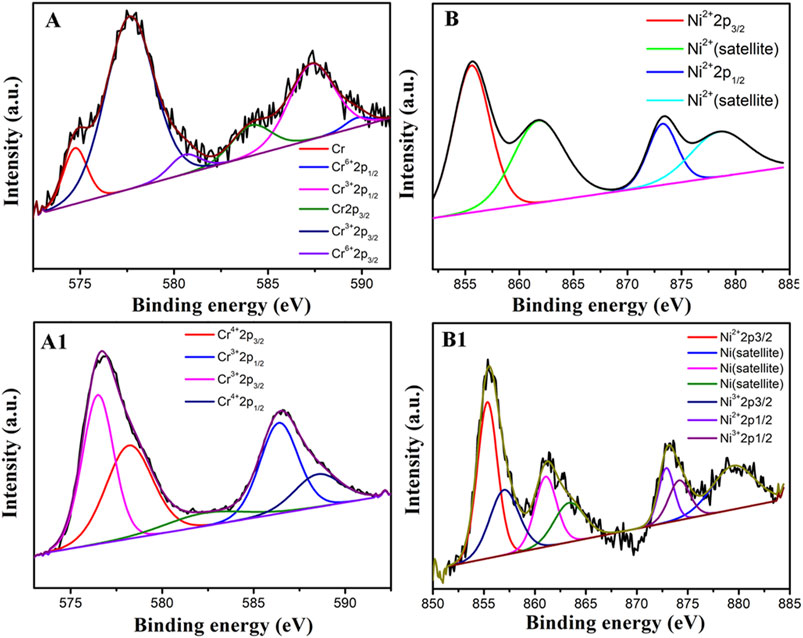
FIGURE 9. XPS spectra obtained from Inconel 690 after anodic dissolution in 0.5 M NaCl solution 50 s at 1.1 V without (A,B) and with MF (A1,B1) corresponding to Figure 6B1 and Figure 6C1, respectively.
Discussion
It is generally accepted that there were defects in the grain boundaries, such as a distorted crystallographic structures, possible segregation of impurities, and second phases, the grain boundaries themselves were corroded more easily than other areas on the surface of the electrode. Thus, an oxide film was readily formed at the grain boundaries. Moreover, in the presence of Cl− ions, the electrode is sensitized and the film at the grain boundaries may be dissolved easily.
As shown by the phase maps in Figures 2–5, in the initial stage (point b), it was observed that the concentration always increased locally at the interface, that is to say, the intergranular corrosion may begin from a certain grain boundary with and without MF. With increasing potential or polarization time, the concentration of the soluble species at the interface increased considerably and was distributed more unevenly at the interface without MF than with MF because MF enhanced the mass transport processes. However, at a relatively high potential (Figure 2E1, Figure 3E1, and Figure 4E1), the concentration was also uneven at the interface, which indicated that IGC also propagated at the relatively high potential even though MF was applied.
Because the excellent corrosion resistance of Inconel 690 is attributed mainly to the formation of a passive film in oxidizing solutions, it can readily be deduced that the reduction in current by MF is caused by its effects on the oxide film. There may be two reasons why MF affects the oxide film:
1) As shown in Figure 9, in the presence of MF, the valance of Ni was higher with MF than that without MF. Thus, the surface film may become denser with MF than that without MF;
2) According to the “Cr-poor” model, the content of Cr was lower but that of Fe or Ni was higher at the grain boundaries than at other areas on the electrode surface. MF may accelerate the anodic dissolution of Fe or Ni much more at the grain boundaries, thereby enhancing IGC of alloy 690. Meanwhile, the content of Cr (Figure 8) may increase to enhance the formation of the oxide film on the surface of the electrode.
As a result, MF decreased the anodic current and inhibited the pitting corrosion because MF may enhance the formation of the surface film (Li et al., 2016) by changing the structure of the surface film and increasing the content of Cr on the surface. MF enhanced the mass transport processes to avoid local acidification, so MF inhibited pitting corrosion.

TABLE 1. Composition of the alloy 690 (wt%).
To verify this hypothesis, the effects of MF on the anodic dissolution of pure Fe, Cr, and Ni were measured. Figure 10 shows the j–t curves of Fe, Cr, and Ni in 0.5 M NaCl (Figure 10A) and 0.5 M NaCl +0.01 M NaOH (Figure 10B) solutions at E = 1.1 V, respectively. As shown in Figure 10, MF always increased the anodic currents of Fe, Ni, and Cr; however, the current for Fe or Ni was about 30 times higher than that for Cr in either neutral or alkaline NaCl solution, and this is why MF increased the content of Cr. Thus the effect of MF on IGC can be illustrated as follows:
1) The anodic dissolution of Inconel 690 is mainly due to that of Fe and Ni because the anodic dissolution rate of Ni or Fe is much faster than that of Cr;
2) MF enhanced the anodic dissolution of Fe or Ni much more the grain boundaries because the content of Fe or Ni was higher at the grain boundaries than at other areas on the electrode surface according to the “Cr-poor” model;
3) As a result, MF enhanced IGC, and the hypothesis was verified.
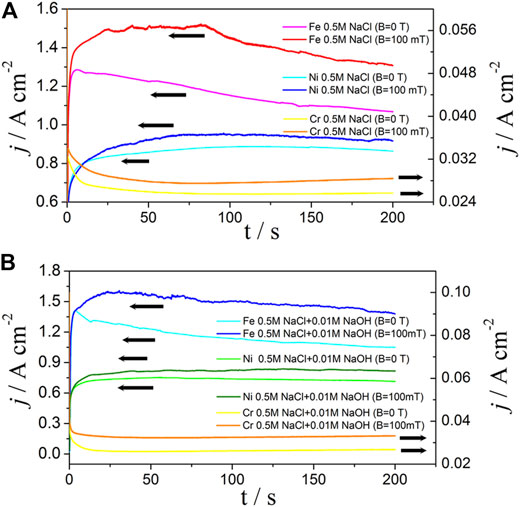
FIGURE 10. The j-t curves of pure iron, nickel, and chromium in 0.5 M NaCl (A) and 0.5 M NaCl + 0.01 M NaOH (B) solutions without and with MF at 1.1 V, respectively.
Concluding Remarks
The dynamic processes occurring at the Inconel 690 | NaCl interface were observed using digital holography both in the presence and absence of a magnetic field (MF). In light of the experimental results, the following conclusions were drawn.
1) In neutral or alkaline NaCl solution, Cl− ions induced IGC of Inconel 690 in neutral and alkaline NaCl solutions, and it was observed that IGC may begin from a certain grain boundary and develop into other grain boundaries with and without MF either.
2) MF reduced the anodic currents by 6 and 3% at 1.1 V in 0.5 M NaCl (pH = 6.44) and 0.5 M NaCl +0.01 M NaOH (pH = 11.5) NaCl solutions, respectively, and it also inhibited the pitting corrosion because it may enhance the formation of the surface film by changing the structure of the surface film and increasing the contents of Cr and O on the surface, and it also inhibited pitting corrosion by enhancing the mass transport processes to avoid local acidification;
3) MF promoted IGC of Inconel 690 because it enhanced the anodic dissolution of Ni and Fe much more and the content of Fe or Ni was much higher at the grain boundaries than that at the other areas on the surface of the electrode according to the Cr-poor model.
Data Availability Statement
The raw data supporting the conclusion of this article will be made available by the authors, without undue reservation.
Author Contributions
DX: Investigation, Validation, Writing—Original draft preparation. BY: Conceptualization, Writing—Reviewing and Editing, Project administration, Holography methodology, Software. LL: Supervision, Conceptualization, Writing—Reviewing and Editing, Project administration, Funding acquisition. CW: Validation, Holography methodology.
Funding
This research was supported by the National Natural Science Foundation of China (No. 21972059).
Conflict of Interest
The authors declare that the research was conducted in the absence of any commercial or financial relationships that could be construed as a potential conflict of interest.
Publisher’s Note
All claims expressed in this article are solely those of the authors and do not necessarily represent those of their affiliated organizations, or those of the publisher, the editors and the reviewers. Any product that may be evaluated in this article, or claim that may be made by its manufacturer, is not guaranteed or endorsed by the publisher.
References
Abraham, G. J., Bhambroo, R., Kain, V., Dey, G. K., and Raja, V. S. (2014). Intergranular Corrosion Susceptibility of Alloy 600 after Autogenous Tungsten Inert Gas and Laser Beam Welding Using Electrochemical Technique. High Temp. Mater. Proc. 33, 137–146. doi:10.1515/htmp-2013-0045
Bain, E. C., Aborn, R. H., and Rutherford, J. J. B. (1933). The Nature and Prevention of Intergranular Corrosion in Austenitic Stainless Steels. Trans. Am. Soc. Steel Treating 21, 481–509.
Berge, P., and Donati, J. R. (1981). Materials Requirements for Pressurized Water Reactor Steam Generator Tubing. Nucl. Tech. 55, 88–104. doi:10.13182/NT81-A32833
B., S. K., Prasad, B. S., Kain, V., and Reddy, J. (2013). Methods for Making alloy 600 Resistant to Sensitization and Intergranular Corrosion. Corrosion Sci. 70, 55–61. doi:10.1016/j.corsci.2012.12.021
Chamberland, B. L. (1977). The Chemical and Physical Properties of CrO2and Tetravalent Chromium Oxide Derivatives. Crit. Rev. Solid State. Mater. Sci. 7 (1), 1–31. doi:10.1080/10408437708243431
Chiba, A., Okada, M., and Ogawa, T. (1988). Magnetic Field Effects on Dissolution of Nickel, Copper, Zinc and Brass in Nitric Acid Solution. Boshoku Gijutsu (Japanese) 37, 259–264. doi:10.3323/jcorr1974.37.5_259
Espina-Hernández, J. H., Caleyo, F., Venegas, V., and Hallen, J. M. (2011). Pitting Corrosion in Low Carbon Steel Influenced by Remanent Magnetizationfluenced by Remanent Magnetization. Corrosion Sci. 53, 3100–3107. doi:10.1016/j.corsci.2011.05.044
Huang, J., Wu, X., and Han, E.-H. (2010). Electrochemical Properties and Growth Mechanism of Passive Films on Alloy 690 in High-Temperature Alkaline Environments. Corrosion Sci. 52, 3444–3452. doi:10.1016/j.corsci.2010.06.016
Kaithwas, C. K., Bhuyan, P., Pradhan, S. K., and Mandal, S. (2020). 'Hall-Petch' Type of Relationship between the Extent of Intergranular Corrosion and Grain Size in a Ni-Based Superalloy. Corrosion Sci. 175, 108868. doi:10.1016/j.corsci.2020.108868
Kuang, W., Wu, X., Han, E.-H., and Rao, J. (2011). The Mechanism of Oxide Film Formation on Alloy 690 in Oxygenated High Temperature Water. Corrosion Sci. 53, 3853–3860. doi:10.1016/j.corsci.2011.07.038
Li, L., Wang, W., Wang, C., and Chen, S. (2009). Effects of an Applied Magnetic Field on the Anodic Dissolution of Nickel in HNO3 + Cl− Solution. Electrochemistry Commun. 11, 2109–2112. doi:10.1016/j.elecom.2009.09.006
Li, X., Zhang, M., Yuan, B., Li, L., and Wang, C. (2016). Effects of the Magnetic Field on the Corrosion Dissolution of the 304 SS│FeCl3 System. Electrochimica Acta 222, 619–626. doi:10.1016/j.electacta.2016.11.017
Lim, Y. S., Kim, D. J., Kim, S. W., Hwang, S. S., and Kim, H. P. (2019). Characterization of Internal and Intergranular Oxidation in Alloy 690 Exposed to Simulated PWR Primary Water and its Implications with Regard to Stress Corrosion Cracking. Mater. Characterization 157, 109922. doi:10.1016/j.matchar.2019.109922
Liu, S., Shao, Y., Yan, C., Yuan, B., Li, L., and Wang, C. (2020). Effects of the Magnetic Field on the Anodic Dissolution of Ni│H3PO4 + KSCN System. Corrosion Sci. 169, 108614. doi:10.1016/j.corsci.2020.108614
Michiuchi, M., Kokawa, H., Wang, Z. J., Sato, Y. S., and Sakai, K. (2006). Twin-induced Grain Boundary Engineering for 316 Austenitic Stainless Steel. Acta Materialia 54, 5179–5184. doi:10.1016/j.actamat.2006.06.030
Monzon, L. M. A., and Coey, J. M. D. (2014). Magnetic fields in Electrochemistry: The Lorentz Force. A Mini-Review. Electrochemistry Commun. 42, 38–41. doi:10.1016/j.elecom.2014.02.006
Strauss, B., Schottry, H., and Hinnüber, J. (1930). Die Carbidausscheidung beim Glühen von nichtrostendem unmagnetischem Chromnickelstahl. Z. Anorg. Allg. Chem. 188, 309–324. doi:10.1002/zaac.19301880125
Sueptitz, R., Koza, J., Uhlemann, M., Gebert, A., and Schultz, L. (2009). Magnetic Field Effect on the Anodic Behaviour of a Ferromagnetic Electrode in Acidic Solutionsfield Effect on the Anodic Behavior of a Ferromagnetic Electrode in Acidic Solutions. Electrochimica Acta 54, 2229–2233. doi:10.1016/j.electacta.2008.10.055
Sueptitz, R., Tschulik, K., Uhlemann, M., Katter, M., Schultz, L., and Gebert, A. (2011). Effect of Magnetization State on the Corrosion Behaviour of NdFeB Permanent Magnets. Corrosion Sci. 53, 2843–2852. doi:10.1016/j.corsci.2011.05.022
Wang, X., Zhao, J., Hu, Y., Li, L., and Wang, C. (2014). Effects of the Lorentz Force and the Gradient Magnetic Force on the Anodic Dissolution of Nickel in HNO3+NaCl Solution. Electrochimica Acta 117, 113–119. doi:10.1016/j.electacta.2013.11.100
Xu, L., Zhang, J., Han, Y., Zhao, L., and Jing, H. (2019). Insights into the Intergranular Corrosion of Overlay Welded Joints of X65-Inconel 625 Clad Pipe and its Relationship to Damage Penetration. Corrosion Sci. 160, 108169. doi:10.1016/j.corsci.2019.108169
Yang, X., Chen, S., Li, L., and Wang, C. (2006). Digital Holographic Study of the Effect of Magnetic Field on the Potentiostatic Current Oscillations of Iron in Sulfuric Acid. J. Electroanalytical Chem. 586, 173–179. doi:10.1016/j.jelechem.2005.10.008
Yin, Y. F., and Faulkner, R. G. (2007). Model Predictions of Grain Boundary Chromium Depletion in Inconel 690. Corrosion Sci. 49, 2177–2197. doi:10.1016/j.corsci.2006.10.022
Younes, C. M., Morrissey, F. H., Allen, G. C., and McIntyre, P. (1997). Effect of Heat Treatment on Grain Boundary Chemistry and Resistance to Intergranular Corrosion of Alloys 600 and 690. Br. Corrosion J. 32, 185–192. doi:10.1179/00070599779811484110.1179/bcj.1997.32.3.185
Yuan, B., Wang, C., Li, L., and Chen, S. (2012). Investigation of the Effects of the Magnetic Field on the Anodic Dissolution of Copper in NaCl Solutions with Holography. Corrosion Sci. 58, 69–78. doi:10.1016/j.corsci.2012.01.005
Yuan, B., Wang, C., Li, L., and Chen, S. (2009). Real Time Observation of the Anodic Dissolution of Copper in NaCl Solution with the Digital Holography. Electrochemistry Commun. 11, 1373–1376. doi:10.1016/j.elecom.2009.05.008
Zhang, J., Xu, L., Han, Y., Zhao, L., and Xiao, B. (2020). New Perspectives on the Grain Boundary Misorientation Angle Dependent Intergranular Corrosion of Polycrystalline Nickel-Based 625 Alloy. Corrosion Sci. 172, 108718. doi:10.1016/j.corsci.2020.108718
Keywords: inconel 690, Cl-, intergranular corrosion (IGC), magnetic field—effects, digital holography (DH)
Citation: Xu D, Yuan B, Li L and Wang C (2022) Effects of a Magnetic Field on the Intergranular Corrosion of Inconel 690 in NaCl Solution. Front. Mater. 9:820636. doi: 10.3389/fmats.2022.820636
Received: 23 November 2021; Accepted: 03 January 2022;
Published: 01 February 2022.
Edited by:
Long Xin, University of Science and Technology Beijing, ChinaReviewed by:
Debdulal Das, Indian Institute of Engineering Science and Technology, Shibpur, IndiaAmeeq Farooq, University of the Punjab, Pakistan
Copyright © 2022 Xu, Yuan, Li and Wang. This is an open-access article distributed under the terms of the Creative Commons Attribution License (CC BY). The use, distribution or reproduction in other forums is permitted, provided the original author(s) and the copyright owner(s) are credited and that the original publication in this journal is cited, in accordance with accepted academic practice. No use, distribution or reproduction is permitted which does not comply with these terms.
*Correspondence: Boyu Yuan, eXVhbmJ5QGpzbnUuZWR1LmNu; Liang Li, bGlsQGpzbnUuZWR1LmNu